Discovery
This plugin can be integrated with Pandora FMS Discovery.
To do so, you must load the “.disco” package that you can download from the Pandora FMS library:
https://pandorafms.com/library/
Once loaded, JMX environments can be monitored by creating Discovery tasks from the Management > Discovery > App section.
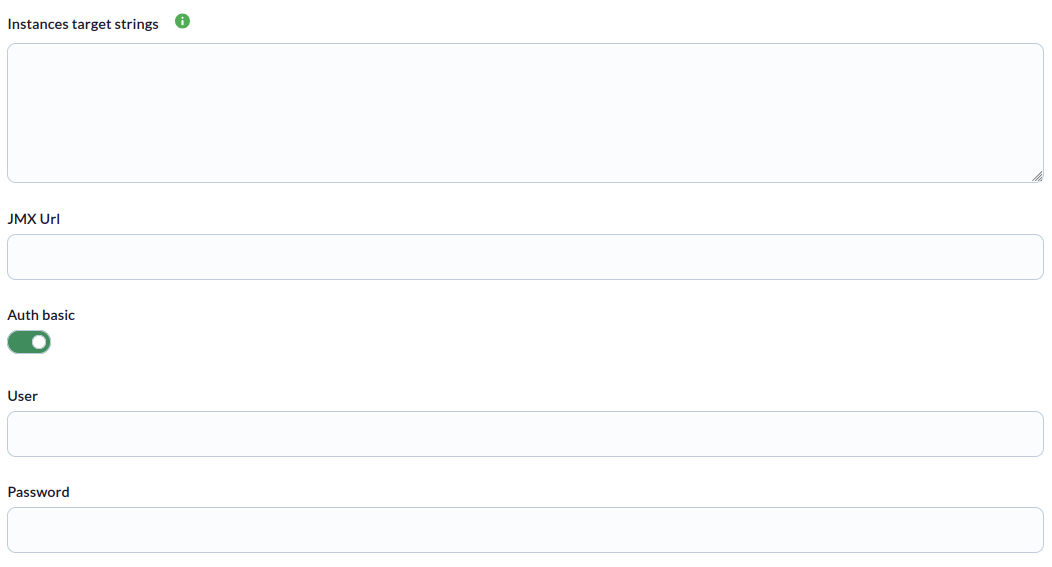
The following minimum data will be requested for each task:
- Instances target strings:
Example:
service:jmx:rmi:///jndi/rmi://172.17.0.1:9090/jmxrmi
service:jmx:rmi:///jndi/rmi://172.12.0.23:9090/jmxrmi
service:jmx:rmi:///jndi/rmi://172.11.0.1:9090/jmxrmi- JMX URL: URL of the instance from which the MBeans will be discovered (the metrics of the selected MBeans will be obtained for all specified instance targets).
- Auth basic: Check to enable basic authentication
- User: User of the java environment
- Password : Password of the java environment
On the next screen, you can select the discovered Mbeans, and the attributes of each selected mbean will be monitored.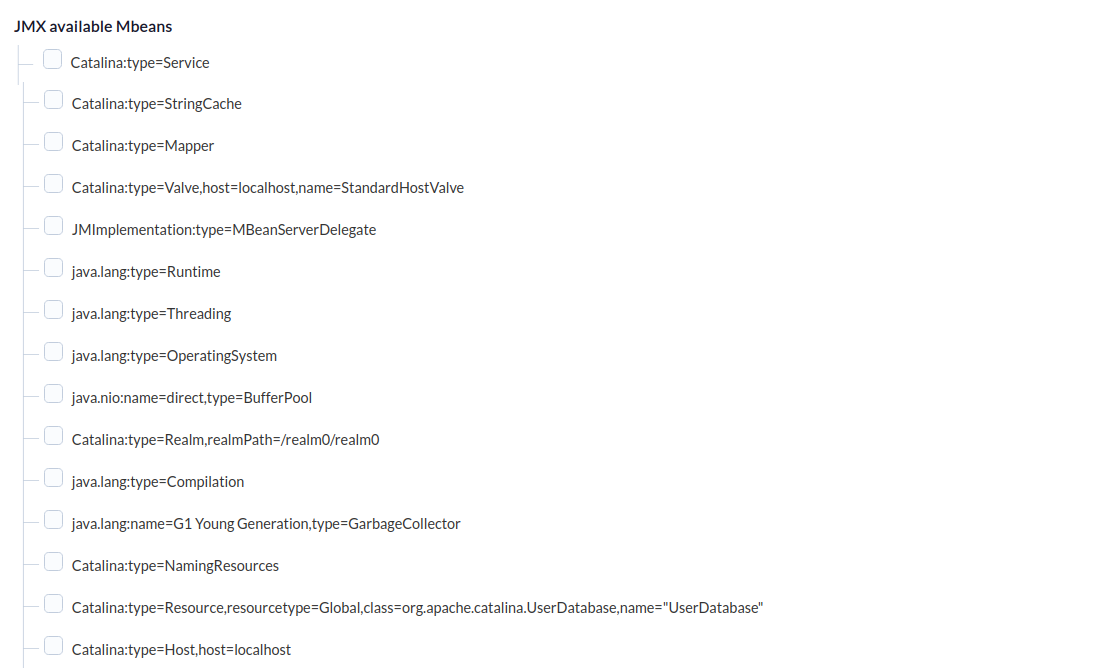
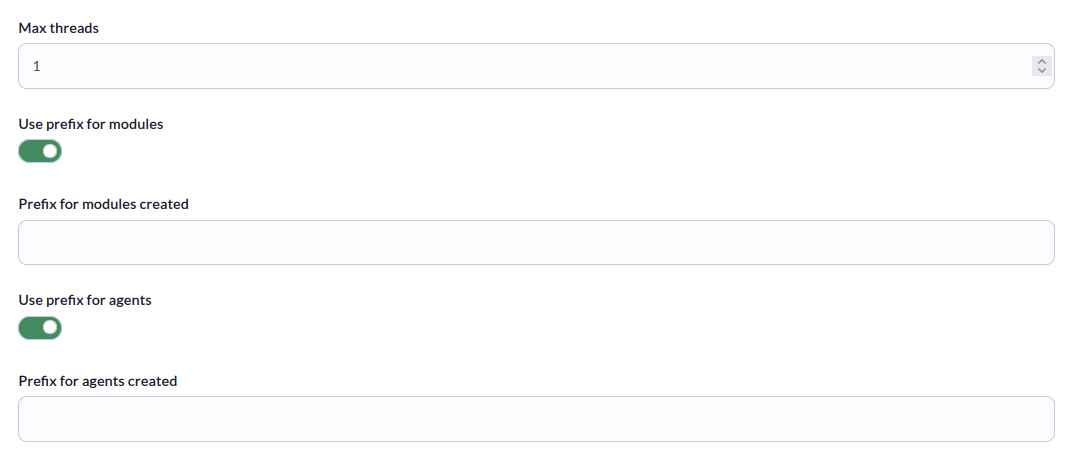
And in the next screen :
- Max threads: Number of threads to use in the task.
- Use prefix for modules: Check to specify a prefix for modules.
- Prefix for modules created: Prefix for created modules.
- Use prefix for agent: Check to specify a prefix for modules.
- Prefix for agents created: Prefix for created agents.
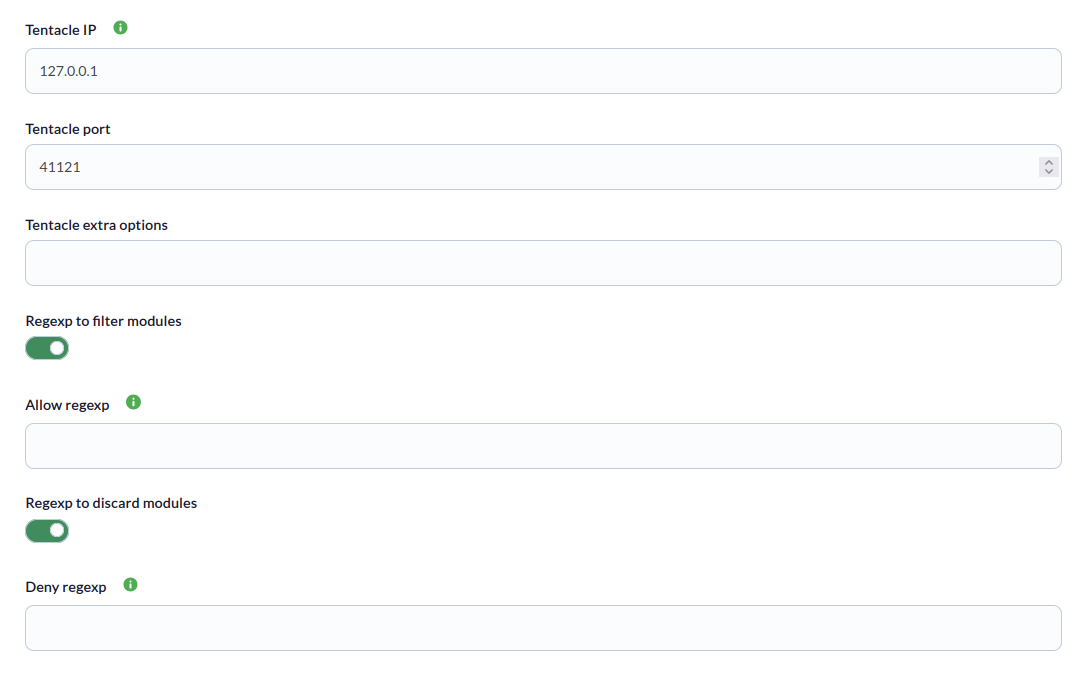
- Tentacle IP: Tentacle address.
- Tentacle port: Tentacle port.
- Tentacle extra options: Tentacle extra options.
- Regexp to filter modules: Check to specify a regexp pattern that will create only metrics that match the pattern, you can see the metrics for each Mbean listed in the “Metrics” section.
- Allow regexp: Regexp pattern that will create only metrics that match the pattern, you can see the metrics for each Mbean listed in the “Metrics” section.
- Regexp to discard modules: Check to specify a regexp pattern that will discard metrics that match the pattern, you can see the metrics for each Mbean listed in the “Metrics” section.
- Deny regexp: Regexp pattern that will discard metrics that match the pattern, you can see the metrics for each Mbean listed in the “Metrics” section.
- Custom Metrics: Custom metrics to monitor (independent of the selected Mbeans; if the metric already exists in a selected Mbean, it will only be created once).
- Rename default modules: Check to specify a new name for the desired metrics.
- Modules names: Name of the metric you want to rename in the module name AND name of the desired module for that metric separated by “|”, for example:
java.lang:name=CodeHeap 'non-nmethods',type=MemoryPool/PeakUsage/max | Memory.usage.max
Catalina:type=Service/name | Catalina.service.name
For each line an attribute must be added and this will create a module with that statistic in Pandora. If it is necessary to configure thresholds, they must be specified to the right of the attribute, separating each threshold by |. Example:
Metric without threshold
java.lang:type=Threading/ThreadCount

Metric with threshold
java.lang:type=Threading/TotalStartedThreadCount|min_warning 30|min_critical 45

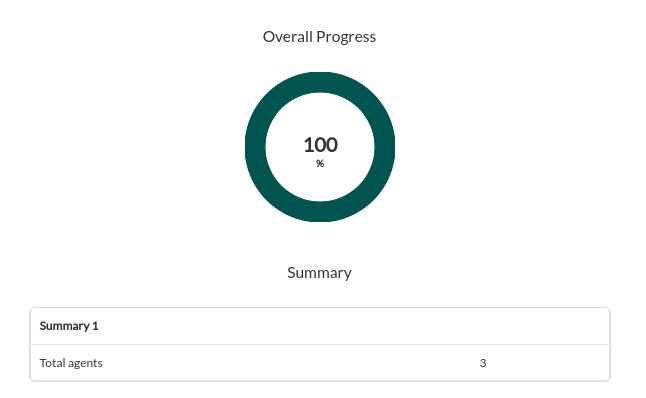
Successfully completed tasks will have an execution summary with the following information:
- Total agents : Total number of agents generated by the task.