
20. Basic Architecture
Pandora FMS servers
The Servers are integrated into a single application, generically called Pandora Server, which is a multithreaded application that concurrently executes different instances or specialized Pandora FMS servers. These are the elements in charge of performing the existing checks, as they verify and change their status according to the results obtained. They are also in charge of triggering the alerts that are established to control the data status.
Pandora FMS automatically manages the status of each server, its load level and other parameters. The user can monitor the status of each server through the server status section of the Web Console.
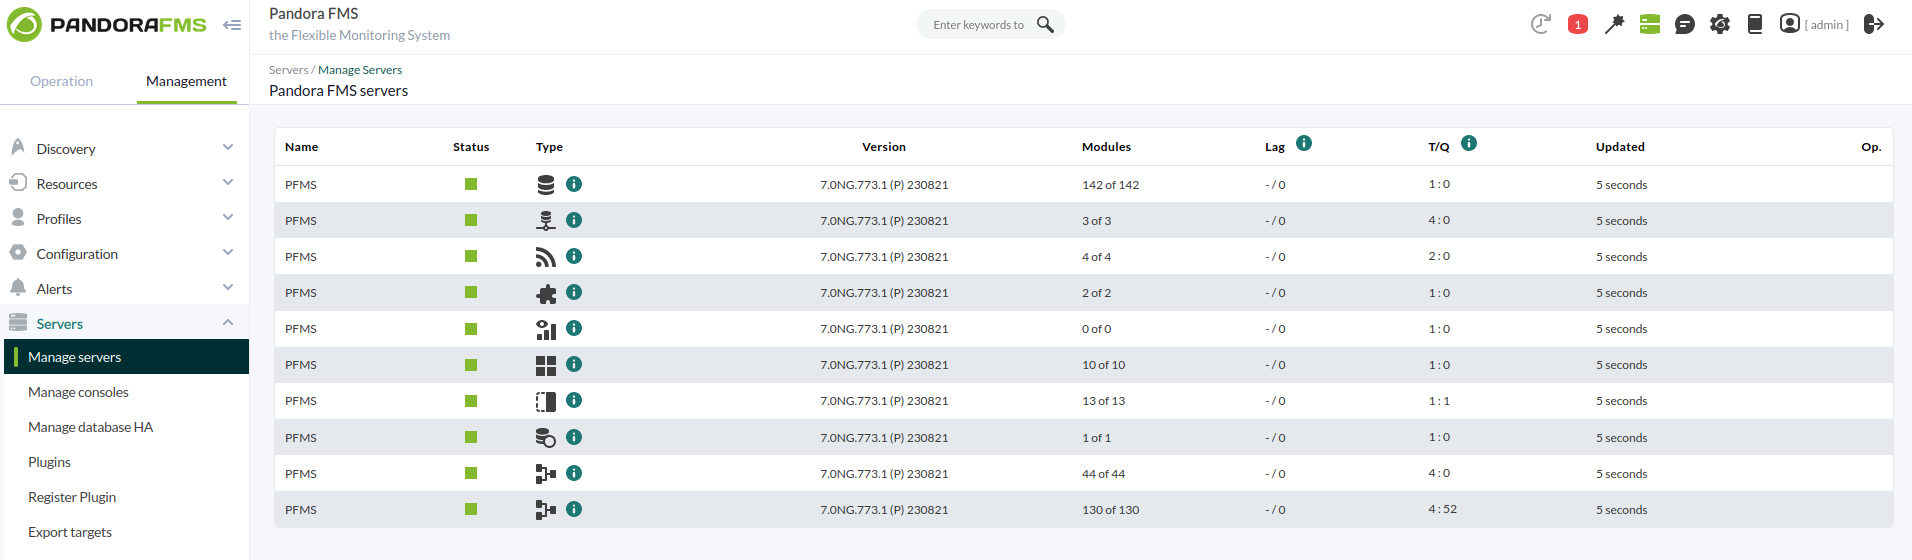
The basic servers are the following ones:
Open
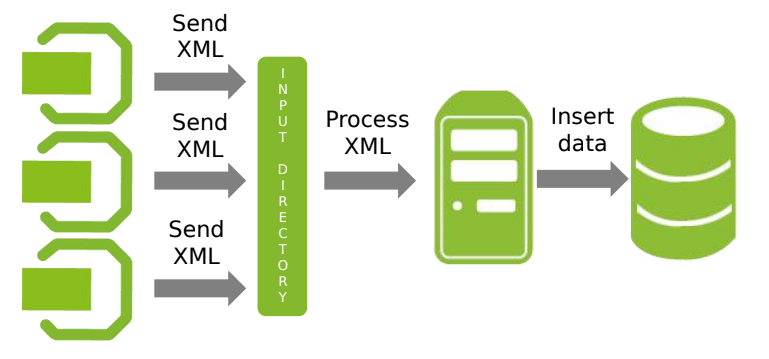
Data server: It is in charge of processing the information sent by the software agents (in XML format), the server processes it and stores the result in the database. It is also in charge of generating alerts and events according to this data. To enable the server it is necessary to configure the dataserver 1 line in the /etc/pandora/pandora_server.conf file.
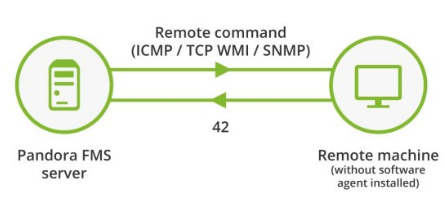
Network server: This server executes remote monitoring tasks through the network, it could be ICMP checks, TCP requests and SNMP requests. The server and the remote machines must have communication to execute these checks. To enable the server it is necessary to configure the networkserver 1 line in the /etc/pandora/pandora_server.conf file.
Discovery server: It allows to explore networks to detect equipments and apply monitoring templates to them quickly. It also allows the rapid deployment of specific monitoring of databases, cloud systems and virtual environments. It includes the necessary tools to discover or import devices and equipment in the network. To enable the server it is necessary to configure the discoveryserver 1 line in the /etc/pandora/pandora_server.conf file.
Plugin server: It allows complex remote monitoring, since it executes complex checks from Pandora FMS server by means of customized scripts. It is a centralized process, integrated into Pandora FMS interface. This server allows advanced users to define their own checks, developed by themselves, and integrate them into the application so that they can be used easily from Pandora FMS. To enable the server it is necessary to configure the pluginserver 1 line in the file /etc/pandora/pandora_server.conf.
Prediction server: This server predicts numerical values using statistics and modules with real data as source, allows to detect anomalies out of the usual trends and creates new values from prediction statistics, which can be used as baselines. It also allows to create new values by arithmetic operations with the values of existing modules (synthetic modules). To enable the server it is necessary to configure the predictionserver 1 line in the /etc/pandora/pandora_server.conf file.
WMI server: This server allows remote monitoring of Windows systems using the WMI protocol. This is done through the execution of WMI sentences, remote sentences compatible with any Windows system with WMI enabled that allow to obtain Hardware and Software information. To enable the server it is necessary to configure the wmiserver 1 line in the file /etc/pandora/pandora_server.conf.
Inventory server: The inventory server obtains and displays inventory information of the systems: installed software, model of hardware elements, hard disks, services running on the system, etc. This information can be obtained both remotely (from the Pandora server) and locally (through the software agents). It does it by using the same monitoring agents or remotely, with extensions developed by the user, both for Windows and Unix. To enable the server it is necessary to configure the inventoryserver 1 line in the /etc/pandora/pandora_server.conf file.
Web server: It is used to perform complete web checks, from the user identification process, to parameter transfer through a form, content checking, menu navigation, etc. It allows performing availability checks (working or not working) and obtaining latency times (in seconds) of the complete browsing experience, including resources associated to the page (images, full texts, etc). It is based on Goliath (Web audit server), which is OpenSource. To enable the server it is necessary to configure the webserver 1 line in the /etc/pandora/pandora_server.conf file.
SNMP Traps Console: This server uses the standard trap collection system daemon, snmptrapd. This daemon receives SNMP traps and Pandora FMS SNMP console processes and stores them in the database. It is also in charge of launching the alerts associated to SNMP traps were defined. To enable the server configure the snmpconsole 1 line in the /etc/pandora/pandora_server.conf file.
Enterprise
Enterprise ICMP server: This server multiplies the efficiency of ICMP checks. It uses the nmap binary installed with Pandora FMS Enterprise version. It uses nmap version 5.5. or higher. To enable the server it is necessary to configure the inventoryserver 1 line in the /etc/pandora/pandora_server.conf file.
Enterprise SNMP server: This server increases the efficiency of SNMP checks. It uses the braa binary that is installed with the Enterprise version of Pandora FMS. The braa binary, used by the enterprise SNMP server is located at /usr/bin/braa by default. It is compatible with SNMP V1 and v2. SNMP v3 checks will be done by the network server. It requires for the network server to operate simultaneously, to translate the OIDs. To enable the server it is necessary to configure the snmpserver 1 line in the /etc/pandora/pandora_server.conf file.
Syslog server: This component allows Pandora FMS to analyze the syslog of the machine where it is located, analyzing its content and storing the references in the corresponding ElasticSearch server. The main advantage of the syslog server is to complement log merging. With the support of the exporting features of the syslog server of Linux® and Unix® environments, it allows log consultation regardless of the source, searching in a single common point (Pandora FMS console log viewer). To enable the server it is necessary to configure the syslogserver 1 line in the /etc/pandora/pandora_server.conf file.
You may establish for each server the number of threads that the processes will use in the instance where Pandora FMS is installed.
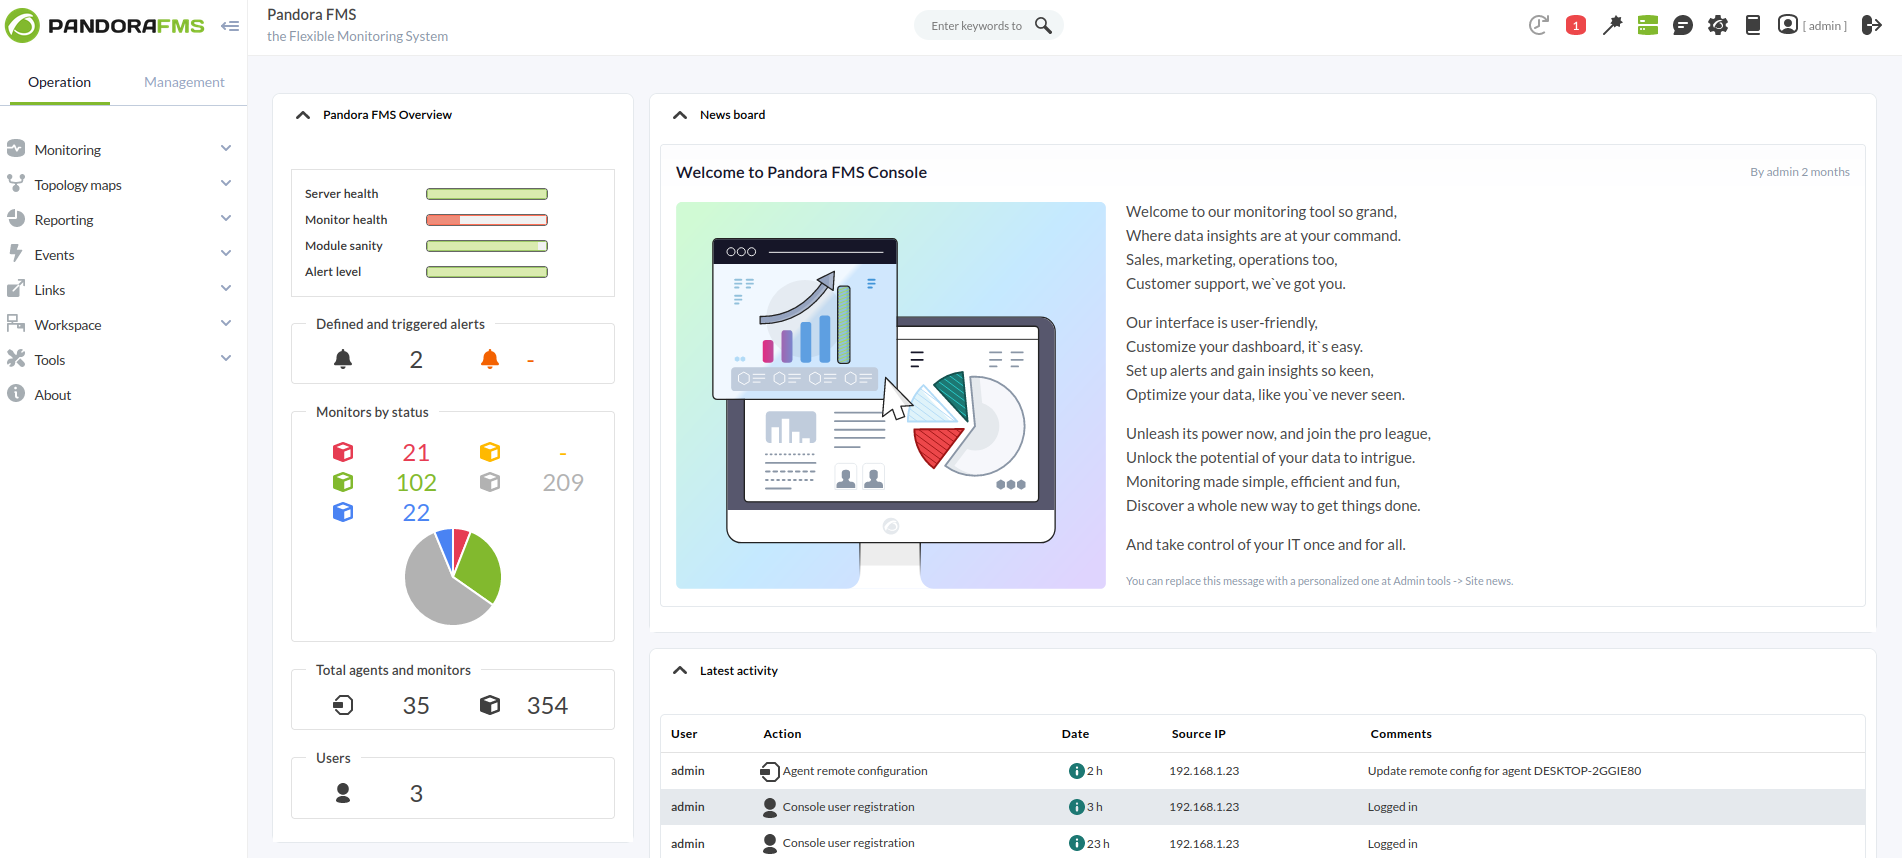
Pandora FMS web console
It is the user interface of Pandora FMS, it allows to control the status of the Agents, see statistical information, generate graphs and data tables. It is also able to generate reports and centrally define new agents, modules, alerts and create other users and profiles.
Pandora FMS database
Pandora FMS uses a MySQL database in which all the information received in real time is stored, normalizing all the data from the different sources (server, agents...).
Currently Pandora FMS only supports MySQL, MariaDB and Percona.
Agents
En Pandora FMS existen dos tipos de agentes y pueden ejecutar módulos de tipo remoto y de tipo local:
- Agente Remoto: Este tipo de agente es un elemento organizativo creado en la Consola web de Pandora FMS, habitualmente contiene módulos de tipo remotos que son ejecutados por aquellos servidores que obtienen información de forma remota, como puede ser el network server.
- Agente Software: Es un software instalado en los equipos que se van a monitorizar de manera local, extrayendo información desde el propio equipo, permite monitorizar los recursos de la máquina (CPU, RAM, discos...) y las aplicaciones instaladas (MySQL, Apache, JBoss). Toda la información recogida por los agentes software es enviada al servidor en formato XML a través del protocolo Tentacle (se permite el uso de SSH o FTP) en un intervalo predeterminado de 5 minutos (300 segundos).
Generalmente, la monitorización de servidores y equipos se llevará a cabo con Agentes Software mientras que la monitorización de equipos de red se hará de forma remota sin la instalación de ningún software.
Topologías, esquemas y modelos de monitorización
Lo ideal es que todos los equipos monitorizados tengan comunicación con el servidor de PandoraFMS, pero en ocasiones nos encontraremos con casos en los que no tengamos total comunicación entre los distintos elementos que queramos monitorizar, vamos a mencionar distintas situaciones a las que podemos enfrentarnos y como subsanarlas.
Redes accesibles
- Red accesible para la monitorización remota centralizada: El servidor de Pandora FMS tiene comunicación con todas las máquinas de la red.
- Red accesible para la monitorización basada en Agentes: Son los agentes software los que tienen comunicación con el servidor de Pandora FMS.
Redes con dificultad de acceso
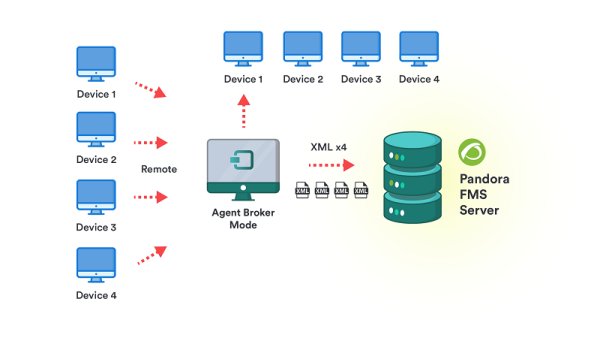
- Red remota no alcanzable por los chequeos remotos de Pandora FMS: Utiliza la modalidad broker agent.
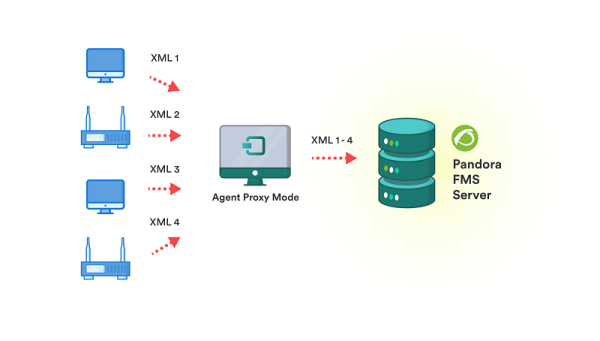
- Agentes Software que no tienen acceso al servidor de Pandora FMS: En este caso utiliza la característica de proxy de los Agentes Software o un Satellite server como proxy de agentes software.
- Redes diferentes para monitorizar remotamente con el servidor: Se puede utilizar Satellite Server o varios servidores diferentes de Pandora FMS conectados a la misma base de datos.

¿No se están logrando los resultados explicados en el capítulo? Acceda a la sección de ayuda o soporte