
11. Module Advanced Settings
In this sectionsection, we will see how to configure some moduleof a module's advanced options, as well as to define the measurement thresholds that makecause modulesa gomodule intoto transition to a WARNING or CRITICAL state. InWhen editing a module'smodule, editing,you itcan isalso possible to define, additionally,define many other configurationssettings that allow you to customizefine-tune everyeach metric monitored by Pandora FMS.FMS to your needs.
From the normal agent view:
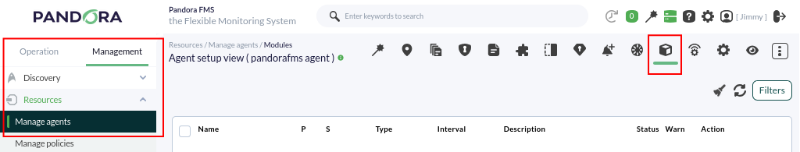
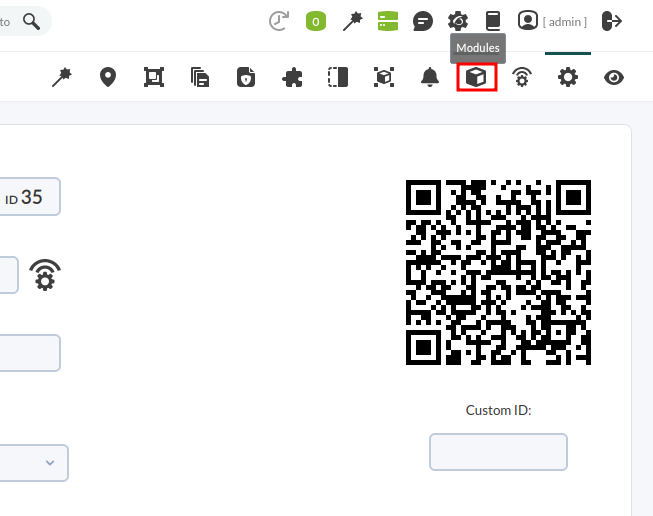
ClickWe on the cogwheel icon to go to the agent's "configuration" mode, and from there, click on the cube icon:
Choosechoose the module youwe wishwant to configure by clicking on its name:
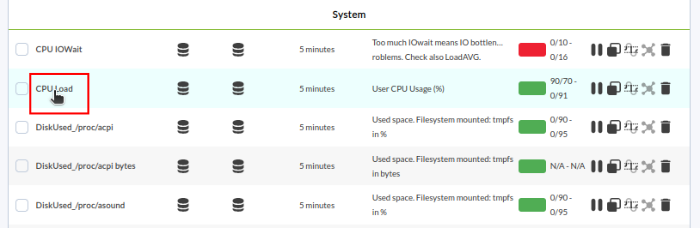
In this view, youwe will find the fields needednecessary to adjust the warning and critical thresholds. In this example, we editare editing the "CPU Load"Load module, a module that returns a numericnumerical value (as you may seeseen in the module type information, it is a "genericGeneric numeric"numeric or generic_data).
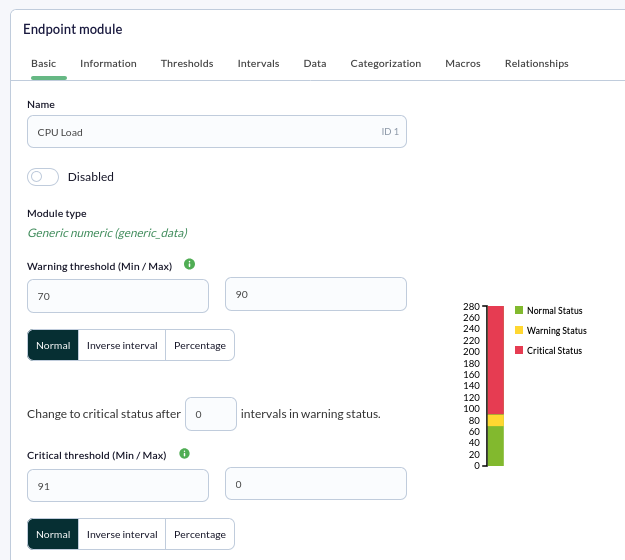
Other interesting fields couldof beinterest include the Disabled checkbox to disabledeactivate the module,module, or the module group definition combolist it is attachedassigned to, thatwhich is usedserves to "organize" the modules ofclassify an agentagent's modules so they areappear grouped. FinallyFinally, the "HistoryHistorical data" checkbox allows todefining define thatwhether this module keepssaves all the information it receives (to showdisplay historyhistorical graphs) or only the last valuecollected collected.value.
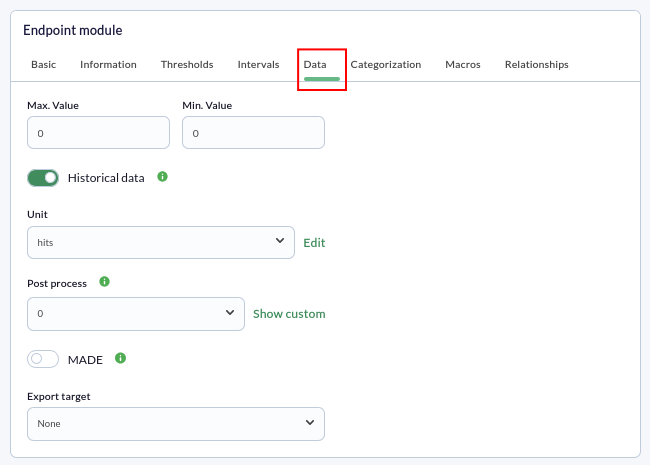
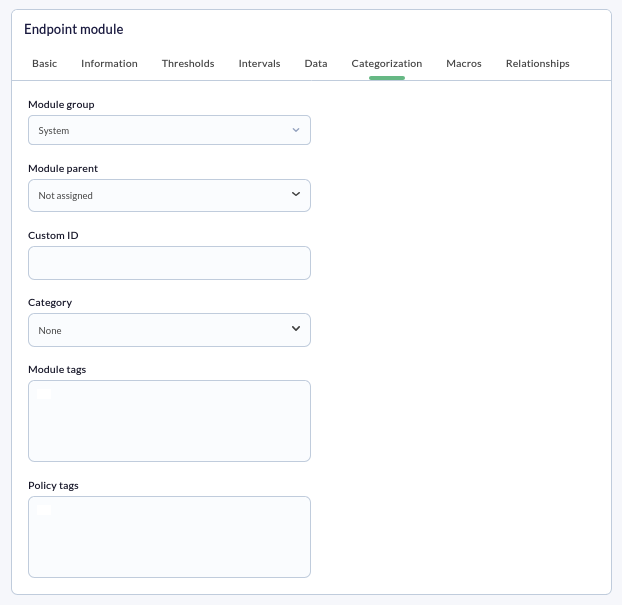
YouWe will also see some other interesting fields at the bottom ofin the Advanced OptionsCategorization drop-down tab:
Thresholds
In this section, we will configure the "Warning"warning and "Critical"critical thresholds for a module, thatwhich define whichwhat values a module must have to be in CRITICAL,a CRITICAL, WARNING, or NORMAL status.state. Let's see an example:
In our exampleexample, therewe ishave a "CPU %" module to which we want to add thresholds to.thresholds. This module, by default,default, will always be in a NORMAL state (green) state as long as it is between 0% and 100%.

If youwe want thatthis module to goshow intoa "Critical"critical or "Warning"warning statusstate when the CPU reaches a certain %,percentage, youwe shouldmust configure it settingby determining the desired "Warning Status"threshold and "Critical Status" thresholds.threshold. In this example, we will configure them so that when the CPU reaches a 60% usage, the module willenters goa intowarning "Warning" statusstate, and if it exceeds 80%, it willenters goa intocritical "Critical".state.
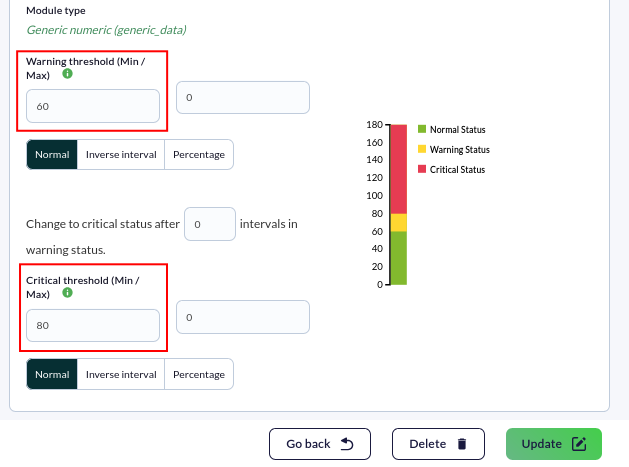
After configuring the thresholds, we just need to click "Update"the Update button, and theour thresholds will be properlycorrectly configured. The next received data received will already interpret those thresholds.
Units
This field within the advanced options allows todefining definethe units of the data units obtained in a module. This unit will be included in graphs and reports, somaking it is easier to interpret the data displayedshown to the user.
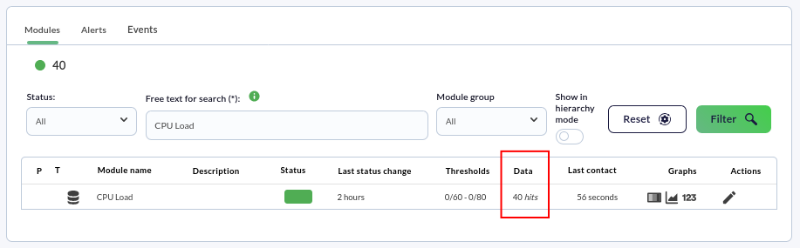
In thisour example, we want itthe unit to havebe "entries"hits. asWe unit.place Goourselves inside the "Unit"Unit field and choose the desired option from the drop-down menu.menu:
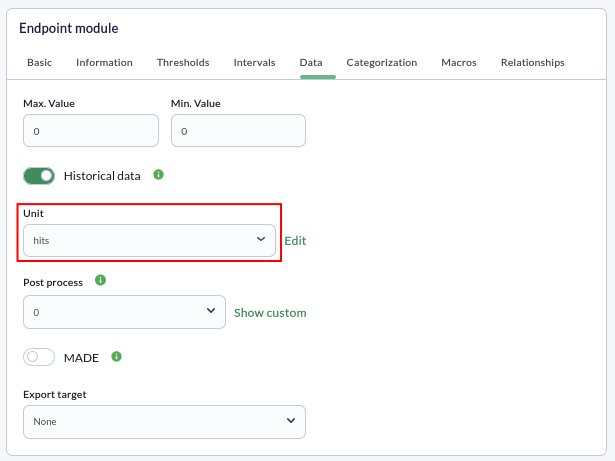
Finally, we click the "Update" button and checkverify that theour unit is correctly displayed in the modulemodules view.
If the unit does not appear among thethose availableavailable, ones,we can define one by clicking on the pencil icon.
DidAre you not getachieving the expectedresults results?explained Goin tothis chapter? Access the help or support sections.section.