
Discovery
This plugin can be integrated with Pandora FMS Discovery.
To do this, you must load the ".disco" package that you can download from the Pandora FMS library:
https://pandorafms.com/library/
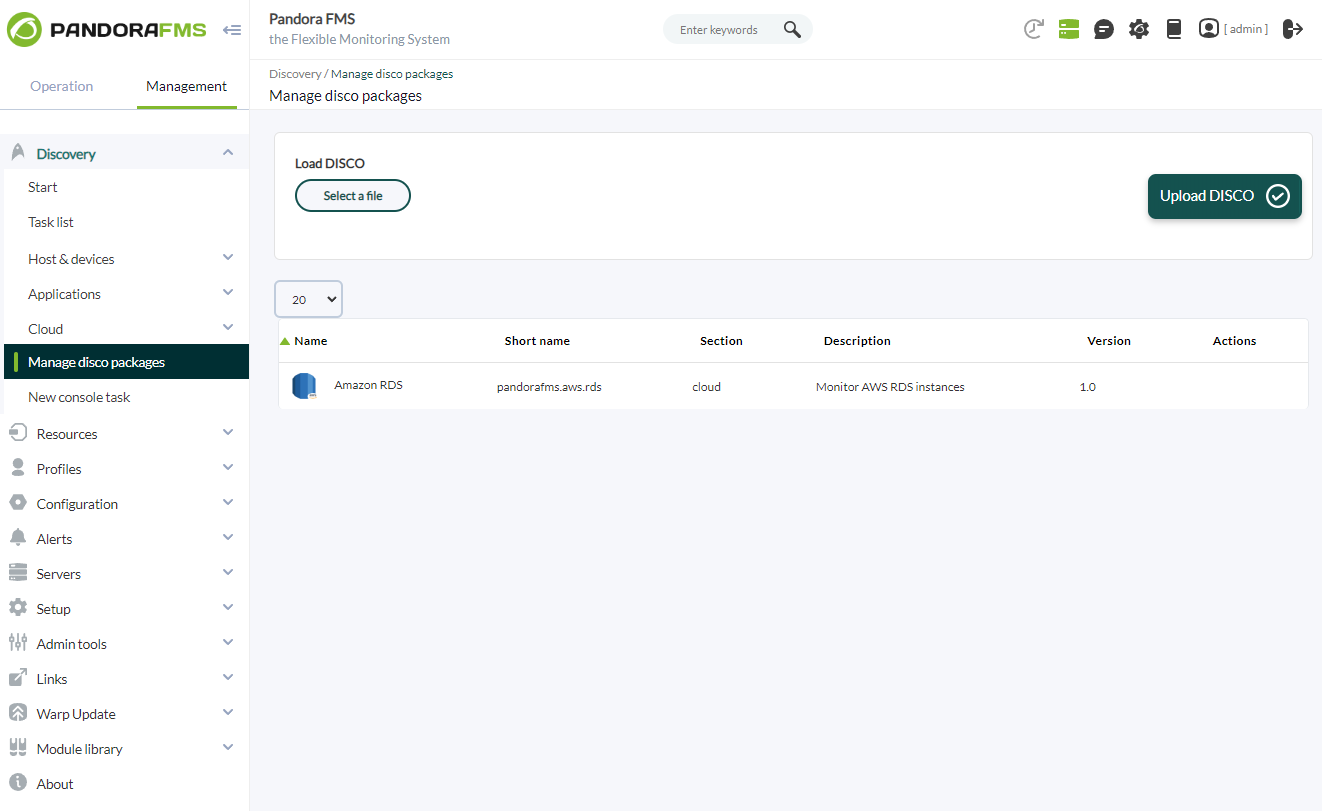
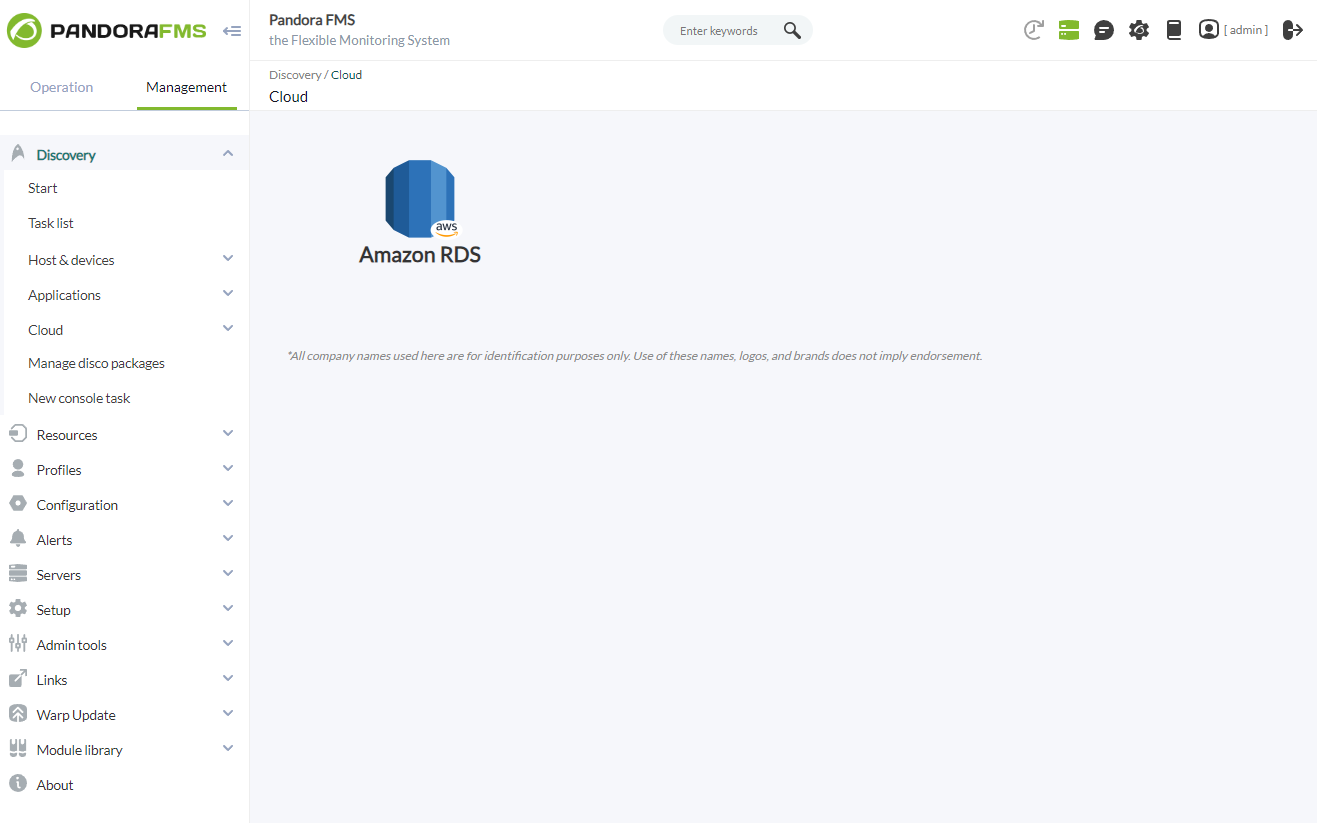
Once loaded, Amazon RDS environments can be monitored by creating Discovery tasks from the Management > Discovery > Cloud section.
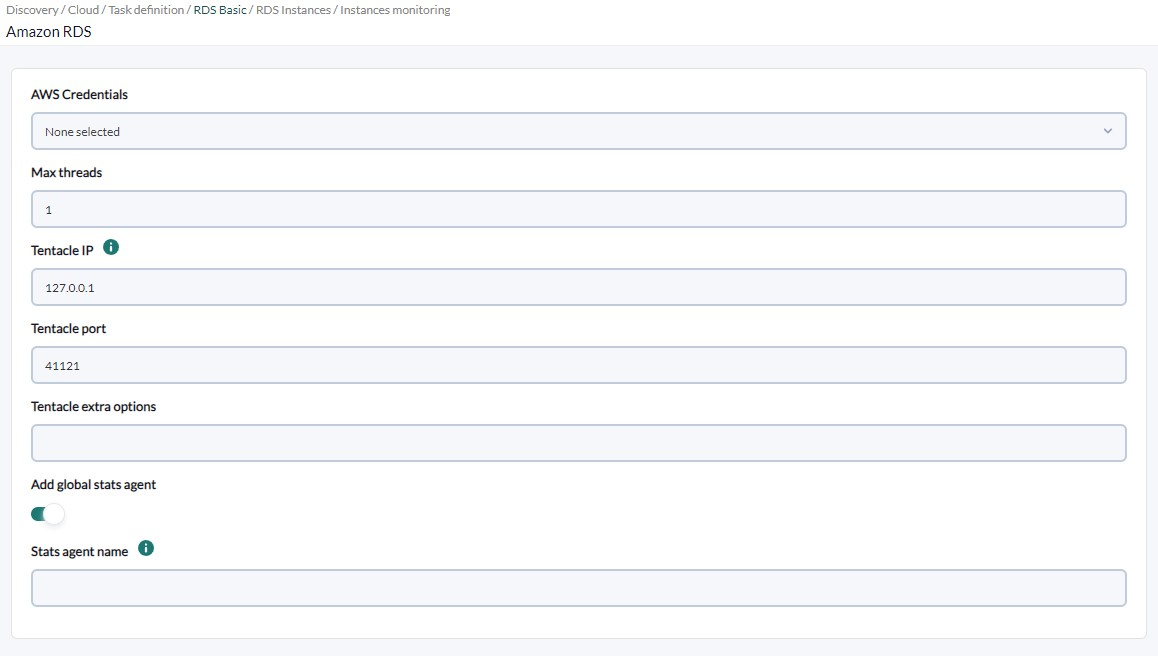
For each task, the following minimum data will be requested:
- AWS Credentials: Connection credentials to the AWS API to be used by the task. They must be previously registered in the Pandora FMS credential store.
- Max threads: To optimize the execution time, multiple threads can be configured to monitor the agents of the task. Keep in mind that setting up multiple threads can increase the CPU usage of the task.
- Tentacle IP – Tentacle server IP to send agent data to. Normally this parameter will not be modified.
- Tentacle port: Tentacle server port to send data to. Normally this parameter will not be modified.
- Tentacle extra options: Additional options for sending data through the Tentacle client. Normally this parameter will not be modified.
- Add global stats agent: If activated, a global agent will be generated with task statistics.
- Stats agent name: It will allow you to indicate the name of the agent for global statistics of the task. If no name is provided, the default name of the plugin will be used.
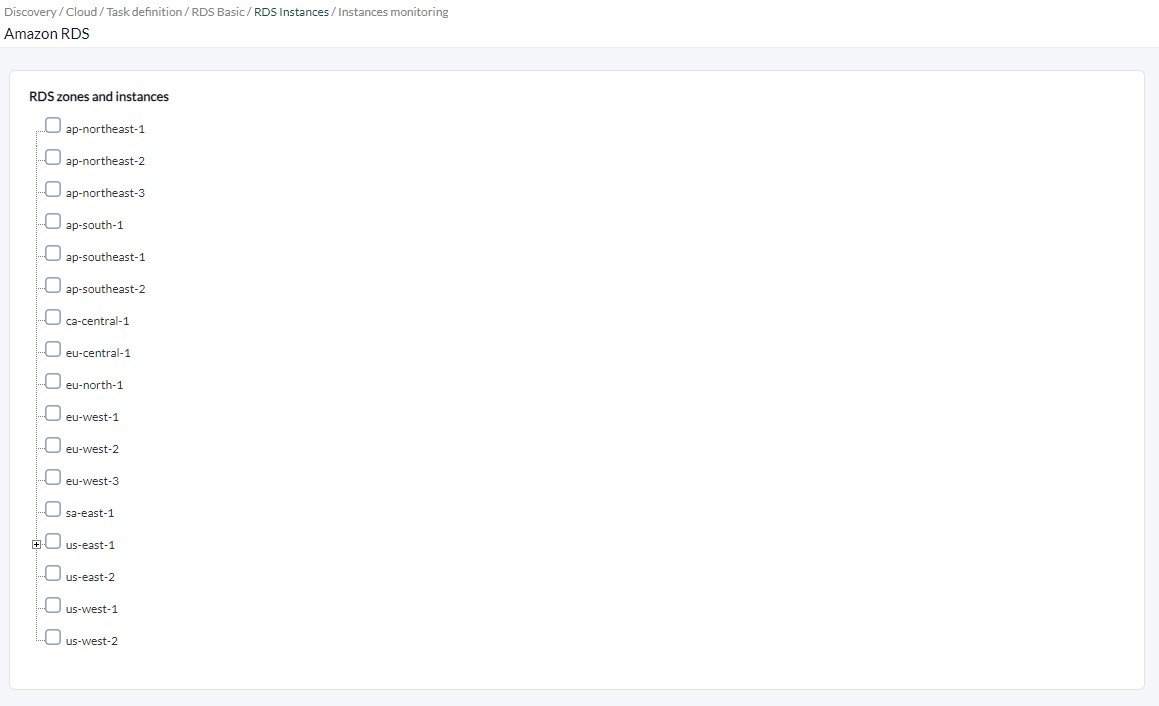
If the credentials provided are correct and the Pandora FMS server is able to connect to the AWS API, you will be able to see a tree with AWS RDS zones and instances, which can be marked for monitoring.
If a zone is selected, in addition to the zone itself, all the instances it contains will be monitored (both at the time of configuring the task and later if new instances are included).
If specific instances are selected, they will be monitored regardless of whether their zones have not been selected.
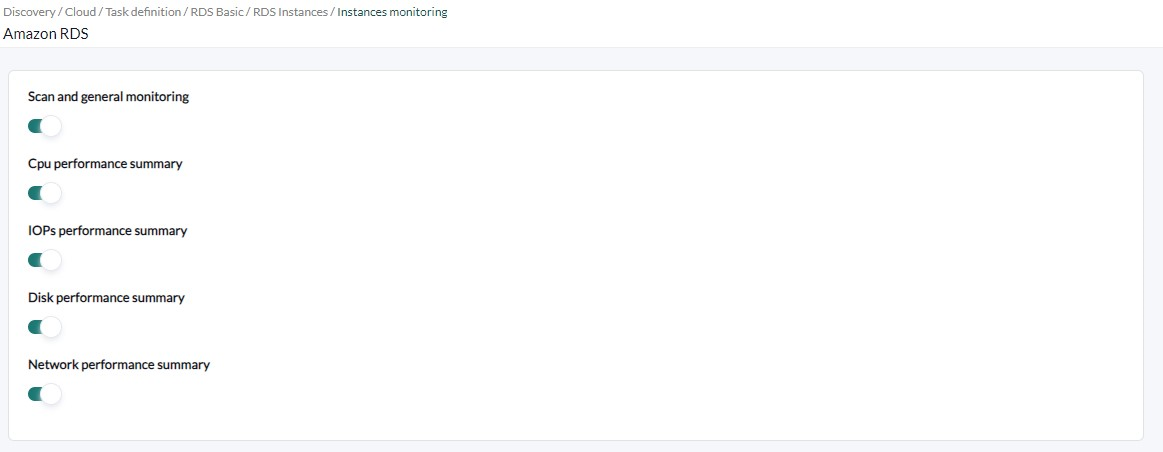
Next you can adjust the monitoring you want to obtain for each agent:
- Scan and general monitoring: If activated, the task will be enabled to obtain additional monitoring for the agents, described in the following fields.
- CPU performance summary: If activated, the CPU performance modules will be included in the monitoring.
- IOPs performance summary: If activated, the IOPs performance modules will be included in the monitoring.
- Disk performance summary: If enabled, the disk performance modules will be included in the monitoring.
- Network performance summary: If activated, the network performance modules will be included in the monitoring.
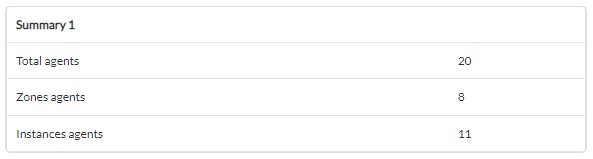
Tasks that are successfully completed will have an execution summary with the following information:
- Total agents: Total number of agents generated by the task.
- Zones agents: Total number of regions monitored by the task.
- Instances agents: Total number of instances monitored by the task.
The tasks that are not completed successfully will have an execution summary recording the errors produced.