Table of Contents
Pandora FMS Engineering
Pandora FMS Engineering Details
This section explains some of the design principles and particularities of Pandora FMS.
Pandora FMS Database Design
Pandora FMS first versions, from version 0.83 to version 1.1, were based on a very simple idea: one piece of data, one insertion in the database. This allowed the program to perform simple searches, insertions and other operations.

Although this development had some advantages, there was a big disadvantage: scalability (fast growth without affecting or slightly affecting operations and work routines). This system has an specific limit regarding the maximum amount of modules supported, and when having a significant amount of data (> 5 millions of elements), the performance level decreased.
On the other hand, solutions based on MySQL cluster are not easy: even though they allow managing a higher load, they entail some minor problems. They do not offer a long term solution either to this performance problem with higher data load.
The current version of Pandora FMS implements a data compression in real time for each insertion. It also allows data compression based on interpolation. The maintenance task also allows automatic deletion for those data that exceed a certain period of time.

The new Pandora FMS processing system keeps only «new» data. If a duplicated value enters the system, it will not be stored in the database. It is very useful to keep the database to a minimum and it works for all Pandora FMS modules: numeric, incremental, boolean,and string. In the boolean data type, the compressing index is very high, since they are data that rarely change. Nevertheless, the «index» elements are stored every 24 hours, so there is minimum information that is used as a reference when compacting the information.
This system solves part of the scalability problem, reducing database usage by 40%-70%, but there are other ways to increase scalability.
Pandora FMS allows component breakup to balance the data file processing load and network module execution in different servers. It it possible to have several Pandora FMS servers (network servers, data or SNMP), Pandora FMS Web consoles, and also a database or a high performance cluster (with MySQL5) in different servers.

The adjustments imply big changes when reading or interpreting data. In latest Pandora FMS versions, the graphic engine has been redesigned from scratch to be able to represent data quickly with the new data storage model.
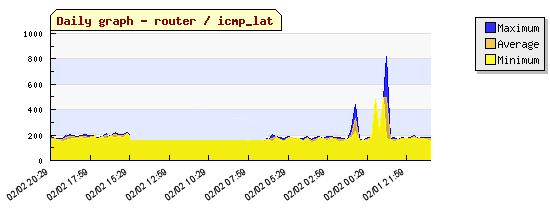
Compressing processes have certain implications when reading and interpreting data graphically. Imagine an agent cannot communicate with Pandora FMS, so the Pandora FMS server does not receive data from that agent, and there is a period of time during which the server has no information from said agent's modules. If you access the graphic of one of those modules, the interval with no data will be represented as not suffering any changes, as a horizontal line. If Pandora FMS does not receive new values, it will assume there were no changes and everything will look as it did in the last notification.
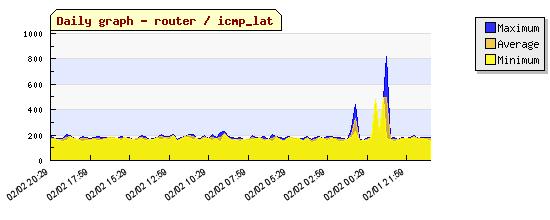
To see a graphic example, this image shows the changes for each data, received every 180 seconds.
This would be the equivalent graphic for the same data, expect for a connection failure, from 05:55 to 15:29 approximately.
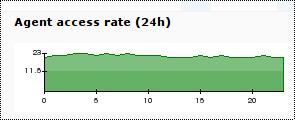
In Pandora FMS 1.3 a new general graphic for the agents was added. It shows its connectivity, and the access rate from the module to the agent. This graphic complements the other graphs that are shown when the agent has activity and receives data. This is an example of an agent that had activity and received data:
If it has peaks (low) in this graphic, there could be some problems or slow connections in the Pandora FMS agent connectivity with the Pandora FMS server, or either connectivity problems from the network server.

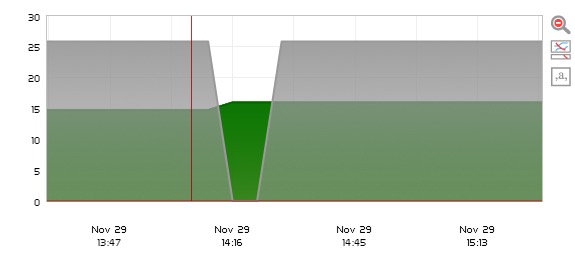
In Pandora FMS version 5, it was introduced the possibility of crossing the data of the “unknown module” type events with the graphs, to show in the graph the piece of data in unknown status, complementing the graph for better understanding, for example:
In version 7 NG 759 it had a graph configuration menu that allowed adding percentiles, data in real time, when events and/or alerts took place, in addition to other options.
Other DB technical aspects
Throughout software updates, small improvements have been made to the relational model of Pandora FMS database. One of the changes is information indexation by module types. That way, Pandora FMS can access information more quickly since it is broken down into different tables.

Tables can be partitioned (by timestamps) to improve even more data historie access performance.
In addition, factors such as numerical representation of timestamps (in _timestamp_ UNIX format), speeds up date range searches, their comparison, etc. This work has allowed a significant improvement in search times and insertions.
Database Main Tables
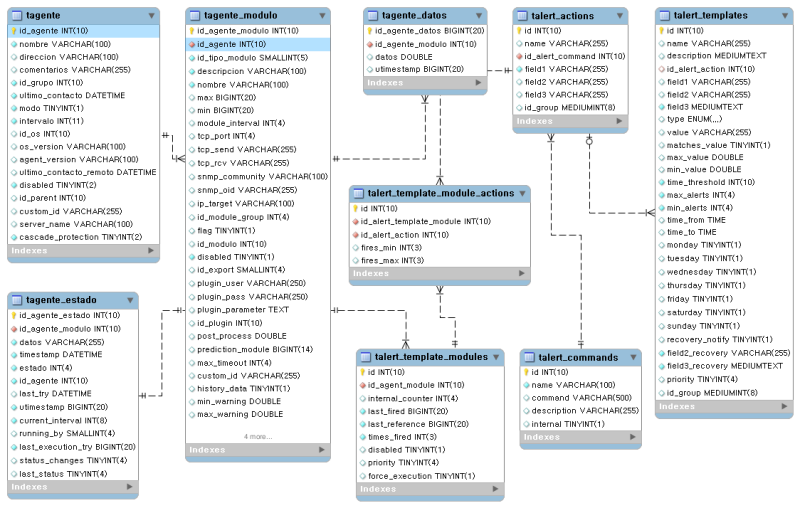
You may get more information about Pandora FMS database structure (as of April 18, 2020) by following this link .
This is an ER diagram and also a detailed description of the main tables of Pandora FMS database.
- taddress: It contains agent additional addresses.
- taddress_agent: Addresses linked to an agent (rel. taddress/tagent).
- tagent: It contains the information of Pandora FMS agents.
- id_agent: Agent unique identifier.
- name: Agent name (case sensitive).
- address: Agent address. It is possible to assign additional addresses through taddress.
- comments: Free text.
- id_group: Identifier of the group the agent belongs to (ref. tgroup).
- last_contact: Last agent contact date, either through a software agent or through a remote module.
- mode: Running agent mode, 0 normal, 1 training.
- interval: Agent execution interval. Depending on this interval, the agent will be showed as out of limits.
- id_os: Agent SO identifier (ref. tconfig_os).
- os_version: SO version (free text).
- agent_version: Agent version (free text). Updated by software agents.
- last_remote_contact: Last agent-received contact date. In case of software agents, and unlike last_contact, the date is sent by the agent itself.
- disabled: Agent status, enabled (0) or disabled (1).
- remote: Agents with (1) or without remote configuration.
- id_parent: Identifier of the agent parent (ref. tagent).
- custom_id: Agent custom identifier. Useful to interact with other tools.
- server_name: Name of the server the agent is assigned to.
- cascade_protection: Cascade protection. Disabled at 0. When at 1, it prevents agent-associated alerts from being triggered if a critical agent parent alert was triggered. For more info, check the section about Alerts.
- safe_mode_module: Module ID (of the same Agent) that safe operation mode (all other Agent Modules are disabled if this Module is in critical status).
- tagent_data: Data received from each module. If for the same module the last received data is the same as the previous one, it will be not added (but tagent_status is updated). The incremental and string type data are saved in different tables.
- tagent_data_inc: Incremental data type.
- tagent_data_string: String data type.
- tagent_status: Information of the current status of each module.
- id_agent_status: Identifier.
- id_agent_module: Module identifier.(ref. tagent_module).
- data: Value of the last received data.
- timestamp: Data of the last data received (it could come from the agent).
- status: Module status: 0 NORMAL, 1 CRITICAL, 2 WARNING, 3 UNKNOWN.
- id_agent: Agent identifier associated to the module (ref. tagent).
- last_try: Date of the module's last successful execution.
- utimestamp: Date of the module's last execution in UNIX format.
- current_interval: Module execution interval in seconds.
- running_by: Name of the server that executed the module.
- last_execution_try: Date of the last module execution try. The execution could have failed.
- status_changes: Number of status changes. It is used to avoid continuous status changes. For more info, check out the Operation section.
- last_status: Previous module status.
- tagent_module: Module configuration.
- id_agent_module: Module unique identifier.
- id_agent: Agent identifier associated to the module (ref. tagent).
- id_type_module: Type of module (ref. ttipo_modulo).
- description: Free text.
- name: Module name.
- max: Module maximum value. Data higher than this value will not be valid.
- min: Module minimum value. Data lower than this value will not be valid.
- module_interval: Module execution interval in seconds.
- tcp_port: Destination TCP port in network modules and plugins. Name of the column to read in WMI modules.
- tcp_send: Data to send in network modules. Namespace in WMI modules.
- tcp_rcv: Expected answer in network modules.
- snmp_community: SNMP community in network modules. Filter in WMI modules.
- snmp_oid: OID in network modules. WQL Query in WMI modules.
- ip_target: Destination address in network modules, plugin and WMI.
- id_module_group: Identifier of the group the module belongs to (ref. tmodule_group).
- flag: Forced execution flag. If is at 1, the module will be executed although it has no right by interval.
- id_module: Identifier for modules that could not been recognized by its id_module_type. 6 for WMI modules, 7 for WEB modules.
- disabled: Module status, 0 enabled, 1 disabled.
- id_export: Identifier of the export server associated to the module (ref. tserver).
- plugin_user: Username in plugin and WMI modules, user-agent in Web modules.
- plugin_pass: Password in plugin modules and WMI, number of retries in Web modules.
- plugin_parameter: Additional parameters in plugin modules, configuration of Goliat task in Web modules.
- id_plugin: Identifier of the plugin associated to the module in plugin modules (ref. tplugin).
- post_process: Value the module data will be multiplied by before being saved.
- prediction_module: 1 if it is a prediction module, 2 if it is a service module, 3 if it is synthetic and 0 in any other case.
- max_timeout: Waiting time in seconds for plugin modules.
- custom_id: Module customized identifier. Useful to interact with other tools.
- history_data: If it is set at 0, module data will not be saved at tagent_data*, only tagent_status will be updated.
- min_warning: Minimum value that activates the WARNING status.
- max_warning: Maximum value that activates the WARNING status.
- min_critical: Minimum value that activates the CRITICAL status.
- max_critical: Maximum value that activates the CRITICAL status.
- min_ff_event: Number of times that should a status change term must be met before this change take place. It is is related to tagent_status.status_changes.
- delete_pending: If it is set at 1, it will be deleted by the maintenance script of pandora_db.pl database.
- custom_integer_1: When prediction_module equals 1, this field is the module id from where data for predictions are obtained. When prediction_module equals 2, this field is the service id assigned to the module.
- custom_integer_2: Used by Prediction Server.
- custom_string_1: Used by Prediction Server.
- custom_string_2: Used by Prediction Server.
- custom_string_3: Used by Prediction Server.
- tagent_access: A new entry will be added each time data are received from an agent to any server, but never more than one by minute to avoid overloading the database. It can be disabled by setting agentaccess to 0 in the pandora_server.conf configuration file.
- talert_snmp: SNMP alert configuration.
- talert_commands: Commands that can be executed from actions associated to an alert (e.g. send mail).
- talert_actions: Command instance associated to any alert (e.g. send mail to administrator).
- talert_templates: Alert templates.
- id: Template unique identifier.
- name: Template name.
- description: Description.
- id_alert_action: Identifier of the default action linked to the template.
- field1: Customized field 1(free text).
- field2: Customized field 2(free text).
- field3: Customized field 3 (free text).
- type: Type of alert according to the triggering term ('regex', 'max_min', 'max', 'min', 'equal', 'not_equal', 'warning', 'critical').
- value: Value for regex type alerts (free text).
- matches_value: When set to 1, it inverts the logic of the triggering term.
- max_value: Maximum value for max_min and max alerts.
- min_value: Minimum value for max_min and min alerts.
- time_threshold: Alert interval.
- max_alerts: Maximum number of times an alert will be triggered during an interval.
- min_alerts: Minimum number of times that the triggering term must be met during an interval for the alert to be triggered.
- time_from: Time from which the alert will be active.
- time_to: Time until which the alert will be active.
- monday: When set to 1, the alert is active on Mondays.
- tuesday: When set to 1, the alert will be active on Tuesdays.
- wednesday: When set to 1, the alert will be active on Wednesdays.
- thursday: When set to 1, the alert will be active on Thursdays.
- friday: When set to 1, the alert will be active on Fridays.
- saturday: When set to 1, the alert will be active on Saturdays.
- sunday: When set to 1, the alert will be active on Sundays.
- recovery_notify: When set to 1, it enables alert recovery.
- field2_recovery: Custom field 2 for alert recovery (free text).
- field3_recovery: Custom field 3 for alert recovery (free text).
- priority: Alert priority: 0 Maintenance, 1 Informational, 2 Normal, 3 Warning, 4 Critical.
- id_group: Identifier of the group the template belongs to (ref. tgrupo).
- talert_template_modules: Instance of an alert template associated to a module.
- id: Alert unique identifier.
- id_agent_module: Identifier of the module linked to the alert (ref. tagente_modulo).
- id_alert_template: Identifier of the template associated to the alert (ref. talert_templates).
- internal_counter: Number of times that the alert triggering term was met.
- last_fired: Last time the alert was triggered (Unix time)
- last_reference: Start of the current interval (Unix time).
- times_fired: Number of times the alert was triggered (it could be different from internal_counter)
- disabled: When set to 1, the alert is disabled.
- priority: Alert priority : 0 Maintenance, 1 Informational, 2 Normal, 3 Warning, 4 Critical.
- force_execution: When set to 1, the action of the alert will be executed even thought it has not been triggered. It is used for alert manual execution.
- talert_template_module_actions: Instance of an action associated to an alert (ref. talert_template_modules).
- talert_compound: Compound alerts, the columns are similar to those of talert_templates.
- talert_compound_elements: Simple alerts associated to a compound alert, each one with its correspondent logic operation (ref. talert_template_modules).
- talert_compound_actions: Actions associated to a compound alert (ref. talert_compound).
- tattachment: Attachments associated to an incidence.
- tconfig: Console configuration.
- tconfig_os: Valid Operative systems in Pandora FMS.
- tevent: Event entries. Priority values are the same as those of alerts.
- tgroup: Defined groups in Pandora FMS.
- tincidence: Incidence entries.
- tlanguage: Available languages in Pandora FMS.
- tlink: Links showed at the console menu lower side.
- tnetwork_component: Network components. They are modules associated to a network profile used by the Recon Server. After they result in an entry at tagent_module, so the columns of both tables are similar.
- tnetwork_component_group: Groups to classify network components.
- tnetwork_profile: Network profile. Network component group that will be assigned to recognition tasks of the Recon Server. The network components associated to the profile will result in modules in the created agents.
- tnetwork_profile_component: Network components associated to a Network profile (rel. tnetwork_component/tnetwork_profile).
- tnote: Notes associated to an incidence.
- tsource: Possible source of an incidence.
- tprofile: User profiles defined in the console.
- trecon_task: Recon tasks the Recon server performs.
- tserver: Registered servers.
- tsession: Information on actions that took place during an user session for administration and statistical logs.
- ttype_module: Module types depending on their source and kind of data.
- ttrap: SNMP traps received by the SNMP console.
- tuser: Console-registered users.
- tuser_profile: User-associated profiles (rel. tuser/tprofile).
- tnews: News showed on the console.
- tgraph: Custom graphs created in the console.
- tgraph_source: Modules associated to a graph (rel. tgraph/tagente_modulo).
- treport: Custom reports created in the console.
- treport_content: Elements associated to a certain report.
- treport_content_sla_combined: Components of an SLA element associated to a certain report.
- tlayout: Custom maps created in the console.
- tlayout_data: Elements associated to a map.
- tplugin: Plugin definitions for the Plugin Server.
- tmodule: Module types (Network, Plugin, WMI…).
- tserver_export: Configured destinations for Export server.
- tserver_export_data: Data to export, associated to a destination.
- tplanned_downtime: Planned downtimes.
- tplanned_downtime_agents: Agents associated to a planned downtime (rel. tplanned_downtime/tagent).
Real time data compression

To avoid overloading the database, the server performs a simple compression at the time of insertion. One piece of data will not be stored in the database, unless it is different from the previous one or there is a time difference of 24 hours between them.
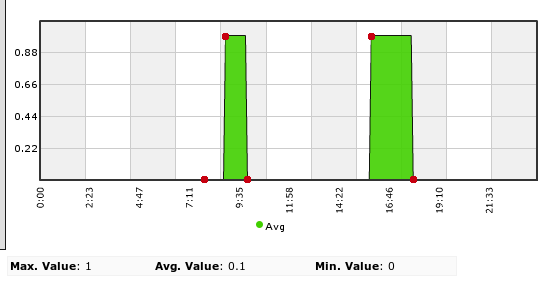
For example, for an interval of around 1 hour, then the sequence 0,1,0,0,0,0,0,0,1,1,0,0 is saved in the database as 0,1,0,1,0. A consecutive 0 will not be saved unless 24h have passed.
The graph shown here has been drawn from the data of the previous example. Only the data in red have been inserted in the database.
Compression affects data processing algorithms, both to metrics and graphs. And it is important to keep in mind that the blanks caused by the compression must be filled in.
Considering all of this, in order to calculate based on the data of a module, with a certain interval and the starting data, you should follow these steps:
- Search for the previous data, out of the interval and date given. If it exists, put it at the beginning of the range. If it does not exist, there is no data.
- Look for the following data out of the range and data given until a maximum equal to the module interval. If it exists, then put it at the end of the interval. If not, extend the last available value until the end of the interval.
- All data should be checked, considering that a piece of data is valid until you receive a different piece data.
Data compression
Pandora FMS now includes a system to compress database information. This system is focused on small / medium-sized deployments (250-500 agents, < 100,000 modules) which must have a wide information history but loosing some details.

Pandora FMS database maintenance, which is executed each hour, compacts old data among other cleaning tasks. Compression is done using a simple linear interpolation, which means that if there are 10,000 data in a single day, the process will reduce those 10,000 points to 1000 points.
Since it is an interpolation, some details are missing in that information, but it is enough for monthly, yearly, etc., reports and graphs.
In big databases, this could be “expensive” in terms of database performance, and it should be disabled. You may use the history database model instead.
History database
![]() This is an Enterprise feature, and it is used to store old information that is not used in daily views, for example, one-month-old data. These data are automatically migrated to a different database that must be in a different server with a hard drive different to that of the main database.
This is an Enterprise feature, and it is used to store old information that is not used in daily views, for example, one-month-old data. These data are automatically migrated to a different database that must be in a different server with a hard drive different to that of the main database.
When a graph or report containing old data is shown, Pandora FMS will look for the first days in the main database, and when reaching the point when data are migrated to the history database, it will search there. Thanks to that, performance is optimized even when storing a high amount of information within the system.
To configure this, install the history database manually in another server (importing the Pandora FMS schema, without data), and permissions to allow access to it from the main Pandora FMS server.
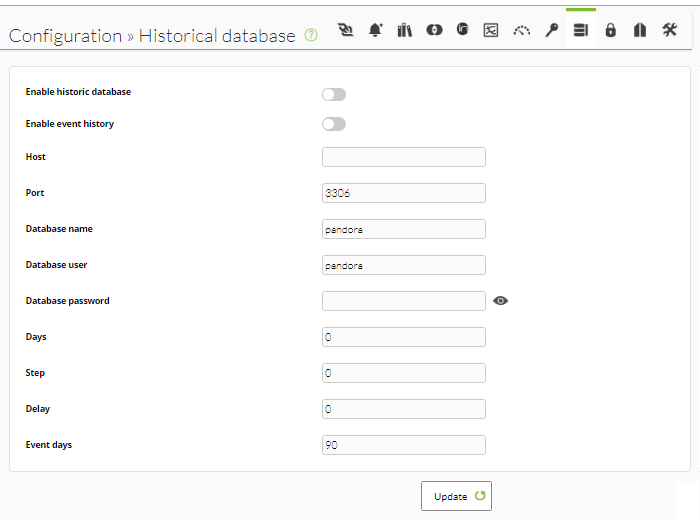
Go to Setup → Setup → Historical database and configure there the settings to access the history database.
Advanced setup
The default Pandora FMS configuration does NOT transfer string data to the historical database, however, if this configuration has been modified and the historical database is receiving this type of information, it is essential to configure its purging, since otherwise it will end up taking too much time, causing big problems, besides having a negative impact on performance.
To configure this parameter, must run a query directly in the database to set the days after which this information will be purged. The key table here is t_config and the field is string_purge. If you wanted to set 30 days for the purging of this type of information, this query should be run directly on the historical database:
UPDATE tconfig SET value = 30 WHERE token = "string_purge";
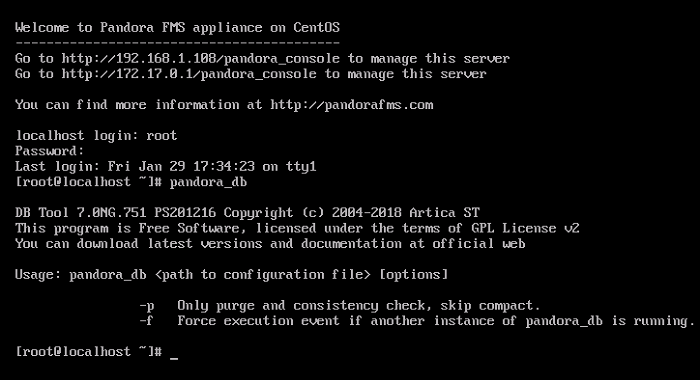
The database is maintained by a script named pandora_db.pl:
A good way to test whether database maintenance is correctly executed is running the script manually:
/usr/share/pandora_server/util/pandora_db.pl /etc/pandora/pandora_server.conf
It should not report any error. If another instance is using the database, you may use the -f option that forces the execution; with the -p parameter you do not compact the data. This is especially useful in High Availability environments with historical databases, as the script makes sure that the necessary steps for these components are performed in the correct order and mode.
Pandora FMS module status
In Pandora FMS, modules can have different status: Unknown, Normal, Warning, Critical or with Triggered Alerts.

When is each status set?
- Each module has
WarningandCriticalthresholds set in its configuration.- These thresholds define its data values for which these status will be activated.
- If the module gives data out of these thresholds, then it will be considered to be in Normal status.
- Each module also has a time interval that will set the frequency with which it will get data.
- This interval will be taken into account by the console to collect data.
- If the module has not collected data for twice its interval, this module will be considered to be in
Unknownstatus.
- Finally, if the module has alerts configured and any of them has been triggered but not validated, then the module will have the corresponding Triggered Alert status.
Spreading and priority
Within Pandora FMS organization, some elements depend on others, as for example agent modules or group modules. These equally applies to Pandora's FMS Enterprise policies, which have certain agents and modules associated that are considered to be associated to each agent.

This structure is specially useful for evaluating module status at a glance. This is achieved by spreading upwards in the organization schema the status, granting that status to agents, groups and policies.
Which status does the agent have?
An agent will have the worst of its modules's status. At the same time, a group will have the worst of the its agent's status, and the same for policies, which will have the worst status of its assigned agents.

That way, by seeing a group with a critical status, for example, you will known that at least one of its agents has the same status. To locate it, go down to the next level, to that of the agents to narrow down the module or modules that caused the spreading of the critical status.
Which should be the status priority?
When it is said the worst status is spread, it must be clear which status are the most important ones. Therefore, there is a priority list. In there the first status has higher priority over the others and the last one the one that has the lowest. This one will be shown only when all elements have it.
- Triggered Alerts.
- Critical status.
- Warning status.
- Unknown status.
- Normal status.
You may see that when a module has triggered alerts, its status has priority over the rest, and the agent and group it belongs to will have this status.

On the other hand, in order for one group to be in normal status, all its agents must have that status; which implies that all the group modules will be in normal status.
Color Code
Each one of the status mentioned has a color assigned, in order to to easily see in the network maps when something does not work properly.
Pandora FMS graphs
Graphs are one of the most complex Pandora FMS implementations, because they gather information in real-time from the DB, and no external system is used (RRDtool or similar).

There are several graph performances according to the type of source data:
- Asynchronous modules. It is assumed that there is no data compaction. Data stored in the DB are all the real samples of the data (therefore, no compaction). It creates more “accurate” graphs without possible misinterpretation.
- Text string modules. They show the rate of the collected data.
- Numerical data modules. Most modules report such data.
- Boolean data modules. This are numerical data on *PROC modules: for instance, ping checks, interface status, etc. 0 means wrong, 1 means “Normal”.
Compression
Compression affects how graphics are represented. When two pieces of data with the same value are received, Pandora FMS does not store the last on. If when we are representing a graph, there is no reference value, Pandora FMS will searches until 48 hours back in time to find the last known value to take as reference. If it does not find anything, it will start from 0.
In asynchronous modules, although there is no compression, the backwards search algorithm behaves similarly.
Interpolation
When making a graph, Pandora FMS takes 50xN samples (N is the graph resolution factor, which can be configured in the setup. It is 3 by default). For example, a monitor that returns data every 300 seconds (5 minutes) will generate 12 samples per hour, and 288 samples (12*24) a day. So a day graph would not represent 288 values, but rather they are “compresses” into only 150 (50*3) samples.
This means some resolution is lost. And the more samples you have, the more you will lose. But this can be avoided by creating the graphic with a different interval or zoom.
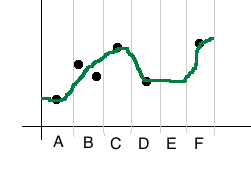
In normal graphs, interpolation is implemented in a simple way: if there are two samples withing an interval (e.g.: interval B of the example), the average will be calculated and representes.
In boolean graphs, if there are several data within a sample (in this case only 1 or 0), 0 will be shown. This helps to visualize failures within an interval, giving it priority over the normal status.
In both cases, if there is no data within a sample (because it is compressed or because it is missing), the last known value of the previous interval will be used, like interval E of the example above.
Avg/Max/Min
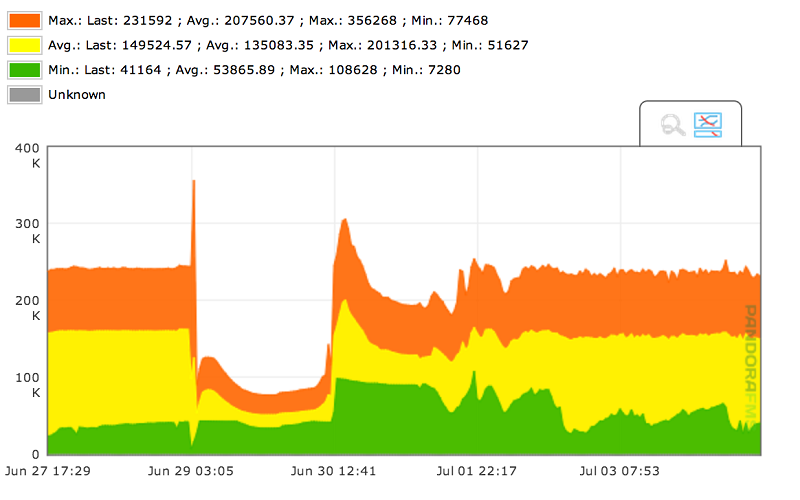
The graphs show the average, maximum and minimum values by default. Because a sample can have several data, average, maximum or minimum data values will appear. The more interpolation needed (the longer the display period is and the more data you have), the higher the interpolation level will be and therefore, the difference between maximum and minimum values will be higher.
If the graph range is low (an hour or so), there will not be any interpolation, or it will be minimum, so you will see the data with its real resolution, and the three series will be identical.
