What is Pandora FMS?
Pandora FMS is a monitoring software that collects data from any system, generates alerts based on that data, and displays graphs, reports, and maps of our environment.
Below, we will provide a general overview of some of the components of Pandora FMS, as well as certain features, to help you learn a little more about the tool.
Introduction
An overview of Pandora FMS and its key features. Some terms and concepts may seem unfamiliar, but they will be explained in more detail in their respective chapters.
Presentation
Pandora FMS is a monitoring software that collects data from any system, generates alerts based on that data, and displays graphs, reports, and maps of our environment.
It is possible to monitor systems, servers, applications, networks, events, and a long list of devices. Pandora FMS collects the information that needs to be monitored, compiles it, and saves it for visual representation, with the goal of performing actions required by the systems. This tool can run on different GNU/Linux® operating systems, including popular ones like Ubuntu® and Rocky Linux®, the latter being the recommended operating system.
Pandora FMS consists of different elements for its proper operation:
- Database (DB): The place where the servers store the information collected by the different monitoring tasks, as well as the tool's configuration.
- Web Console (console): This is the web interface responsible for displaying the collected data and the primary method for user interaction with the tool.
- Servers (* Server): These are responsible for collecting and processing data. All or part of them, when located on the same real or virtual device, are referred to as Pandora FMS Server or simply PFMS Server.
In Pandora FMS version 800 LTS, there are more than ten different servers specialized in various monitoring tasks; from network servers for remote checks to web servers used for monitoring user navigation. The following servers exist:
- Data Server: Responsible for processing local monitoring information.
- Network Server: Responsible for executing remote monitoring tasks through network checks. Monitoring of MS Windows® environments. Responsible for determining if a piece of data, at the current moment and based on its history, is anomalous. It also performs full web checks.
- SNMP trap Server: Responsible for collecting and processing SNMP traps.
- Discovery Server: Responsible for exploring the network and detecting new systems in operation. Monitoring through DISCO packages with an extensive catalog of monitoring options.
- Heavy Server: Responsible for performing more complex remote monitoring using custom scripts (plugins). It carries out data export for replication purposes. It obtains and displays both software and hardware information from monitored systems (inventory).
- Event Server: Responsible for collecting events occurring in the system.
- Satellite Server: A server installed separately to explore and remotely monitor new systems unreachable by the main server.
- WUX Server: Responsible for performing complex web transactions in a distributed manner.
The Pandora FMS Web Console allows different users with various profiles to manage and operate the tool. With this web tool, you can monitor the status of current monitoring, view statistical information through graphs or reports, and manage incidents generated by monitoring.
Pandora FMS is governed by the use of ACL profiles, through which a user can only access information related to the profile they belong to. For example, an administrator will be able to access all information contained in Pandora FMS, while a user may only have access to data belonging to a specific group. If necessary, advanced ACL functionality can be activated.
All the elements described above that make up Pandora FMS (Web Console, PFMS Server, and database) are included in a single software package—except for the Satellite server—which makes the installation of the tool practical.
This package is updated every month with the release of new versions that may include new functionalities, bug fixes, and security improvements.
Next, we will provide a general description of some elements that make up Pandora FMS, as well as certain functionalities to help you learn more about the tool.
Agents
What is an agent?
Agents are organizational elements created remotely or locally to contain a series of monitoring elements. They usually represent a device or server. An agent can have one or several IP addresses associated with it, and its name cannot be repeated with any other, although its alias can. Each agent belongs to a primary group, and to as many secondary groups as needed.
Agents have different statuses, which are determined by the status of their monitoring elements or modules.
The agent's task is to serve as the container for data extraction tools for a specific monitored machine or device.
What types of agents are there?
- EndPoint: It is a small piece of software installed on a machine with an operating system that remains running on it, extracting information through local or remote extraction tools and sending it to the Pandora FMS server regularly. This installation is carried out individually on each computer using an installer, either manually or automatically.
- Remote Agent: Simply called "agent", it is installed remotely through the Pandora FMS Web Console, pointing to an IP address reachable by the machine where the Pandora FMS server is installed. On this agent, we can only use remote extraction tools.
It is important to be clear about the difference between the agents: the EndPoint is a local agent owned by the machine with which local and remote monitoring can be performed, while the remote agent is a logical agent with which only remote monitoring can be performed.
Modules
What is a module?
Modules are units of information stored within an agent. They are the monitoring elements used to extract information from the device or server that the agent points to.
Modules have different data types, such as boolean, numeric, or alphanumeric. Depending on the information collected by the module, it will be of one type or another.
Each module can only store one type of metric. Within the same agent, there cannot be two modules with the same name.
All modules have an associated status, which can be:
- Not initiated: Where no data has been received yet.
- Normal: Data is being received with values outside the warning or critical thresholds.
- Warning: Data is being received with values within the warning threshold.
- Critical: Data is being received with values within the critical threshold.
- Unknown: The module has been working but has stopped receiving information for a certain period of time.
What types of modules are there?
There are several types of modules within Pandora FMS:
- Data module: This is a type of local monitoring module used to perform checks on the system where the Endpoint is located, such as the device's CPU usage or its free memory.
- Network module: This is a type of remote monitoring module used to perform checks to verify the connection with the device or server the agent points to, such as whether it is running or if a particular port is open.
- Plugin module: This is a type of local or remote monitoring module used to perform custom checks through the creation of scripts. With them, more advanced and extensive checks can be performed than those offered directly through the Pandora FMS Web Console.
- WMI module: This is a type of local monitoring module used to perform checks on MS Windows® systems via the WMI protocol, such as obtaining a list of installed services or the current CPU load.
- Prediction module: This is a type of predictive monitoring module used to perform different arithmetic operations by querying data from other "base" modules, such as the average CPU usage of monitored servers or the sum of connection latency.
- Web module: This is a type of web monitoring used to perform checks on a website's status and obtain data from it, such as seeing if a page is offline or if its response contains a specific word.
- Web analysis module: This is a type of web monitoring used to perform simulations of a user's web browsing, such as navigating to a website, entering credentials, or filling out forms.
Each of these module types may be used or not depending on the type of agent being created. As mentioned previously, a data module, being a local monitoring module, can only be generated within an EndPoint.
Events
What is an event?
An event is everything that happens within the system, from the creation of a module to a user login in the Web Console. The event itself is a descriptive text of the problem, its origin (agent), and its creation date.
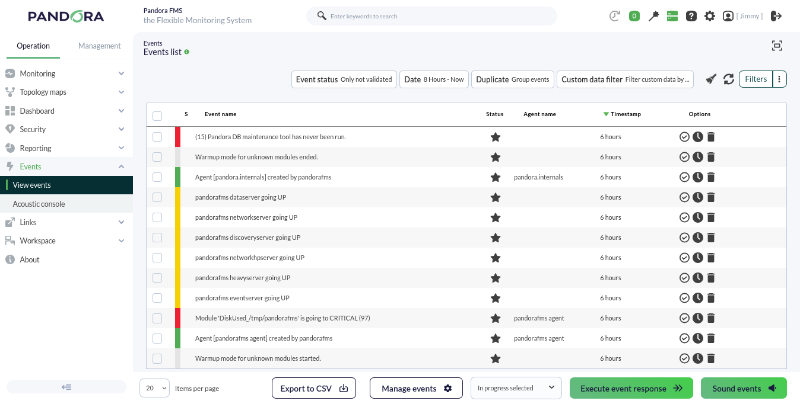
Pandora FMS allows the real-time visualization of all happenings in our monitored systems; with this information, we can perform the necessary actions according to the event created. Information is shown ranging from any change in a module's status, triggered or recovered alerts, to system restarts or custom events. It is one of the most used views by operations teams in any type of professional monitoring software.
An event can have three statuses:
- New: This is an event that has just been created by the system.
- In process: This is an event that a user has seen and is currently performing an action regarding the notification received. This status must be entered manually by a user.
- Validated: This is an event that has been viewed and for which the corresponding actions have already been performed. This status can be entered manually by a user, or automatically by the server when there are two events related to the same notification, where the last event will prevail.
Depending on the information the event carries, it will appear in one color or another. For example, if an information event arrives stating that a module has entered a critical status, this event will appear in red.
When an event is validated, the screen refreshes and the validated event "disappears." This happens because the default event view only shows non-validated or assigned events, but not validated ones, that have occurred during the last 8 hours. Thanks to this default view, we can observe active "problems" in real time.
When events occur due to module status changes, there will generally be two events: a first event for the transition from a normal status to an incorrect one, and a second event for the return to a normal status once the problematic situation is resolved.
In these cases, events transitioning to an incorrect status (critical or warning) are automatically validated upon returning to normality. This is what we call event auto-validation, an essential functionality that allows hiding irrelevant information in the event console.
Alerts
What is an alert?
An alert is the reaction of Pandora FMS to an inappropriate value of a module, event, or SNMP trap. This reaction is configurable and can consist of anything that can be triggered by a script configured in the Operating System where the Pandora FMS server processing the information runs.
An alert is a combination of different elements:
- The module which contains the information, the generated event, or the sent SNMP trap.
- The condition that triggers the alert (template).
- The command that is executed when the latter happens.
- The action or the specific way of executing that command, which can be particular to a specific case or general for a group of cases.
The general alert system allows creating them for each module of each agent, associating a single alert per module, although it can carry out one or several actions. It is a flexible system that allows defining applicable and generic templates for all modules, avoiding the need to define a specific alert for each module.
Alerts consist of:
- Templates: They define the alert start conditions. For example, changing to a critical status.
- Actions: They indicate the specific way to execute a command, passing particular parameters such as module name, agent, etc.
- Commands: The final execution that the Pandora FMS server will perform when starting the alert. It can be writing to a log, sending an email, an SMS, executing a script, etc. The command must implicitly define where the parameters are passed in the call to the actual command. This
template/action/commandsystem is designed to generate very generic templates and actions that serve most cases and allow applying changes globally.
The actions that Pandora FMS will perform in alert situations will eventually translate into executions on the server in the form of commands. Therefore, the command defines the "physical" or actual execution performed on the server. Commands are executed by the server that processes the data triggering the alert. There are predefined "internal" commands, such as generating an event or sending an email, which have an "invisible" command.
Actions are the alert components where a command is related to generic variables; that is, they define the way the command is called.
Alert templates define the alert trigger conditions and a default action. They are assigned individually to modules to determine under what circumstances a problem in the module in question will be alerted.
There are several types of alerts:
- Simple alerts: Alerts generated on a module, as explained above.
- Event alerts: Alerts created based on events generated by the system, allowing work from a much more flexible perspective, as alerts are not generated based on the status of a specific module, but rather on an event (which may even have been generated by several different modules from different agents). These alerts are based on complex rules, where a single rule can accommodate modules with the same name from different agents without having to create each alert individually per agent/module.
- SNMP trap alerts: SNMP trap alerts have their own subsystem, unless we redirect an SNMP trap to an agent by forwarding traps using the SNMP Trap Forwarding option.
Let's take the case where we have a module monitoring the saturation level of a company's network server. This is a critical element for the company, as a high level of saturation will affect network fluidity and employee productivity. We then generate an alert where, upon reaching a specific saturation level, Pandora FMS executes a command to relieve the workload on the network server, thus automatically preventing a high load saturation.
Data visualization
Views
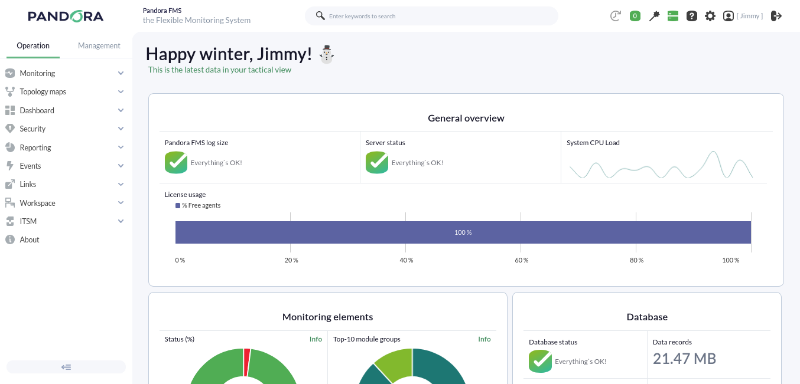
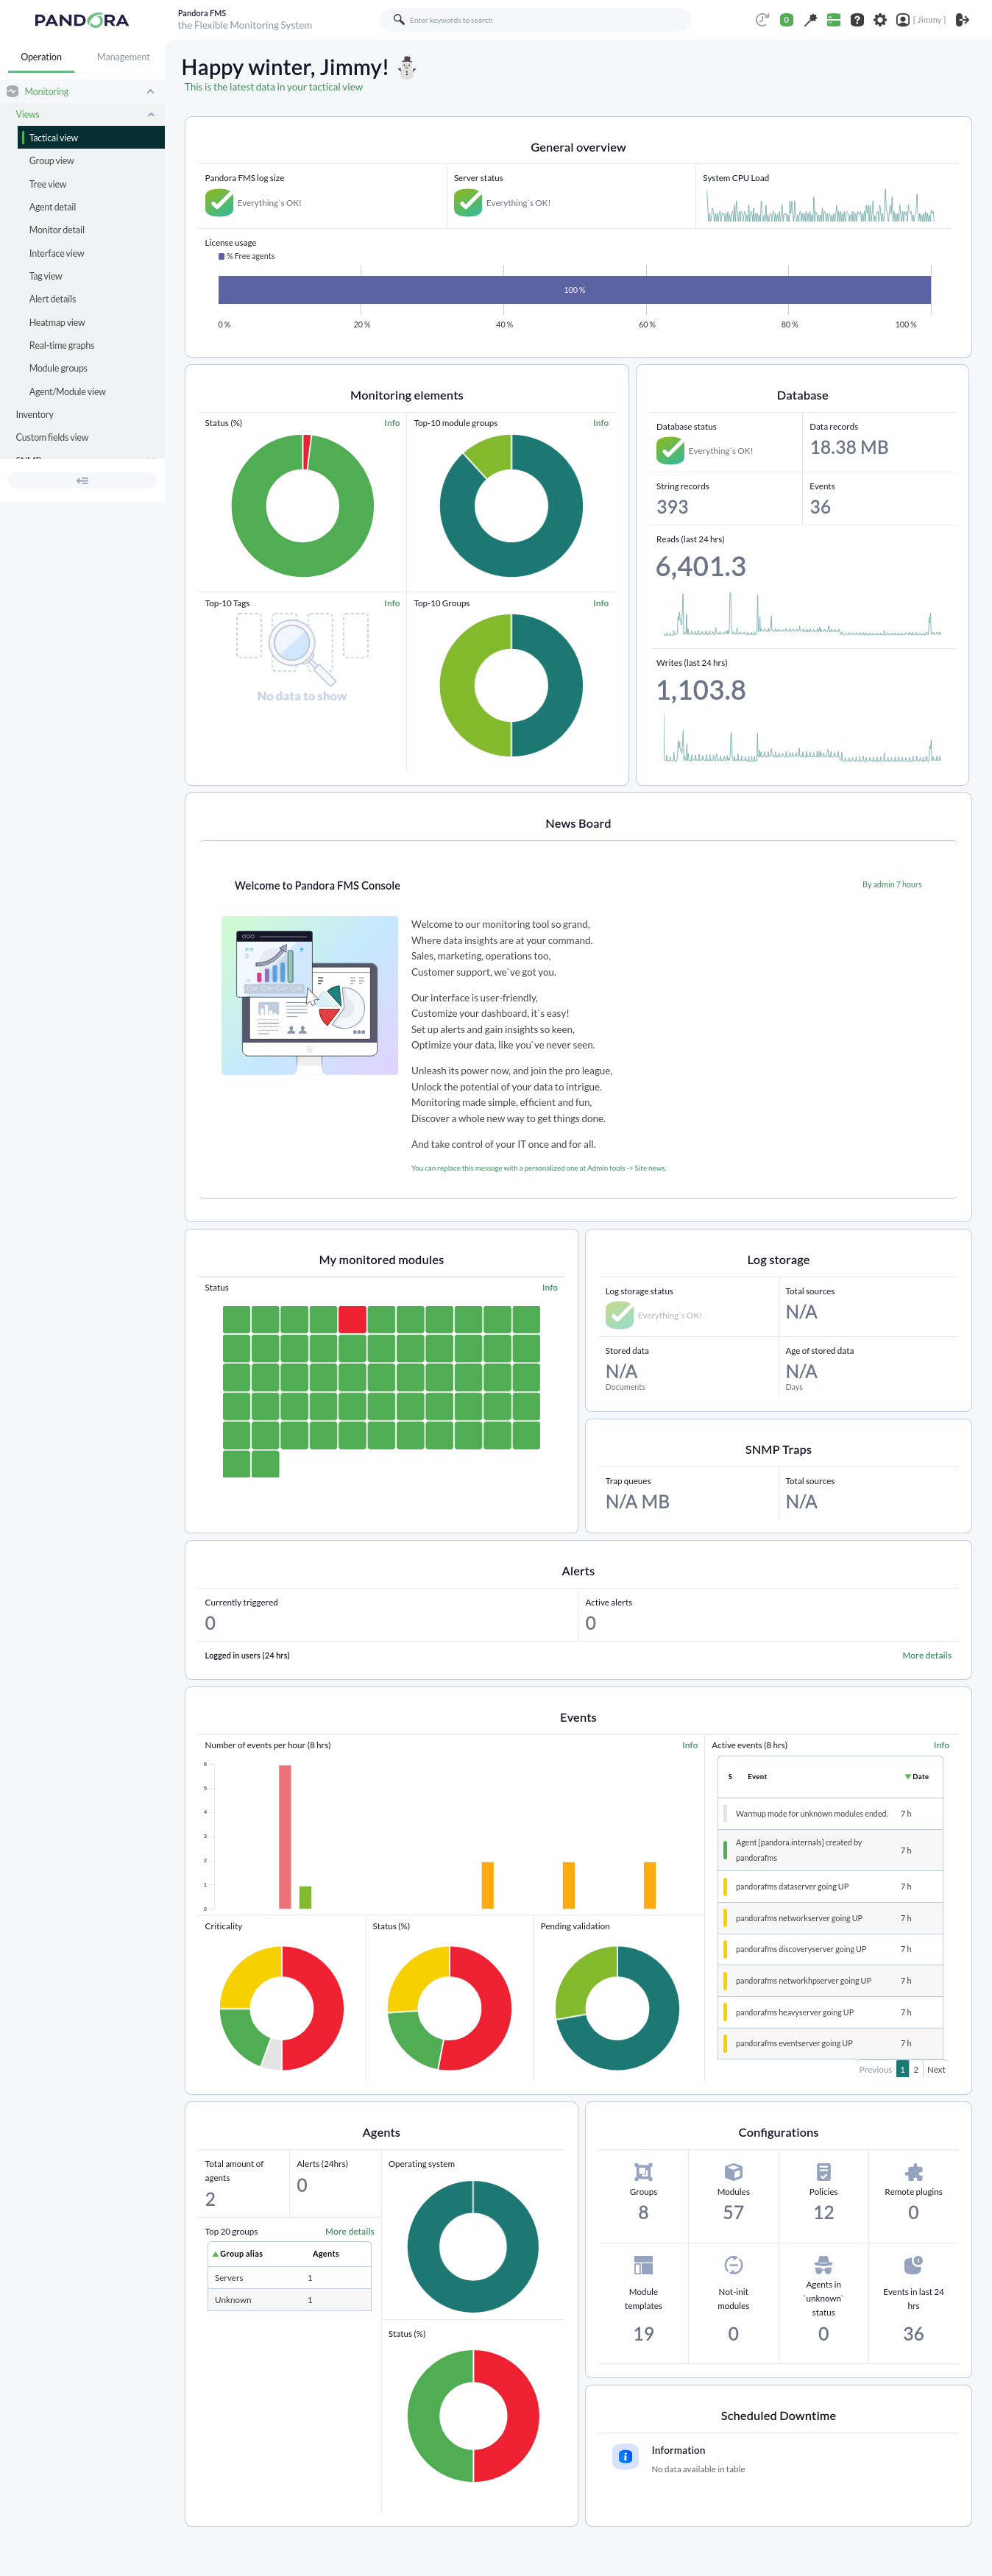
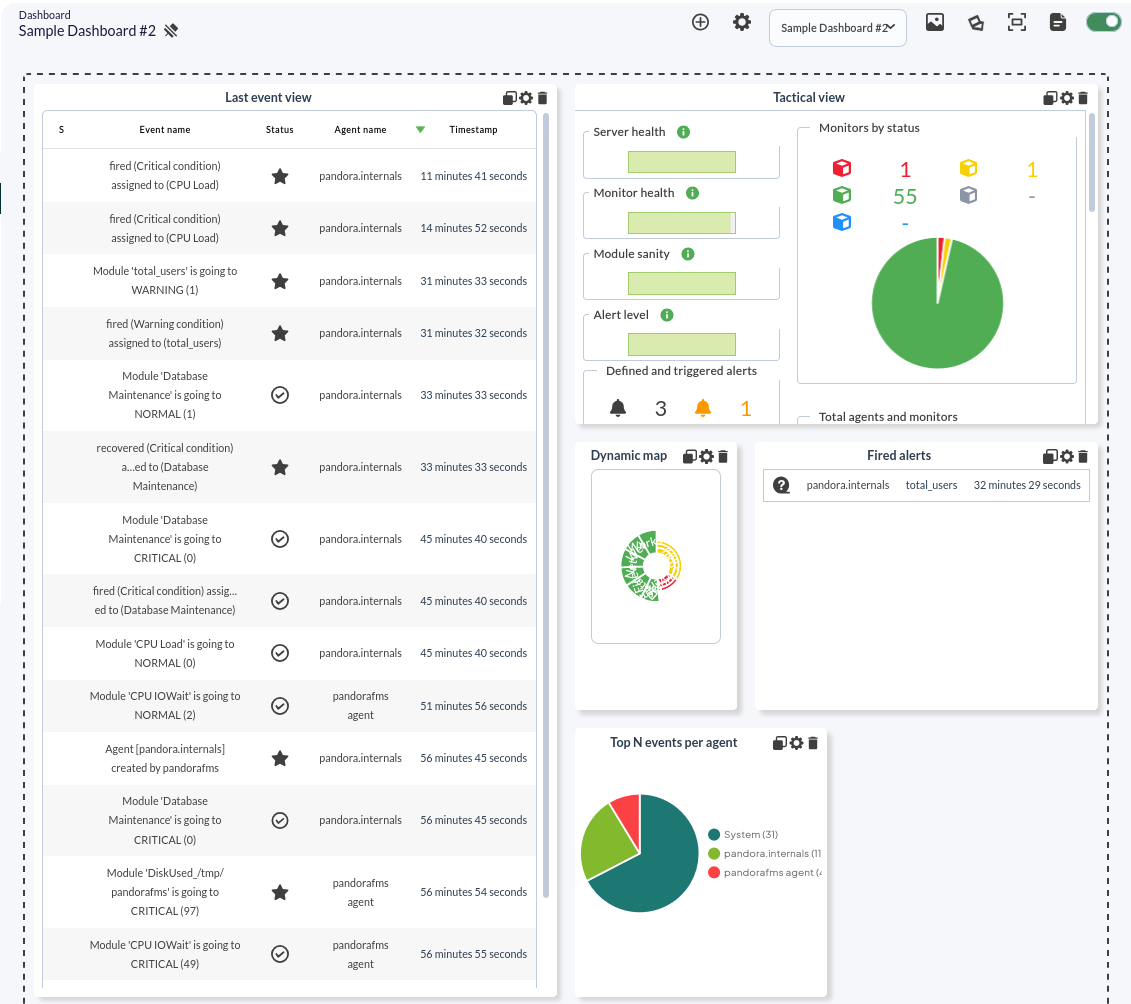
Pandora FMS offers a wide range of possibilities for visualizing the data collected by different monitoring tasks. Pandora FMS has a multitude of views featuring the data gathered by the tool. Below, we can see a routine visualization of the Tactical view:
Charts
Pandora FMS includes a collection of graphs with which the data collected over a user-defined period of time can be represented.
The graphs offered by Pandora FMS can be divided into two ways of visualizing data:
With data collected during a time threshold
We can find simple graphs generated automatically when receiving data from modules, or custom graphs.
Simple graphs: They show individually a range of data collected in the configured interval.
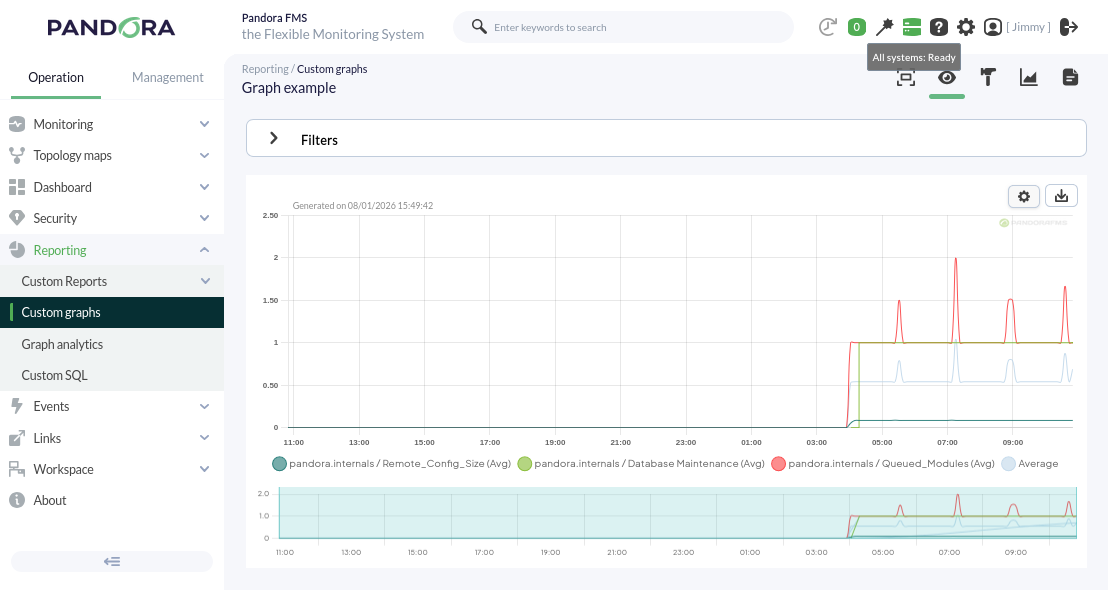
Custom graphs: They show combined information from any modules we want to represent on the same graph with the configured time interval. With this type of graph, we can perform comparisons between modules of different agents. An example of this type of graph can be seen below.
With real-time data
We can individually visualize certain information collected by the console, regarding the status of the server where our Pandora FMS is installed, in real time.
Through this functionality, for example, it is possible to observe the traffic flow of a network interface live.
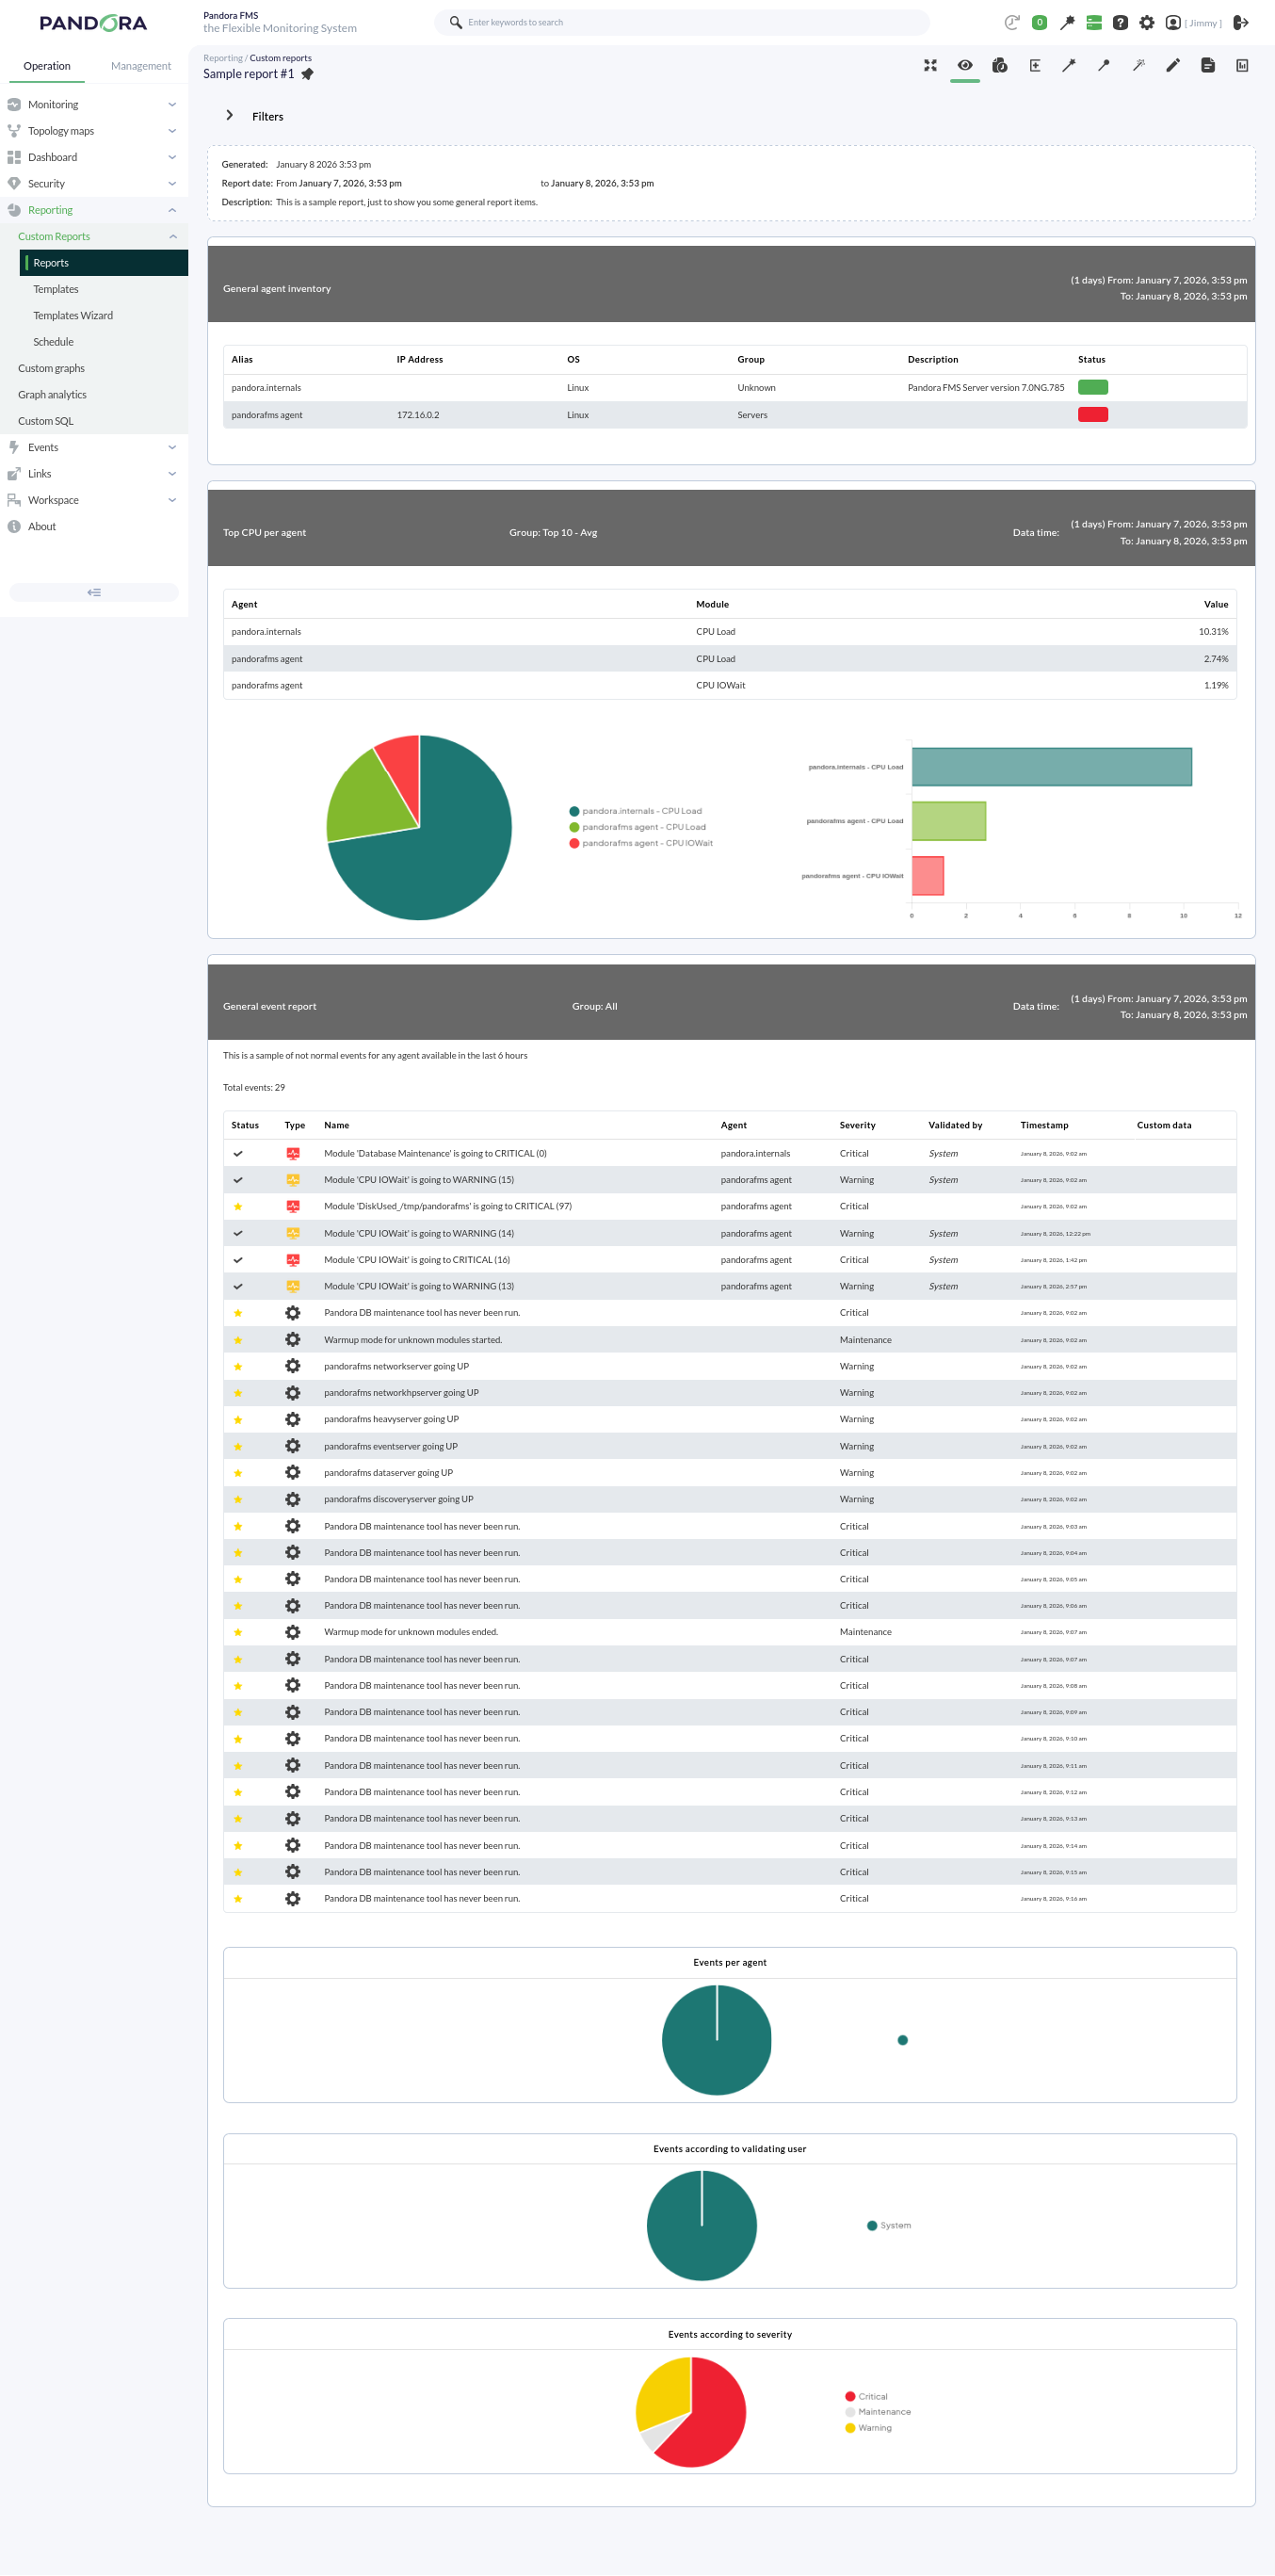
Reports
Pandora FMS offers the possibility of visualizing monitored data in an orderly manner within a report. We can generate these reports in different formats, such as HTML or PDF, and they can even be sent by e-mail automatically.
Within a report, data is represented in different ways:
- Simple graph: Shows a graph with the value of a module during a configured time interval.
- Predictive graph: Shows a graph with the expected values for a module during a configured time interval.
- Top N: Shows N values discriminated by maximum, minimum, or average over the total number of modules added, sorted in ascending or descending order, or by agent name.
- Projection graph: Shows a graph presented in two parts:
- On one hand, data referring to a selected module in an existing period of time.
- On the other hand, the estimate for a future time slot based on the previously selected values.
- Custom graph: Shows a graph with the values of different modules that have been configured in the graph.
- Module values: Where average, maximum, or minimum values, etc., can be included.
- S.L.A. graphs: Shows a graph presenting the compliance degree of a module in the configured interval.
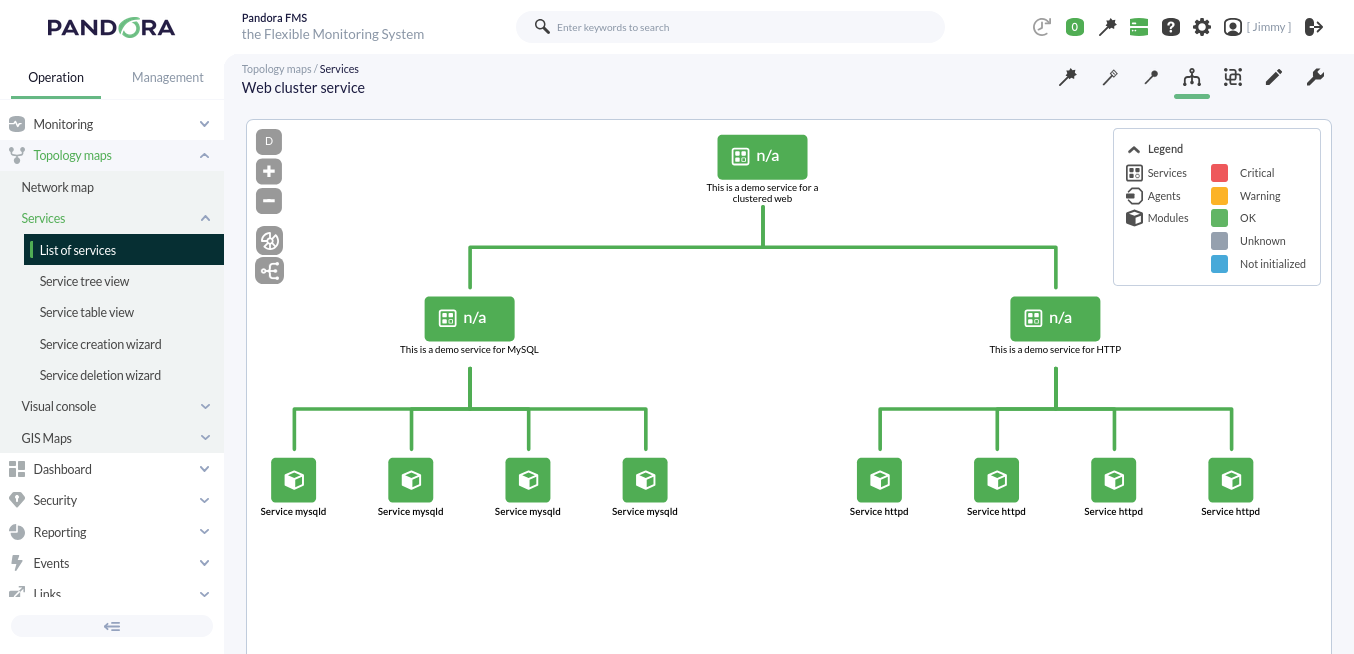
Services
A service is a grouping of resources that form a whole.
Pandora FMS monitors a group of elements whose individual status determines, in a configurable way, the global status of the service provided. For example, Pandora FMS depends on its various functionalities (Web Console, PFMS Server, MySQL database server), where each has a lesser or greater degree of importance for the correct operation of the tool.
Pandora FMS, when in high availability mode, even has a base schema similar to a web cluster:
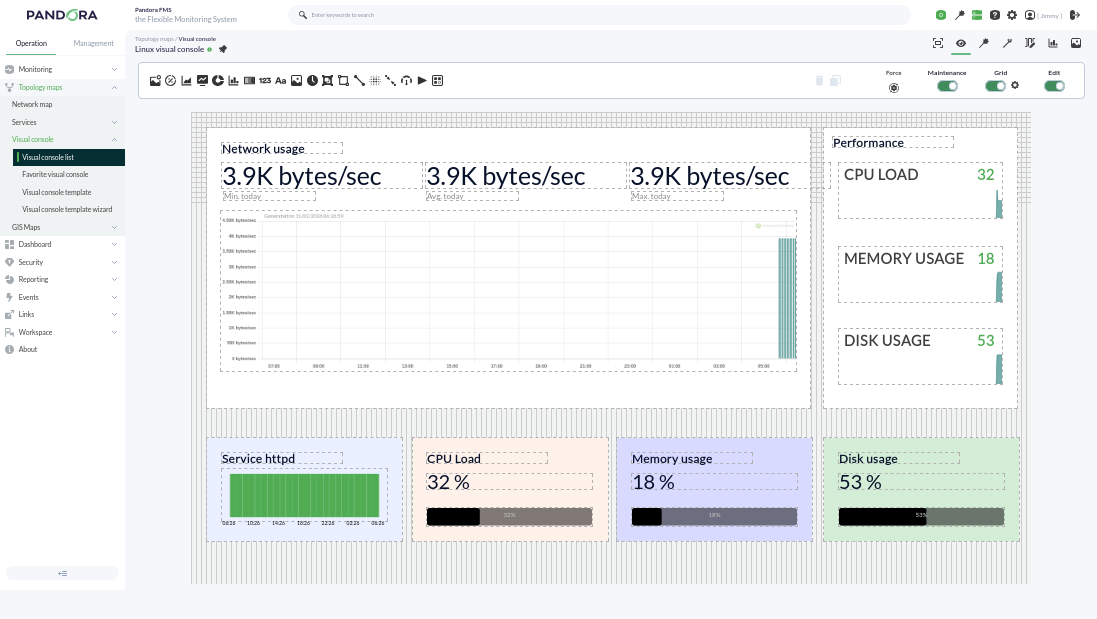
Visual Consoles
Pandora FMS offers the possibility of customizing how the monitoring carried out by the tool is visually represented. Within a Visual Console (Visual Console or simply VC), the following elements can be found:
- Static image: Image associated with a module/agent to view its status.
- Percentile element: In monitoring modules for finite resources (such as RAM, cache memory, etc.), where the resource is represented as 100 percent, it represents the checks of a module as a progress bar, although circular graphs can also be chosen.
- Module graph: Allows the visualization of an existing module's graph.
- Basic chart: Using the values received in the last hour, it shows a simple chart accompanied by the value and name of the corresponding module. Through the use of macros, more information such as the agent name or its IP address can be included.
- Serialized pie chart: Allows visualizing data from a module with up to 6 different elements, such as the number of times a module has gone through different statuses in the last day. Ideal for use with Agent plugins.
- Bar chart: You can select an agent and then one of its modules to show a simple graph with the values and data collected during monitoring.
- Event history graph: Allows visualizing the event histogram for a configured interval.
- Simple value: Allows visualizing a module's data in real time.
- Text label: Notice without content associated with an agent or modules.
- Icon: Simple image that can represent something (company logo, visual element like arrows, etc.).
- Progress: Allows visualizing the monitoring progress of a module.
- Clock: Allows adding a dynamic clock that displays the exact time at all times without having to reload the page.
- Group: Allows visualizing the status summary of a group of agents (statistics can be included).
- Box: If set with a transparent fill, it can be used to logically group other elements or used to highlight one or several of them with a different color.
- Line: Logically joins several elements (can be anchored to other elements).
- Color cloud: Allows representing heat maps depending on the data of an assigned module.
- Network link: Some elements need more than just a line; this link attaches to other elements and moves along with them, forming a bond.
- Odometer: Shows the current value of a module in the style of a speedometer.
- Action: Used as a button for the user for two purposes:
- Performing an API query to any other system that responds in JSON format for its graphic representation.
- Executing and validating alerts associated with modules.
- Service: Allows visualizing the status of a configured service.
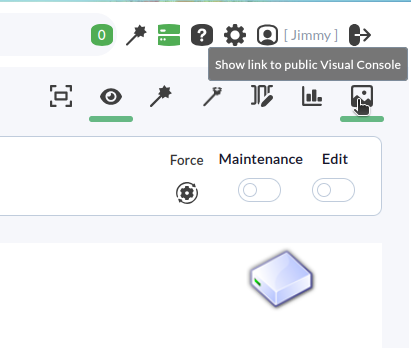
Each element can be linked to another Visual Console for calculation purposes and final availability, and also to quickly access linked visual consoles. They also optionally include a grid to align elements:
Visual Consoles have an additional functionality to share them via a public URL with any user outside of Pandora FMS:
Dashboards
Pandora FMS allows the creation of individual monitoring pages for each user, in which more than one window can be added to include different monitoring maps, graphs, or status summaries.
Several different widgets can be added to each dashboard, each occupying one cell. Each widget has its own characteristics and configurations.
Within a dashboard, we can include more than 20 different widgets that allow data to be displayed with a list of events or with module graphs.
Advanced features
Pandora FMS offers more advanced features designed for managing large environments with many agents and modules.
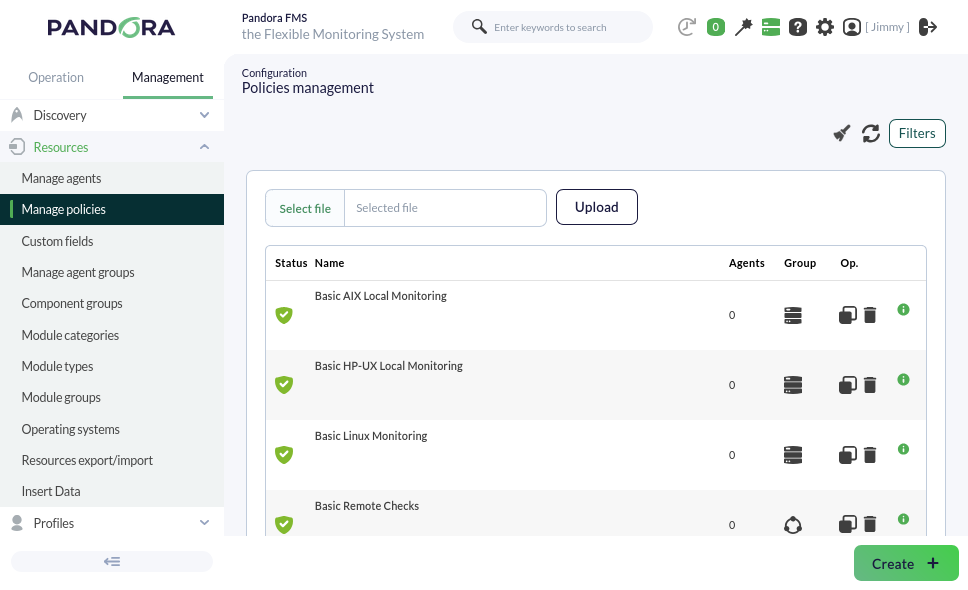
Monitoring Policies
The monitoring policy system proposed in Pandora FMS allows the management of large environments through the propagation of different tool elements in a centralized and homogeneous way within the same installation.
This functionality is designed for environments where you want to monitor a series of devices using the same modules, alerts, and other features.
Thanks to policies, we can avoid having to manually set up each individual monitoring task and instead execute the entire process on a large scale by quickly applying a policy.
Some of the operations that a policy can perform are:
- Create/Delete/Duplicate a policy.
- Add/Remove one or more agents to a policy.
- Create/Edit/Delete a module within a policy.
- Create/Edit/Delete an alert within a policy.
Scenario: a complex environment where we have groupings of devices depending on their role (servers, routers…); within this environment, you want to perform certain specific monitoring tasks for each group of devices as well as some global monitoring tasks. By applying monitoring policies, we can manage monitoring homogeneously, being able to introduce modules simultaneously without having to create them manually on each of the different devices.
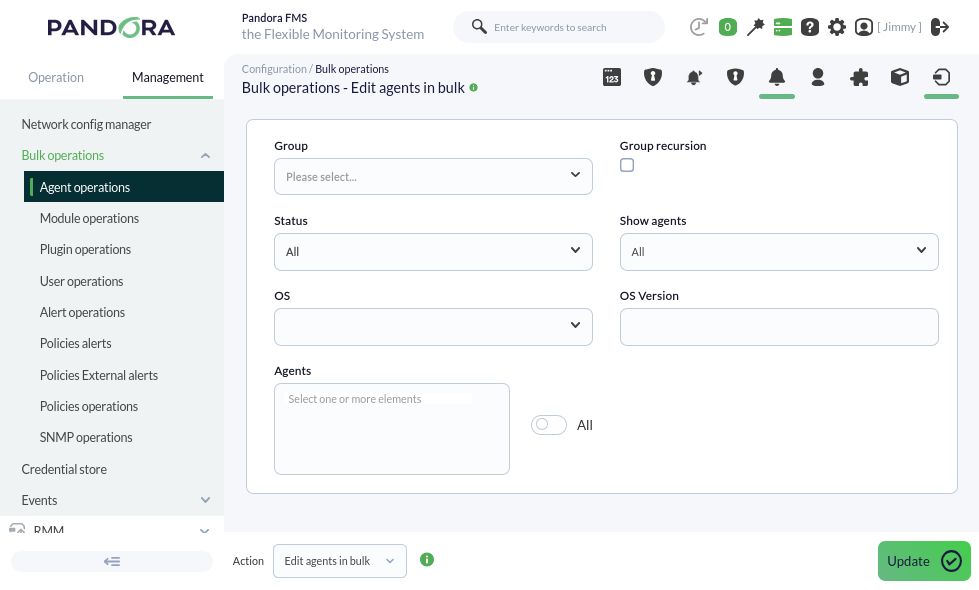
Bulk Operations
In Pandora FMS, it is possible to massively manage different elements of the tool. This functionality becomes important in environments with a high volume of monitoring. It is a complementary feature to policies for performing specific manual changes on large volumes of data.
Massive operations can be performed on the following elements, among others:
- Agents: existing agents can be edited or deleted.
- Modules: existing modules can be edited, copied, or deleted.
- Alerts: alerts can be added, deleted, enabled, or disabled for existing modules.
- Policies: alerts or modules can be added to or deleted from existing policies.
Metaconsole
The Metaconsole (Command Center) is a special Web Console where different Pandora FMS installations can be visualized, synchronized, and managed in a centralized and unified way. Thanks to this functionality, it is not necessary to manage each monitoring node independently; instead, they can be managed from a single place, allowing for virtually unlimited horizontal scalability.
The Metaconsole offers the user almost all the functionalities that a normal Pandora FMS installation provides. You can manage agents, modules, alerts, policies, etc., for each of the Pandora FMS installations included within the Metaconsole.
This functionality is designed for large work environments with multiple Pandora FMS installations. It is a way to provide a single point of access for a user to manage all their machines or to offer a single console that can provide service to different companies and/or users.
Take, for example, a company with branches around the world that has a Pandora FMS server in each country where it operates, potentially having more than 10 different servers. Thanks to this functionality, we could manage all other servers belonging to the company from a single server.
This is a very advanced Pandora FMS functionality, which is recommended to be used once the corresponding training has been completed.
Historical database
Pandora FMS, by default, deletes data older than 45 days from the database (this value can be configured).
Thanks to this functionality, it is possible to generate reports or graphs with old data without having to occupy this space in the main database.
It is also useful for preserving data for long-term SLAs.
Satellite Server
The Satellite Server is a server installed separately from the main one, used to explore and remotely monitor new systems unreachable by the Pandora FMS server and where we cannot install agents either.
It is an autonomous server that does not require a connection to the Pandora FMS database. It sends all data as XML, functioning similarly to an EndPoint in broker mode or an Export Server.
By connecting a Satellite Server version 785 to a Pandora FMS Server version 785, you can access it through that Web Console transparently to easily create and integrate the agents from both servers.
Data backup
This functionality is one of the most critical and important features of Pandora FMS.
A backup is a security copy where we store all tool data and configurations so that, in the event of a failure, we can recover our installation without losing any previously collected data.
Therefore, Pandora FMS provides the user with a simple tool to perform periodic database backups from the Web Console.
Separate backups must be made for directories and files of the PFMS Server and its Web Console:
- PFMS Server plugins, located in
/usr/share/pandora_server. - Remote configurations for EndPoints (their respective agents are in the database) located in
/var/spool/pandora/data_in/. - Custom images and other resources such as collections, all located in
/var/www/html/pandora_console.
In the extreme case of recovering from a serious failure, the essential procedure to bring the Pandora FMS Server back online is to perform a clean installation from scratch and then use the backup files to recover everything. There are details such as the fact that EndPoints will deliver all their accumulated data at once during the PFMS Server failure and special considerations for SLA reports: For all of these (and more), please contact our support department for proper advice.
Conclusion
This document covers only a small portion of Pandora FMS's features and options.
Resources
From the main Pandora FMS website, you can access various contents to learn more about the tool, download Pandora FMS packages and versions, or get in touch with Pandora FMS:
Pandora FMS has official documentation (which runs on DokuWiki), where you will find all the information about the tool's functionalities and elements:
In case of doubts or problems regarding Pandora FMS, there is a ticketing system for customers, as well as a forum for Open version users. There are also online courses to learn how to manage the tool at an advanced level, as well as a course to assist in its sale, through which you can apply for an official Pandora FMS certificate of use:
https://pandorafms.com/community/
Pandora FMS provides all users with a blog where both monitoring-specific elements and articles on technology, networks, and servers are explained, with the aim of increasing knowledge not only of the tool but of the increasingly technological world around us: