VMware
Plugin para monitorizar VMWare, pudiendo sacar datos de los datacenters, datastores, host exsi, máquinas virtuales y switches.
- Introducción
- Matriz de compatibilidad
- Prerrequisitos
- Parámetros y configuración
- Monitorización de eventos
- Ejecución manual
- Discovery
- Agentes generados por el plugin
Introducción
Este documento tiene como objetivo la descripción de la monitorización de datacenters, datastores, hosts exsi y máquinas virtuales con Pandora FMS mediante el plugin de Vmware de pandora a través del discovery.
Supervisión de la arquitectura de VMware
Con este sistema, es posible monitorizar arquitecturas como la siguiente.
Pandora FMS puede monitorizar VCenter, servidores ESXi y los componentes que virtualizan Datastores y Máquinas Virtuales. Pandora FMS se basa en la API proporcionada por la líbreria pyvmomy uno de los SDK oficiales de Vmware para la recopilación de datos.
La monitorización de un entorno de VMware se puede dividir en varios aspectos importantes para tener una visión completa del rendimiento y la salud del entorno.
Principales de la monitorización de un entorno de VMware
Monitorización de las máquinas virtuales (VM)
Las máquinas virtuales son la base del entorno de virtualización de VMware. La monitorización de las VMs es importante para obtener información sobre el uso de recursos, la disponibilidad y el rendimiento de las VMs. Algunas de las métricas importantes a monitorizar son el uso de CPU, memoria, almacenamiento y red.
Monitorización de ESXi
ESXi es el hipervisor de VMware que se ejecuta en el servidor físico y proporciona la capacidad de virtualización. El monitoreo de ESXi es importante para obtener información sobre la utilización de recursos, la salud del host y la capacidad de rendimiento. Algunas de las métricas importantes a monitorizar son el uso de CPU, memoria, almacenamiento, red y la carga del host.
Monitorización de Datastores
Los datastores son los espacios de almacenamiento en el hipervisor ESXi que almacenan las imágenes de las VMs y los archivos de configuración. La monitorización de los datastores es importante para obtener información sobre el uso de almacenamiento, la salud del almacenamiento y la capacidad de rendimiento. Algunas de las métricas importantes a monitorizar son el uso de espacio, la tasa de transferencia de lectura y escritura, y el uso de la CPU y la memoria en el almacenamiento.
Monitorización de Datacenters
Los datacenters son grupos lógicos de recursos de virtualización que incluyen hosts ESXi, clusters, redes y almacenamiento. La monitorización de los datacenters es importante para obtener información sobre la utilización de recursos, la salud del entorno y la capacidad de rendimiento. Algunas de las métricas importantes a monitorizar son la disponibilidad de los recursos, el uso de CPU, memoria, almacenamiento y red en el datacenter.
Estadísticas avanzadas
Al instalar las VMware Tools en una máquina virtual, se habilita la recopilación de estadísticas avanzadas de la VM. Las VMware Tools son un conjunto de controladores y servicios que se instalan en una máquina virtual para mejorar su rendimiento y capacidad de gestión en un entorno de virtualización VMware.
Las estadísticas avanzadas de la VM son métricas detalladas que se pueden recopilar para monitorear y optimizar el rendimiento de la máquina virtual. Algunas de las estadísticas avanzadas que se pueden recopilar incluyen:
Información de hardware
La información de hardware de la VM incluye detalles sobre el procesador, la memoria, el almacenamiento y la red de la máquina virtual. Estos detalles pueden ser útiles para identificar cuellos de botella de recursos y optimizar la configuración de la VM.
Información de rendimiento: Las estadísticas de rendimiento incluyen métricas detalladas sobre el uso de CPU, memoria, disco y red de la VM. Estas métricas pueden ser útiles para identificar cuellos de botella de rendimiento y optimizar la configuración de la VM.
Información de eventos
Las estadísticas de eventos incluyen información detallada sobre eventos que ocurren en la VM, como inicios y detenciones, reinicios, errores de hardware y software, y mucho más. Esta información puede ser útil para solucionar problemas de la VM y para mejorar su estabilidad y confiabilidad.
Para habilitar las estadísticas avanzadas de la VM, es necesario instalar las VMware Tools en la máquina virtual. Una vez instaladas las VMware Tools, se pueden habilitar las estadísticas avanzadas en la configuración de la VM. Para hacer esto, siga los siguientes pasos:
- Haga clic con el botón derecho en la máquina virtual y seleccione "Editar configuración".
- Seleccione "Opciones avanzadas" y haga clic en "Editar configuración".
- Seleccione "Habilitar la recopilación de estadísticas avanzadas" y haga clic en "Aceptar".
Una vez habilitadas las estadísticas avanzadas de la VM, se pueden ver y analizar estas estadísticas utilizando herramientas de monitoreo de VMware, como vCenter Server, vRealize Operations Manager, entre otras. Esto permitirá obtener una mejor comprensión del rendimiento y la salud de la VM y ayudará a tomar decisiones informadas sobre cómo optimizar la configuración de la VM para maximizar su rendimiento y eficiencia.
Configuración del vCenter para la monitorización
Discovery Applications VMware hace uso de las métricas que proporciona la API de los vCenter® y ESXi VMware®. La disponibilidad de estas métricas depende de los niveles configurados para recolección de estadísticas.
Estos niveles se pueden cambiar en el menú vCenter Server Settings y en la opción Statistics. Para cada opción de tiempo y cada nivel obtendrá la descripción de los contadores que recolecta el vCenter. El nivel mínimo para monitorizar con el plugin de Pandora FMS es el Nivel 2.

Dependiendo de la configuración del vCenter, es posible que algunos módulos no reporten datos en Pandora FMS. Esto puede ser porque:
-
Falte instalar algún plugin en el vCenter.
-
Sea necesario instalar un agente VMware® (vmware-tools) en la entidad.
-
Simplemente porque la entidad esté apagada (máquina virtual o ESXi).
Para solucionar estos problemas deberá consultar la documentación de VMware.
Algunas soluciones, como por ejemplo, la monitorización del estado del hardware (Hardware Status), podrían requerir una configuración avanzada tanto del vCenter como de los host que soportan los ESX.
Matriz de compatibilidad
| Entornos donde se ha probado | Versión 6.5.0 |
| Entornos donde debería funciona | Cualquier entorno VMWare |
| Sistemas donde se ha probado | Rocky linux, Fedora 34 |
| Sistemas donde funciona | Cualquier sistema linux |
Prerrequisitos
El plugin es un binario que contiene las dependias empaquetadas por lo que no es necesaria la instalación de ningún tipo de dependencia para su uso.
El único requisito para el funcionamiento de este, es que la carpeta lib, adjunta con el plugin, se encuentre en la misma ruta que el binario.
No obstante, para la monitorizacion de algunas estadísticas avanzadas, si se requiere la instalación de VMware Tools en las máquinas en las que se requiere obtener estas.
Por defecto, la API de vSphere utiliza el puerto TCP 443 para la comunicación, por lo que se debe asegurar de que ese puerto esté accesible.
Con VMware Tools se pueden obtener diversas métricas avanzadas de rendimiento y estadísticas de las máquinas virtuales
Parámetros y configuración
Parámetros
| --generate_password | para generar una contraseña encriptada, ( si quiere usarse luego esta contraseña para conectar, se deberá introducir en la opción de configuración "password" y activar también en el archivo de configuración la opción "use_encrypted_password" con 1. |
| --as_discovery_plugin | opción para usarlo en el modo discovery. |
Bloques de configuración
El archivo de configuración se divide en los siguientes bloques
- Configuration
- Datacenter
- Datastore
- ESX
- VM
- Rename
- Reject
- Header
Cada uno de los bloques se especifica en el fichero de configuración introduciendo sus parámetros debajo de estos bloques, por ejemplo :
Configuration
server 192.168.100.105
user pandorafms
pass P@$5w0rd!
datacenter ha-datacenter
A continuación se detalla cada bloque y sus opciones:
Configuration
Debajo del bloque configuration se pueden especificar los siguientes parámetros
Configuración global
| server | Nombre o IP del server a monitorizar |
| user | Usuario de la cuenta |
| pass | Contraseña de la cuenta |
| datacenter | Datacenter al que apuntará el plugin |
| temporal | Ruta donde se guardarán los archivos temporales |
| logfile | Ruta donde se guardará el archivo de logs |
| entities_list | Ruta donde se creara el archivo entities_list (más información sobre este archivo abajo) |
| transfer_mode | Modo de ejecución, las dos opciones posibles son local o tentacle |
| local_folder | Ruta de la carpeta donde se crearan los XML de los agentes para el modo de transferencia local (transfer_mode = local) |
| pandora_url | URL de pandora (solo si se requiere usar el modo eventos del plugin) |
| api_pass | Contraseña de la api de pandora (solo si se requiere usar el modo eventos del plugin) |
| api_user | Usuario api de pandora (solo si se requiere usar el modo eventos del plugin) |
| api_user_pass | Contraseña del usuario de api de pandora (solo si se requiere usar el modo eventos del plugin) |
| event_mode | Para activar la monitorización de eventos del vCenter, se activa con 1. Los eventos son copiados a la lista de eventos de Pandora FMS y pasan a formar parte de su flujo normal (requiere conectividad con el API de la consola de Pandora FMS). Esta opción solo esta disponible para vCenter. |
| event_pointer_file | Ruta donde se guardará el archivo event_pointer_file |
| tentacle_ip | IP de tentacle, requerida si se ejecuta el plugin en transfer_mode tentacle |
| tentacle_port | Puerto de tentacle, por defecto es 41121 |
| tentacle_opts | Opciones adicionales para la transferencia de ficheros al servidor de Tentacle indicado |
| virtual_network_monitoring | Activa la monitorización de switches virtuales con valor 1 |
| use_encrypted_password | Activa el uso de una contraseña encriptada con valor 1 |
| threads | Número de hilos que usará el plugin en la creación de agentes |
| interval | Intervalo en segundos en el que se crean los agentes del plugin |
| recon_interval | Intervalo en segundos después del cual el archivo de caché de la entidad temporal se eliminará automáticamente para volver a escanear la infraestructura de VMware®. |
| enable_recon_interval | Activa recon_interval con 1. |
| group | Grupo donde se van a crear los agentes |
| use_ds_alias_as_name | Activa el uso del alias del agente de datastore como nombre del agente con valor 1 |
| statsinterval | Intervalo en segundos para las estadísticas sacadas mediante la opción "custom_performance" |
| flat_datastore_agents | Activa la creación de un único agente para los datastores con con nombre "VMWareDatastores" con valor 1 |
|
use_ds_entity_name
|
Activa el uso del nombre del Datastore como nombre del agente con valor 1 |
|
discard_empty_adapters
|
Si se activa con 1, se descartara la monitorización de adaptadores HBA de ESX, que tengan sus destinos, dispositivos y rutas en 0. |
Parámetros de control de elementos monitorizables
| monitor_exclusive_agents | Activar la monitorización de agentes específicos ( estos se específican en los parámetros de abajo) con valor 1 |
| exclusive_esx | Si esta activado monitor_exclusive_agent, sirve para especificar los esxi a monitorizar. Su valor será un JSON de tipo array con los agentes a monitorizar |
| exclusive_datastores | Si esta activado monitor_exclusive_agent, sirve para especificar los datastore a monitorizar. Su valor será un JSON de tipo array con los agentes a monitorizar |
| exclusive_vm | Si esta activado monitor_exclusive_agent, sirve para especificar las vm a monitorizar. Su valor será un JSON de tipo array con los agentes a monitorizar |
| exclusive_rp | Si esta activado monitor_exclusive_agent, sirve para especificar los grupos de recursos a monitorizar. Su valor será un JSON de tipo array con los agentes a monitorizar |
| scan_datastore | Activa el escaneo de datastores con valor 1 |
| scan_datacenter | Activa el escaneo del datacenter con valor 1 |
| scan_esx | Activa el escaneo de esx con valor 1 |
| scan_vm | Activa el escaneo de máquinas virtuales con valor 1 |
| scan_rp | Activa el escaneo de grupos de recursos con valor 1 |
Datacenter
Parámetros de activación o desactivación de módulos
Los siguientes módulos pueden activarse o desactivarse en archivo de configuración usando "enabled" o "disabled".
| ping | Comprobación de ping a la máquina que admite vCenter |
| check443 | Verificación del puerto 443 en la máquina que admite vCenter |
Datastore
Parámetros de activación o desactivación de módulos
Los siguientes módulos pueden activarse o desactivarse en archivo de configuración usando "enabled" o "disabled".
| capacity | Capacidad máxima del almacén de datos en bytes |
| freeSpace | Porcentaje de espacio libre en el almacén de datos |
| overallocation | Porcentaje de sobreasignación de disco |
| freeSpaceBytes | Cantidad de espacio libre en disco en bytes |
| dsPathStatus | Estado de la ruta del datastore |
ESX
Parámetros de activación o desactivación de módulos
Los siguientes módulos pueden activarse o desactivarse en archivo de configuración usando "enabled" o "disabled".
| diskRead | Velocidad de lectura Kb/s del disco |
| diskWrite | Tasa de Kb/s escritos del disco |
| kernelReadLatency | Latencia de la lectura del disco en milisegundos |
| kernelWriteLatency | Latencia de escritura del disco en milisegundos |
| deviceReadLatency | Tiempo que tarda un dispositivo de almacenamiento en responder a una solicitud de lectura de datos |
| deviceWriteLatency | Tiempo que tarda un dispositivo de almacenamiento en responder a una solicitud de escritura de datos |
| cpuInfo | Información general de la CPU (crea un módulo para cada CPU ESXi) |
| pciDevice | Cantidad de dispositivos PCI asignados |
| hbaDevice | Cantidad de dispositivos HBA (Host Bus Adapter) asignados a una máquina virtual |
| pnicInfo | Información relacionada con los adaptadores físicos de red (PNICs) que están configurados en el host ESXi |
| vnicInfo | Información sobre las interfaces de red virtuales del host |
| cpuUsagePercent | Porcentaje de uso actual de la CPU en el host |
| memoryUsagePercent | Porcentaje de uso actual de la memoria RAM en el host |
| diskRate | Velocidad de transferencia de datos de lectura y escritura en el disco virtual del host |
| maxDiskLatency | Tiempo máximo de latencia de E/S en el disco virtual del host |
| netUsage | Velocidad de transferencia de datos de red en el host |
| systemHealthInfo | Información sobre el estado de salud general del sistema. |
|
systemHealthInfoMetrics
|
Estadísticas de los sensores |
| netReceived | Cantidad de datos recibidos a través de la interfaz de red del host |
| netTransmitted | Cantidad de datos transmitidos a través de la interfaz de red del host |
| netPkgRx | Cantidad de paquetes de red recibidos por la interfaz de red del host |
| netPkgTx | Cantidad de paquetes de red transmitidos por la interfaz de red del host |
| pathStatus | Estado de cada path |
VM
Parámetros de activación o desactivación de módulos
Los siguientes módulos pueden activarse o desactivarse en archivo de configuración usando "enabled" o "disabled".
| virtualImagePath | Ruta de acceso de la imagen de disco virtual asociada a una máquina virtual en particular |
| toolsRunningStatus | Estado de ejecución de las herramientas de VMware Tools en una máquina virtual |
| host | Servidor físico que aloja las máquinas virtuales en un entorno de virtualización |
| connectionState | Estado de conexión entre una máquina virtual y su host ESXi en un entorno de virtualización |
| guestState | Estado de la máquina virtual en términos de su sistema operativo y aplicaciones en ejecución |
| guestOS | Sistema operativo que se está ejecutando en la máquina virtual |
| hostName | Nombre del host físico en el que se está ejecutando la máquina virtual |
| powerState | Indica si la máquina virtual está encendida o apagada |
| triggeredAlarmState | Muestra el estado de las alarmas activadas en la máquina virtual |
| bootTime | Muestra la fecha y hora de inicio de la máquina virtual |
| vcpuAllocation | Número de CPU virtuales asignadas a la máquina virtual |
| cpuAllocation | Cantidad de recursos de CPU asignados a la máquina virtual |
| consumedOverheadMemory | Cantidad de memoria utilizada por el host para realizar tareas relacionadas con la máquina virtual |
| hostMemoryUsage | Cantidad de memoria utilizada por el host para realizar tareas relacionadas con la máquina virtual |
| maxCpuUsage | Máximo uso de la CPU en la máquina virtual |
| maxMemoryUsage | Máximo uso de memoria en la máquina virtual |
| memoryMBAllocation | Cantidad de memoria RAM asignada a la máquina virtual |
| memoryAllocation | Cantidad de memoria asignada a la máquina virtual |
| uptimeSeconds | Tiempo total que la máquina virtual ha estado en funcionamiento |
| memoryOverhead | Cantidad de memoria utilizada por el host para tareas de supervisión y gestión de la máquina virtual |
| overallCpuDemand | Cantidad total de recursos de CPU solicitados por la máquina virtual |
| overallCpuUsage | Cantidad total de recursos de CPU utilizados por la máquina virtual |
| privateMemory | Cantidad de memoria utilizada por la máquina virtual para sus procesos privados |
| sharedMemory | Cantidad de memoria compartida entre la máquina virtual y el host |
| diskUsed | Cantidad de espacio utilizado en el disco virtual de la máquina virtual |
| provisioningUsed | Cantidad de espacio utilizado en el almacenamiento de aprovisionamiento de la máquina virtual |
| macAddress | Dirección MAC asignada a la interfaz de red de la máquina virtual |
| ipAddress | Dirección IP asignada a la interfaz de red de la máquina virtual |
| heartbeat | Estado del latido del corazón de la máquina virtual |
| cpuReady | Cantidad de tiempo que la máquina virtual está esperando por la CPU |
| snapshotCounter | Número de instantáneas creadas para la máquina virtual |
| totalReadLatency | Tiempo de latencia total de lectura del disco virtual de la máquina virtual |
| totalWriteLatency | Tiempo de latencia total de escritura del disco virtual de la máquina virtual |
| cpuUsagePercent | Porcentaje de uso actual de la CPU en la máquina virtual |
| memoryUsagePercent | Porcentaje de uso actual de la memoria RAM en la máquina virtual |
| diskRate | Velocidad de transferencia de datos de lectura y escritura en el disco virtual de la máquina virtual |
| maxDiskLatency | Tiempo máximo de latencia de E/S en el disco virtual de la máquina virtual |
| netUsage | Velocidad de transferencia de datos de red en la máquina virtual |
| systemHealthInfo | Información sobre el estado de salud general del sistema |
| netReceived | Cantidad de datos recibidos a través de la interfaz de red de la máquina virtual |
| netTransmitted | Cantidad de datos transmitidos a través de la interfaz de red de la máquina virtual |
| netPkgRx | Cantidad de paquetes de red recibidos por la interfaz de red de la máquina virtual |
| netPkgTx | Cantidad de paquetes de red transmitidos por la interfaz de red de la máquina virtual |
|
snapshotCounter
|
Número de snapshots de la máquina virtual |
|
snapshotDate
|
Fecha de cada snapshot |
RP
Parámetros de activación o desactivación de módulos
Los siguientes módulos pueden activarse o desactivarse en archivo de configuración usando "enabled" o "disabled".
| cpuUsageMhz | Uso de CPU en MHz del Resource Pool. |
| memActive | Memoria activa en uso. |
| memGranted | Memoria asignada al Resource Pool. |
| memShared | Memoria compartida entre máquinas virtuales. |
| memSwapped | Memoria enviada a swap en disco. |
| memVmmemctl | Memoria recuperada mediante ballooning. |
| memOverhead | Memoria usada por VMware para gestión. |
Rename
El renombrado de entidades se realiza mediante el token RENAME y permite renombrar las entidades descubiertas por el plugin. Al utilizar esta funcionalidad, los agentes creados en Pandora FMS aparecerán con el nuevo nombre asignado. La estructura de esta sección es la siguiente:
<current name> TO <new name>Un ejemplo de configuración en este apartado podría ser el siguiente:
 #Rename entities
 Rename
 Debian 11 TO Virtual Machine 1
 RedHat 12 TO Web server
 ESX Workstation TO Host Work Sales
Header
En header se le puede añadir un prefijo a cada nombre de agente, lo que puede ser útil para una identificación más rápida de estos en pandora. La sintaxis de cada bloque es :
dc <prefijo>
ds <prefijo>
esx <prefijo>
vm <prefijo>
rp <prefijo>
Un ejemplo puede ser el siguiente :
dc DC_
ds DS_
esx ESXi_
vm VM_
rp RP_
En este ejemplo, todos los agentes de máquina virtual tendrían un nombre con la siguiente estructura:
VM_<nombre_de_agente>Reject
Sirve para descartar la monitorizacion de máquinas virtuales o ESX específicos, cada entidad a desactivar de la monitorizacion debe especificarse el fichero de configuración, debajo de este bloque, en una linea diferente por cada entidad.
Un ejemplo puede ser el siguiente:
Reject
gridNode
Vm_apx
Vm_acr
También sirve para desactivar el escaneo de IPs de los agentes, se utiliza con este parámetro.
| all_ipaddresses | Desactiva el escaneo de direccones IP con valor 1 |
Ejemplo archivo de configuración
Configuration
server 192.168.80.36
datacenter ha-datacenter
user pandora
group Applications
use_encrypted_password 0
interval 300
pass HhVGFJk!H
threads 5
event_mode 0
retry_send 0
virtual_network_monitoring 0
recon_interval 300

monitor_exclusive_agents 0
exclusive_esx []
exclusive_datastores []
exclusive_vm []
exclusive_rp []

scan_datastore 1
scan_datacenter 1
scan_esx 1
scan_vm 1
scan_rp 1

logfile /tmp/tmp_discovery.taskMD5.log
entities_list /tmp/tmp_discovery.taskMD5.entities
event_pointer_file /tmp/tmp_discovery.taskMD5.events
temporal /tmp
transfer_mode tentacle
tentacle_ip 127.0.0.1
tentacle_port 41121
tentacle_opts
local_folder /var/spool/pandora/data_in
pandora_url http://127.0.0.1/pandora_console/
api_pass pandora
api_user admin
apipandorapass 1234

Rename
venger TO esx_venger
SSD100GB TO disk_store_1

Reject
gridNode
Vm_apx
Vm_acr
Sobre la monitorización:
Entity scan
Debido al tamaño de las infraestructuras de VMware® del cliente empresarial, un análisis general de todas las entidades disponibles en cada ejecución podría desencadenar problemas de rendimiento.
Para evitar esta situación, el complemento de monitoreo de VMware tiene el archivo de entidad ( entities_list)donde almacena la lista de entidades escaneadas en la primera ejecución).
Mientras exista este fichero, el seguimiento se limitará a las entidades indicadas en el mismo.
Configuración de la monitorización
Las siguientes secciones del fichero configuran los módulos creados para cada tipo de entidad. Estas secciones utilizan las secciones Datacenter, Datastore, ESX y VM. En estas secciones se pueden habilitar y deshabilitar los módulos a monitorizar. El siguiente ejemplo contiene una configuración según los módulos que se crearían para ESX y máquinas virtuales.
 ...
 #ESX Modules
 ESX
 cpuUsagePercent disabled
 diskRead enabled
 diskWrite enabled

 #VM Modules
 VM
 diskReadLatency disabled
 diskWriteLatency disabled
 diskRate enabled
 ...
Cada línea de configuración es un módulo. Aunque en el ejemplo anterior, todos los módulos se crean con valores por defecto. Puede configurar los siguientes valores: 'Nombre', 'descripción' y 'límites' para los estados 'advertencia' y 'crítico'. Un ejemplo de este tipo de configuración sería como el siguiente:
 ...
 #VM Modules
 VM
 diskReadLatency disabled
 diskWriteLatency disabled
 diskRate name = Disk Rate; desc = Lec Rate/Esc disk; limits_warn = 5 10; limits_crit = 0 4
 ...
Las opciones disponibles para la configuración del módulo son estas:
<módulo> disabled: El módulo NO se creará
<módulo> enabled: El módulo SÍ se creará (con valores por defecto)
<module> name = <name>; desc = <description>; limits_warn <lim_warn>; limits_crit <lim_crit>"
Algunos módulos cuando se habilitan en el plugin pueden generar múltiples módulos dentro de sus agentes. Para esos casos cuando se indica un nombre personalizado para el módulo se puede utilizar la cadena "%s" para que se sustituya por un identificador del elemento en cada caso. Estos módulos y sus identificadores son:
- ESX:
- cpuInfo: Índice.
- pciDevice: Nombre del dispositivo.
- hbaDevice: Nombre del dispositivo.
- pnicInfo: Nombre del dispositivo.
- vnicInfo: Índice.
- systemHealthInfo: Tipo de sensor y nombre.
- disksState: Nombre del dispositivo.
- VM:
- diskUsed: Nombre del disco (si tiene) o índice.
- macAddress: Índice.
- ipAddress: Índice.
- snapshotDate: Nombre de la snapshot.
Ejemplo de uso
#VM Modules
VM
diskUsed name = Disk %s Used Percentage ; desc = Disk Used %; limits_warn = 80 90; limits_crit = 90 100
El módulo se creará con el nombre y la descripción dados. El módulo definirá umbrales para 'máximo' y 'mínimo' para los estados crítico y advertencia.
También es posible configurar cadenas de texto para los límites de los estados Advertencia y Crítico de los Módulos. La configuración sería parecida a la siguiente:
powerState name = Estado funcionamiento; desc = Estado funcionamiento VM; limits_warn = .*suspended.*; limits_crit = .*poweredOff.*Métricas de rendimiento personalizadas
Es posible configurar nuevos módulos relativos a Performance Counters para las máquinas virtuales y los ESX. Para configurar un nuevo módulo de rendimiento necesitará usar la siguiente estructura dentro de los bloques ESC o VM del fichero de configuración:
custom_performance type = mem; metric = swapinRate; module_type = generic_data; name = Swap In Rate; desc = Swap In Rate for host; limits_warn = 0 0; limits_crit = 0 0Los parámetros a configurar son:
-
type: Tipo de métrica a monitorizar. Los tipos de métrica son:
-
cpu: Característica de la Unidad Central de Procesamiento.
-
mem: Memoria.
-
disk: Disco, almacenamiento.
-
net: Red.
-
sys: Sistema.
-
-
metric: Métrica a monitorizar (más adelante se explica dónde ver las métricas disponibles).
-
module_type: Tipo del Módulo de Pandora FMS (por ejemplo: generic_data).
-
name: Nombre del Módulo.
-
desc: Descripción del Módulo.
-
limits_warn: Límites para el estado Advertencia.
-
limits_crit: Límites para el estado Crítico.
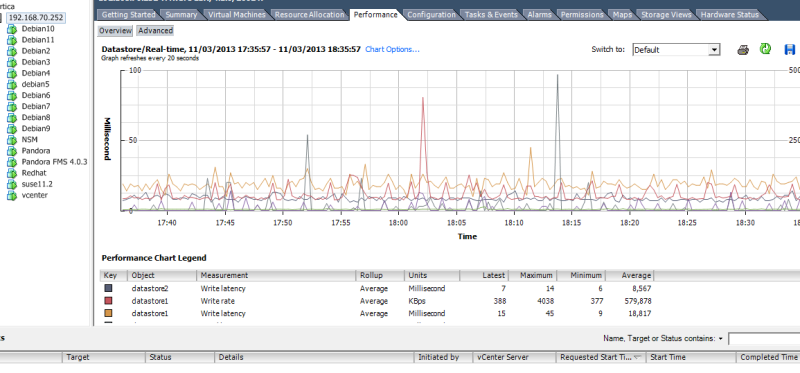
Podrá consultar las métricas disponibles para cada tipo en el apartado Performance de cada entidad. Esta vista se encuentra dentro del vCenter y muestra las métricas de rendimiento que es posible monitorizar con el plugin VMware®. Por ejemplo, la siguiente imagen muestra la vista de Performance para un host ESX.
Para ver el listado completo de todas las métricas según su tipo deberá hacer clic en el botón Advanced y luego en el botón Char option. Verá una lista con todos los tipos de métricas y las respectivas métricas de cada tipo:
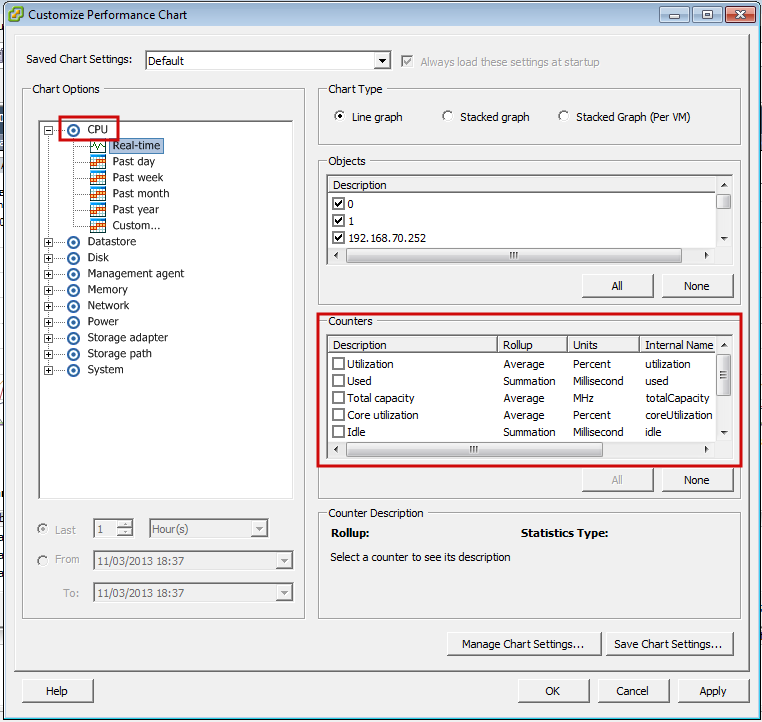
Para cada tipo de métrica aparecerán una serie de contadores que son las variables que podremos monitorizar con Pandora FMS. Para monitorizar una variable necesitamos su Internal Name. Además debe asegurarse de que el nivel de estadísticas, configurado en el vCenter, permite mostrar la variable que buscamos, comparándolo con el campo Collection Level de la métrica.
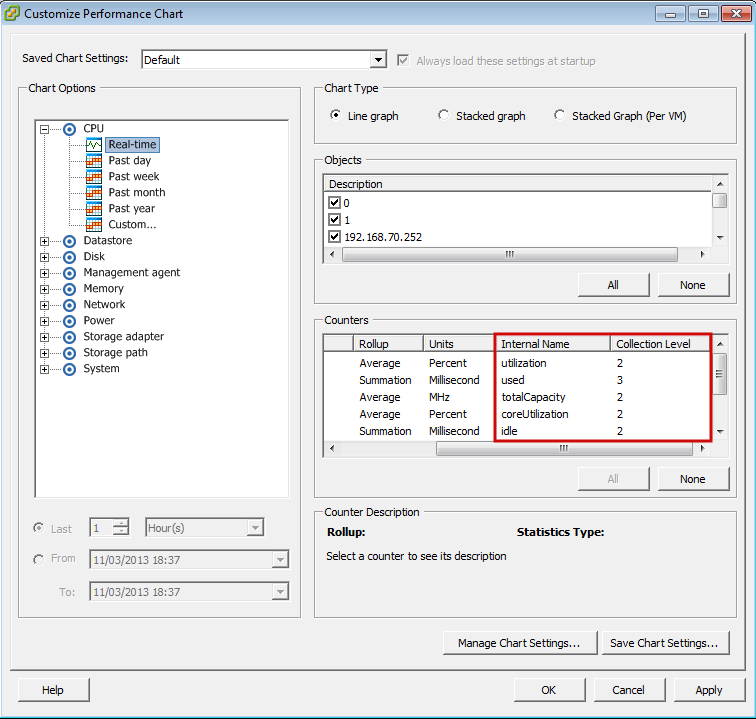
Por ejemplo, si necesita ver el uso de CPU de un host ESX, buscaremos las variables tipo cpu para un ESX y de las disponibles escogeremos utilization. La línea que tiene que añadir al archivo de configuración (en este caso dentro de la sección ESX) será la siguiente:
custom_performance type = cpu; metric = utilization; module_type = generic_data; name = CPU Utilization; desc = CPU Utilization for ESX; limits_warn = 0 0; limits_crit = 0 0Gestión y visualización de la arquitectura virtual VMware
Junto con el plugin VMware® se distribuyen dos extensiones: VMware Manager® y VMware View®. VMware View® permite visualizar todos los componentes de la arquitectura VMware® de una forma cómoda. Además, con VMware Manager® podrá gestionar máquinas virtuales parando, arrancando, reseteando o suspendiendo su actividad desde la Consola de Pandora FMS.
Usando VMware View
Para comenzar a usar el visor de arquitecturas VMware® vaya a Monitoring → VMware view.

De no tener ningún dispositivo a monitorizar o no haber configurado la API de los vCenter® y ESXi VMware® obtendrá algo parecido a la siguiente imagen:

Si el plugin se encuentra en estado operativo obtendrá este mensaje (haga clic en el botón Show):

La extensión VMware View® le mostrará un mapa similar al de abajo con toda la arquitectura VMware®.

El mapa contiene los elementos de la arquitectura VMware® (máquinas virtuales, ESX, DataStores y DataCenters) con diferentes iconos que los identifican, así como el estado de los Agentes de Pandora FMS que representan cada elemento. Además, se muestra la relación que existe entre máquinas virtuales, ESX y DataCenter. De esta manera, de un vistazo se puede ver el estado de la arquitectura VMware® de una forma sencilla.
Esta extensión tiene unas opciones que ayudan a mejorar la visualización de la arquitectura ocultando elementos, aumentando el tamaño de letra y permitiendo hacer acercamientos para poder ver los elementos con más detalle.

Usando las opciones anteriores puede mostrar solo los DataCenter y los ESX.

VMware View Dashboards
VMware View® aporta dos vistas adicionales además de la vista de mapa topológico de la arquitectura virtual. Las nuevas pestañas permiten cambiar entre las diferentes vistas de la VMware View®.

La primera vista es un dashboard general en el que podrá ver de un vistazo el estado general de la arquitectura virtual en números, es decir, cuántas máquinas virtuales, host ESXi o DataStores tienen problemas. Además podrá ver parámetros de rendimiento generales gracias a las gráficas que muestran las 5 máquinas virtuales que más memoria, CPU, disco y red consumen de toda la arquitectura virtual.

La segunda vista permite ver los parámetros de rendimiento de cada host ESX. En esta vista podrá escoger un host ESX para el que se cargará un cuadro de mando en el que se mostrará el estado del host y de las máquinas virtuales, así como unas métricas de rendimiento relativas al uso de CPU, memoria, disco y red del host ESXi. Además, esta vista también ofrece unas gráficas que muestran las máquinas virtuales que más recursos (CPU, memoria, disco y red) consumen del host seleccionado.

VMware View Options Tab
La extensión de VMWare se incluye junto con Pandora FMS Console Enterprise. Dispone de un panel de configuración para establecer las opciones de dashboards y mapas:
-
Podrá ajustar los umbrales de vista (mínimos - máximos) de las gráficas de los dashboard.
-
Podrá ajustar la configuración de la vista de mapa por defecto.
-
Contiene un enlace al sistema de gestión de configuraciones.
Accesible en la pestaña de opciones del VMWare View®:

Usando la extensión VMware Manager desde los Agentes
Para usar la extensión VMware® Manager debe ir a la vista de operación de un Agente que se corresponda con una máquina virtual en esa arquitectura. Dentro de esta vista podrá ver un icono con el símbolo de VMware® que corresponde a la extensión.
![]()
La extensión VMware® Manager permite gestionar máquinas virtuales desde la Consola de Pandora FMS. La extensión muestra el estado actual de la máquina virtual con un código de colores:
-
Verde = Encendida (máquina virtual en ejecución).
-
Naranja = Suspendida (máquina virtual cuya ejecución está pausada).
-
Gris = Detenida (máquina virtual no está en ejecución).
Además, en un combo muestra los estados disponibles y permite cambiar el estado de la máquina virtual al seleccionado, pulsando el botón Change Status.

Seleccionando el estado Stop y pulsando Change status:

Esto provacará que se detenga la ejecución de la máquina virtual y la vista de la extensión VMware Manage cambiará, mostrando así que la máquina virtual ahora está parada:

Si ha configurado la monitorización usando RENAME esta utilidad no funcionará contra los objetivos renombrados.
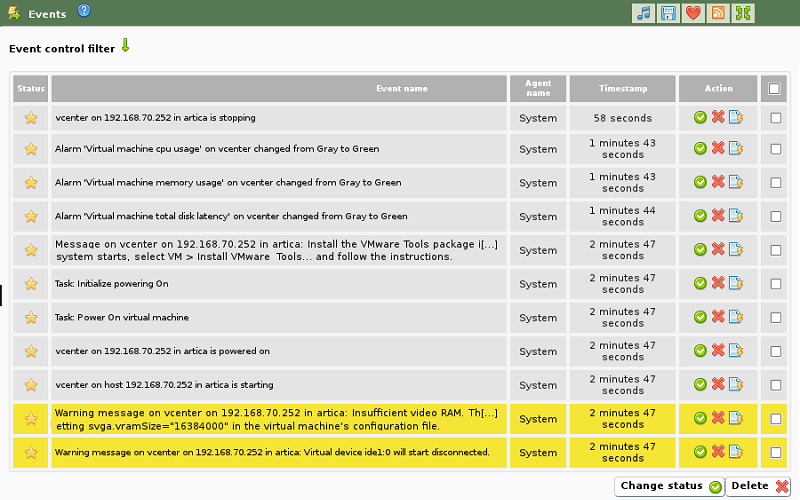
Monitorización de eventos
Esta funcionalidad realiza una copia de los eventos presentes en el vCenter de VMware® a la lista de eventos de Pandora FMS.
Estos eventos pasan a formar parte del flujo de eventos normales de Pandora FMS y quedan asociados de forma automática al Agente que representa el vCenter del que provienen (si el Agente existe en el momento de creación del evento).
En el proceso de volcado de eventos se respeta la información y severidad que VMware® indica en la creación del evento, de tal forma que los eventos con un nivel de severidad crítico, advertencia o informativo conservarán estos niveles en Pandora FMS. La siguiente imagen muestra un ejemplo de la información detallada de un evento volcado de VMware a Pandora FMS.
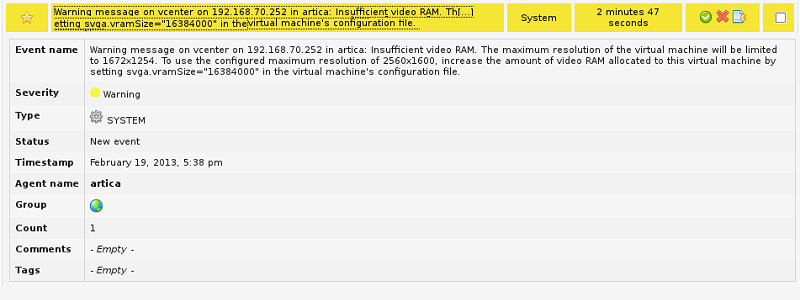
Con todos los eventos presentes en Pandora FMS podrá realizar todas las acciones disponibles para la gestión de eventos, como por ejemplo: creación de alertas, configuración de filtros, apertura de incidencias, etc.
Tabla de eventos
Esta lista de eventos se facilita para hacer más sencilla la tarea de configuración de alertas de eventos en Pandora FMS. Para obtener una referencia completa y actualizada de todos los posibles eventos deberá consultar la documentación que VMware® tenga al respecto
| Evento | Severidad | Tipo de evento |
|---|---|---|
| An account was created on host {host.name} | Informational | System |
| Account {account} was removed on host {host.name} | Informational | System |
| An account was updated on host {host.name} | Informational | System |
| The default password for the root user on the host {host.name} has not been changed | Informational | System |
| Alarm '{alarm.name}' on {entity.name} triggered an action | Informational | System |
| Created alarm '{alarm.name}' on {entity.name} | Informational | System |
| Alarm '{alarm.name}' on {entity.name} sent email to {to} | Informational | System |
| Alarm '{alarm.name}' on {entity.name} cannot send email to {to} | Critical | System |
| Reconfigured alarm '{alarm.name}' on {entity.name} | Informational | System |
| Removed alarm '{alarm.name}' on {entity.name} | Informational | System |
| Alarm '{alarm.name}' on {entity.name} ran script {script} | Informational | System |
| Alarm '{alarm.name}' on {entity.name} did not complete script: {reason.msg} | Critical | System |
| Alarm '{alarm.name}': an SNMP trap for entity {entity.name} was sent | Informational | System |
| Alarm '{alarm.name}' on entity {entity.name} did not send SNMP trap: {reason.msg} | Critical | System |
| Alarm '{alarm.name}' on {entity.name} changed from {from.@enum.ManagedEntity.Status} to {to.@enum.ManagedEntity.Status} | Informational | System |
| All running virtual machines are licensed | Informational | System |
| User cannot logon since the user is already logged on | Informational | System |
| Cannot login {userName}@{ipAddress} | Critical | System |
| The operation performed on host {host.name} in {datacenter.name} was canceled | Informational | System |
| Changed ownership of file name {filename} from {oldOwner} to {newOwner} on {host.name} in {datacenter.name}. | Informational | System |
| Cannot change ownership of file name {filename} from {owner} to {attemptedOwner} on {host.name} in {datacenter.name}. | Critical | System |
| Checked cluster for compliance | Informational | System |
| Created cluster {computeResource.name} in {datacenter.name} | Informational | System |
| Removed cluster {computeResource.name} in datacenter {datacenter.name} | Informational | System |
| Insufficient capacity in cluster {computeResource.name} to satisfy resource configuration in {datacenter.name} | Critical | System |
| Reconfigured cluster {computeResource.name} in datacenter {datacenter.name} | Informational | System |
| Configuration status on cluster {computeResource.name} changed from {oldStatus.@enum.ManagedEntity.Status} to {newStatus.@enum.ManagedEntity.Status} in {datacenter.name} | Informational | System |
| Created new custom field definition {name} | Informational | System |
| Removed field definition {name} | Informational | System |
| Renamed field definition from {name} to {newName} | Informational | System |
| Changed custom field {name} on {entity.name} in {datacenter.name} to {value} | Informational | System |
| Cannot complete customization of VM {vm.name}. See customization log at {logLocation} on the guest OS for details. | Informational | System |
| An error occurred while setting up Linux identity. See log file '{logLocation}' on guest OS for details. | Critical | System |
| An error occurred while setting up network properties of the guest OS. See the log file {logLocation} in the guest OS for details. | Critical | System |
| Started customization of VM {vm.name}. Customization log located at {logLocation} in the guest OS. | Informational | System |
| Customization of VM {vm.name} succeeded. Customization log located at {logLocation} in the guest OS. | Informational | System |
| The version of Sysprep {sysprepVersion} provided for customizing VM {vm.name} does not match the version of guest OS {systemVersion}. See the log file {logLocation} in the guest OS for more information. | Critical | System |
| An error occurred while customizing VM {vm.name}. For details reference the log file {logLocation} in the guest OS. | Critical | System |
| dvPort group {net.name} in {datacenter.name} was added to switch {dvs.name}. | Informational | System |
| dvPort group {net.name} in {datacenter.name} was deleted. | Informational | System |
| Informational | System | |
| dvPort group {net.name} in {datacenter.name} was reconfigured. | Informational | System |
| dvPort group {oldName} in {datacenter.name} was renamed to {newName} | Informational | System |
| HA admission control disabled on cluster {computeResource.name} in {datacenter.name} | Informational | System |
| HA admission control enabled on cluster {computeResource.name} in {datacenter.name} | Informational | System |
| Re-established contact with a primary host in this HA cluster | Informational | System |
| Unable to contact a primary HA agent in cluster {computeResource.name} in {datacenter.name} | Critical | System |
| All hosts in the HA cluster {computeResource.name} in {datacenter.name} were isolated from the network. Check the network configuration for proper network redundancy in the management network. | Critical | System |
| HA disabled on cluster {computeResource.name} in {datacenter.name} | Informational | System |
| HA enabled on cluster {computeResource.name} in {datacenter.name} | Informational | System |
| A possible host failure has been detected by HA on {failedHost.name} in cluster {computeResource.name} in {datacenter.name} | Critical | System |
| Host {isolatedHost.name} has been isolated from cluster {computeResource.name} in {datacenter.name} | Warning | System |
| Created datacenter {datacenter.name} in folder {parent.name} | Informational | System |
| Renamed datacenter from {oldName} to {newName} | Informational | System |
| Datastore {datastore.name} increased in capacity from {oldCapacity} bytes to {newCapacity} bytes in {datacenter.name} | Informational | System |
| Removed unconfigured datastore {datastore.name} | Informational | System |
| Discovered datastore {datastore.name} on {host.name} in {datacenter.name} | Informational | System |
| Multiple datastores named {datastore} detected on host {host.name} in {datacenter.name} | Critical | System |
| <internal> | Informational | System |
| File or directory {sourceFile} copied from {sourceDatastore.name} to {datastore.name} as {targetFile} | Informational | System |
| File or directory {targetFile} deleted from {datastore.name} | Informational | System |
| File or directory {sourceFile} moved from {sourceDatastore.name} to {datastore.name} as {targetFile} | Informational | System |
| Reconfigured Storage I/O Control on datastore {datastore.name} | Informational | System |
| Configured datastore principal {datastorePrincipal} on host {host.name} in {datacenter.name} | Informational | System |
| Removed datastore {datastore.name} from {host.name} in {datacenter.name} | Informational | System |
| Renamed datastore from {oldName} to {newName} in {datacenter.name} | Informational | System |
| Renamed datastore from {oldName} to {newName} in {datacenter.name} | Informational | System |
| Disabled DRS on cluster {computeResource.name} in datacenter {datacenter.name} | Informational | System |
| Enabled DRS on {computeResource.name} with automation level {behavior} in {datacenter.name} | Informational | System |
| DRS put {host.name} into standby mode | Informational | System |
| DRS is putting {host.name} into standby mode | Informational | System |
| DRS cannot move {host.name} out of standby mode | Critical | System |
| DRS moved {host.name} out of standby mode | Informational | System |
| DRS is moving {host.name} out of standby mode | Informational | System |
| DRS invocation not completed | Critical | System |
| DRS has recovered from the failure | Informational | System |
| Unable to apply DRS resource settings on host {host.name} in {datacenter.name}. {reason.msg}. This can significantly reduce the effectiveness of DRS. | Critical | System |
| Resource configuration specification returns to synchronization from previous failure on host '{host.name}' in {datacenter.name} | Informational | System |
| {vm.name} on {host.name} in {datacenter.name} is now compliant with DRS VM-Host affinity rules | Informational | System |
| {vm.name} on {host.name} in {datacenter.name} is violating a DRS VM-Host affinity rule | Informational | System |
| DRS migrated {vm.name} from {sourceHost.name} to {host.name} in cluster {computeResource.name} in {datacenter.name} | Informational | System |
| DRS powered On {vm.name} on {host.name} in {datacenter.name} | Informational | System |
| Virtual machine {macAddress} on host {host.name} has a duplicate IP {duplicateIP} | Informational | System |
| A vNetwork Distributed Switch {dvs.name} was created in {datacenter.name}. | Informational | System |
| vNetwork Distributed Switch {dvs.name} in {datacenter.name} was deleted. | Informational | System |
| vNetwork Distributed Switch event | Informational | System |
| The vNetwork Distributed Switch {dvs.name} configuration on the host was synchronized with that of the vCenter Server. | Informational | System |
| The host {hostJoined.name} joined the vNetwork Distributed Switch {dvs.name} in {datacenter.name}. | Informational | System |
| The host {hostLeft.name} left the vNetwork Distributed Switch {dvs.name} in {datacenter.name}. | Informational | System |
| The host {hostMember.name} changed status on the vNetwork Distributed Switch {dvs.name} in {datacenter.name}. | Informational | System |
| The vNetwork Distributed Switch {dvs.name} configuration on the host differed from that of the vCenter Server. | Warning | System |
| vNetwork Distributed Switch {srcDvs.name} was merged into {dstDvs.name} in {datacenter.name}. | Informational | System |
| dvPort {portKey} was blocked in the vNetwork Distributed Switch {dvs.name} in {datacenter.name}. | Informational | System |
| The port {portKey} was connected in the vNetwork Distributed Switch {dvs.name} in {datacenter.name} | Informational | System |
| New ports were created in the vNetwork Distributed Switch {dvs.name} in {datacenter.name}. | Informational | System |
| Deleted ports in the vNetwork Distributed Switch {dvs.name} in {datacenter.name}. | Informational | System |
| The dvPort {portKey} was disconnected in the vNetwork Distributed Switch {dvs.name} in {datacenter.name}. | Informational | System |
| dvPort {portKey} entered passthrough mode in the vNetwork Distributed Switch {dvs.name} in {datacenter.name}. | Informational | System |
| dvPort {portKey} exited passthrough mode in the vNetwork Distributed Switch {dvs.name} in {datacenter.name}. | Informational | System |
| dvPort {portKey} was moved into the dvPort group {portgroupName} in {datacenter.name}. | Informational | System |
| dvPort {portKey} was moved out of the dvPort group {portgroupName} in {datacenter.name}. | Informational | System |
| The port {portKey} link was down in the vNetwork Distributed Switch {dvs.name} in {datacenter.name} | Informational | System |
| The port {portKey} link was up in the vNetwork Distributed Switch {dvs.name} in {datacenter.name} | Informational | System |
| Reconfigured ports in the vNetwork Distributed Switch {dvs.name} in {datacenter.name}. | Informational | System |
| dvPort {portKey} was unblocked in the vNetwork Distributed Switch {dvs.name} in {datacenter.name}. | Informational | System |
| The vNetwork Distributed Switch {dvs.name} in {datacenter.name} was reconfigured. | Informational | System |
| The vNetwork Distributed Switch {oldName} in {datacenter.name} was renamed to {newName}. | Informational | System |
| An upgrade for the vNetwork Distributed Switch {dvs.name} in datacenter {datacenter.name} is available. | Informational | System |
| An upgrade for the vNetwork Distributed Switch {dvs.name} in datacenter {datacenter.name} is in progress. | Informational | System |
| Cannot complete an upgrade for the vNetwork Distributed Switch {dvs.name} in datacenter {datacenter.name} | Informational | System |
| vNetwork Distributed Switch {dvs.name} in datacenter {datacenter.name} was upgraded. | Informational | System |
| Host {host.name} in {datacenter.name} has entered maintenance mode | Informational | System |
| The host {host.name} is in standby mode | Informational | System |
| Host {host.name} in {datacenter.name} has started to enter maintenance mode | Informational | System |
| The host {host.name} is entering standby mode | Informational | System |
| {message} | Critical | System |
| Host {host.name} in {datacenter.name} has exited maintenance mode | Informational | System |
| The host {host.name} could not exit standby mode | Critical | System |
| The host {host.name} is no longer in standby mode | Informational | System |
| The host {host.name} is exiting standby mode | Informational | System |
| Sufficient resources are available to satisfy HA failover level in cluster {computeResource.name} in {datacenter.name} | Informational | System |
| General event: {message} | Informational | System |
| Error detected on {host.name} in {datacenter.name}: {message} | Critical | System |
| Issue detected on {host.name} in {datacenter.name}: {message} | Informational | System |
| Issue detected on {host.name} in {datacenter.name}: {message} | Warning | System |
| User logged event: {message} | Informational | System |
| Error detected for {vm.name} on {host.name} in {datacenter.name}: {message} | Critical | System |
| Issue detected for {vm.name} on {host.name} in {datacenter.name}: {message} | Informational | System |
| Issue detected for {vm.name} on {host.name} in {datacenter.name}: {message} | Warning | System |
| The vNetwork Distributed Switch corresponding to the proxy switches {switchUuid} on the host {host.name} does not exist in vCenter Server or does not contain this host. | Informational | System |
| A ghost proxy switch {switchUuid} on the host {host.name} was resolved. | Informational | System |
| The message changed: {message} | Informational | System |
| {componentName} status changed from {oldStatus} to {newStatus} | Informational | System |
| Cannot add host {hostname} to datacenter {datacenter.name} | Critical | System |
| Added host {host.name} to datacenter {datacenter.name} | Informational | System |
| Administrator access to the host {host.name} is disabled | Warning | System |
| Administrator access to the host {host.name} has been restored | Warning | System |
| Cannot connect {host.name} in {datacenter.name}: cannot configure management account | Critical | System |
| Cannot connect {host.name} in {datacenter.name}: already managed by {serverName} | Critical | System |
| Cannot connect host {host.name} in {datacenter.name} : server agent is not responding | Critical | System |
| Cannot connect {host.name} in {datacenter.name}: incorrect user name or password | Critical | System |
| Cannot connect {host.name} in {datacenter.name}: incompatible version | Critical | System |
| Cannot connect host {host.name} in {datacenter.name}. Did not install or upgrade vCenter agent service. | Critical | System |
| Cannot connect {host.name} in {datacenter.name}: error connecting to host | Critical | System |
| Cannot connect {host.name} in {datacenter.name}: network error | Critical | System |
| Cannot connect host {host.name} in {datacenter.name}: account has insufficient privileges | Critical | System |
| Cannot connect host {host.name} in {datacenter.name} | Critical | System |
| Cannot connect {host.name} in {datacenter.name}: not enough CPU licenses | Critical | System |
| Cannot connect {host.name} in {datacenter.name}: incorrect host name | Critical | System |
| Cannot connect {host.name} in {datacenter.name}: time-out waiting for host response | Critical | System |
| Host {host.name} checked for compliance. | Informational | System |
| Host {host.name} is in compliance with the attached profile | Informational | System |
| Host configuration changes applied. | Informational | System |
| Connected to {host.name} in {datacenter.name} | Informational | System |
| Host {host.name} in {datacenter.name} is not responding | Critical | System |
| dvPort connected to host {host.name} in {datacenter.name} changed status | Informational | System |
| HA agent disabled on {host.name} in cluster {computeResource.name} in {datacenter.name} | Informational | System |
| HA is being disabled on {host.name} in cluster {computeResource.name} in datacenter {datacenter.name} | Informational | System |
| HA agent enabled on {host.name} in cluster {computeResource.name} in {datacenter.name} | Informational | System |
| Enabling HA agent on {host.name} in cluster {computeResource.name} in {datacenter.name} | Warning | System |
| HA agent on {host.name} in cluster {computeResource.name} in {datacenter.name} has an error {message}: {reason.@enum.HostDasErrorEvent.HostDasErrorReason} | Critical | System |
| HA agent on host {host.name} in cluster {computeResource.name} in {datacenter.name} is configured correctly | Informational | System |
| Disconnected from {host.name} in {datacenter.name}. Reason: {reason.@enum.HostDisconnectedEvent.ReasonCode} | Informational | System |
| Cannot restore some administrator permissions to the host {host.name} | Critical | System |
| Host {host.name} has the following extra networks not used by other hosts for HA communication:{ips}. Consider using HA advanced option das.allowNetwork to control network usage | Critical | System |
| Cannot complete command 'hostname -s' on host {host.name} or returned incorrect name format | Critical | System |
| Maximum ({capacity}) number of hosts allowed for this edition of vCenter Server has been reached | Critical | System |
| The virtual machine inventory file on host {host.name} is damaged or unreadable. | Informational | System |
| IP address of the host {host.name} changed from {oldIP} to {newIP} | Informational | System |
| Configuration of host IP address is inconsistent on host {host.name}: address resolved to {ipAddress} and {ipAddress2} | Critical | System |
| Cannot resolve IP address to short name on host {host.name} | Critical | System |
| Host {host.name} could not reach isolation address: {isolationIp} | Critical | System |
| A host license for {host.name} has expired | Critical | System |
| Host {host.name} does not have the following networks used by other hosts for HA communication:{ips}. Consider using HA advanced option das.allowNetwork to control network usage | Critical | System |
| Host monitoring state in {computeResource.name} in {datacenter.name} changed to {state.@enum.DasConfigInfo.ServiceState} | Informational | System |
| Host {host.name} currently has no available networks for HA Communication. The following networks are currently used by HA: {ips} | Critical | System |
| Host {host.name} has no port groups enabled for HA communication. | Critical | System |
| Host {host.name} currently has no management network redundancy | Critical | System |
| Host {host.name} is not in compliance with the attached profile | Critical | System |
| Host {host.name} is not a cluster member in {datacenter.name} | Critical | System |
| Insufficient capacity in host {computeResource.name} to satisfy resource configuration in {datacenter.name} | Critical | System |
| Primary agent {primaryAgent} was not specified as a short name to host {host.name} | Critical | System |
| Profile is applied on the host {host.name} | Informational | System |
| Cannot reconnect to {host.name} in {datacenter.name} | Critical | System |
| Removed host {host.name} in {datacenter.name} | Informational | System |
| Host names {shortName} and {shortName2} both resolved to the same IP address. Check the host's network configuration and DNS entries | Critical | System |
| Cannot resolve short name {shortName} to IP address on host {host.name} | Critical | System |
| Shut down of {host.name} in {datacenter.name}: {reason} | Informational | System |
| Configuration status on host {computeResource.name} changed from {oldStatus.@enum.ManagedEntity.Status} to {newStatus.@enum.ManagedEntity.Status} in {datacenter.name} | Informational | System |
| Cannot synchronize host {host.name}. {reason.msg} | Critical | System |
| Cannot install or upgrade vCenter agent service on {host.name} in {datacenter.name} | Critical | System |
| The userworld swap is not enabled on the host {host.name} | Warning | System |
| Host {host.name} vNIC {vnic.vnic} was reconfigured to use dvPort {vnic.port.portKey} with port level configuration, which might be different from the dvPort group. | Informational | System |
| WWNs are changed for {host.name} | Warning | System |
| The WWN ({wwn}) of {host.name} conflicts with the currently registered WWN | Critical | System |
| Host {host.name} did not provide the information needed to acquire the correct set of licenses | Critical | System |
| {message} | Informational | System |
| Insufficient resources to satisfy HA failover level on cluster {computeResource.name} in {datacenter.name} | Critical | System |
| The license edition '{feature}' is invalid | Critical | System |
| License {feature.featureName} has expired | Critical | System |
| License inventory is not compliant. Licenses are overused | Critical | System |
| Unable to acquire licenses due to a restriction in the option file on the license server. | Critical | System |
| License server {licenseServer} is available | Informational | System |
| License server {licenseServer} is unavailable | Critical | System |
| Created local datastore {datastore.name} on {host.name} in {datacenter.name} | Informational | System |
| The Local Tech Support Mode for the host {host.name} has been enabled | Informational | System |
| Datastore {datastore} which is configured to back the locker does not exist | Warning | System |
| Locker was reconfigured from {oldDatastore} to {newDatastore} datastore | Informational | System |
| Unable to migrate {vm.name} from {host.name} in {datacenter.name}: {fault.msg} | Critical | System |
| Unable to migrate {vm.name} from {host.name} to {dstHost.name} in {datacenter.name}: {fault.msg} | Critical | System |
| Migration of {vm.name} from {host.name} to {dstHost.name} in {datacenter.name}: {fault.msg} | Warning | System |
| Cannot migrate {vm.name} from {host.name} to {dstHost.name} and resource pool {dstPool.name} in {datacenter.name}: {fault.msg} | Critical | System |
| Migration of {vm.name} from {host.name} to {dstHost.name} and resource pool {dstPool.name} in {datacenter.name}: {fault.msg} | Warning | System |
| Migration of {vm.name} from {host.name} in {datacenter.name}: {fault.msg} | Warning | System |
| Created NAS datastore {datastore.name} on {host.name} in {datacenter.name} | Informational | System |
| Cannot login user {userName}@{ipAddress}: no permission | Critical | System |
| No datastores have been configured on the host {host.name} | Informational | System |
| A required license {feature.featureName} is not reserved | Critical | System |
| Unable to automatically migrate {vm.name} from {host.name} | Informational | System |
| Non-VI workload detected on datastore {datastore.name} | Critical | System |
| Not enough resources to failover {vm.name} in {computeResource.name} in {datacenter.name} | Informational | System |
| The vNetwork Distributed Switch configuration on some hosts differed from that of the vCenter Server. | Warning | System |
| Permission created for {principal} on {entity.name}, role is {role.name}, propagation is {propagate.@enum.auth.Permission.propagate} | Informational | System |
| Permission rule removed for {principal} on {entity.name} | Informational | System |
| Permission changed for {principal} on {entity.name}, role is {role.name}, propagation is {propagate.@enum.auth.Permission.propagate} | Informational | System |
| Profile {profile.name} attached. | Informational | System |
| Profile {profile.name} was changed. | Informational | System |
| Profile is created. | Informational | System |
| Profile {profile.name} detached. | Informational | System |
| Profile {profile.name} reference host changed. | Informational | System |
| Profile was removed. | Informational | System |
| Remote Tech Support Mode (SSH) for the host {host.name} has been enabled | Informational | System |
| Created resource pool {resourcePool.name} in compute-resource {computeResource.name} in {datacenter.name} | Informational | System |
| Removed resource pool {resourcePool.name} on {computeResource.name} in {datacenter.name} | Informational | System |
| Moved resource pool {resourcePool.name} from {oldParent.name} to {newParent.name} on {computeResource.name} in {datacenter.name} | Informational | System |
| Updated configuration for {resourcePool.name} in compute-resource {computeResource.name} in {datacenter.name} | Informational | System |
| Resource usage exceeds configuration for resource pool {resourcePool.name} in compute-resource {computeResource.name} in {datacenter.name} | Critical | System |
| New role {role.name} created | Informational | System |
| Role {role.name} removed | Informational | System |
| Modifed role {role.name} | Informational | System |
| Task {scheduledTask.name} on {entity.name} in {datacenter.name} completed successfully | Informational | System |
| Created task {scheduledTask.name} on {entity.name} in {datacenter.name} | Informational | System |
| Task {scheduledTask.name} on {entity.name} in {datacenter.name} sent email to {to} | Informational | System |
| Task {scheduledTask.name} on {entity.name} in {datacenter.name} cannot send email to {to}: {reason.msg} | Critical | System |
| Task {scheduledTask.name} on {entity.name} in {datacenter.name} cannot be completed: {reason.msg} | Critical | System |
| Reconfigured task {scheduledTask.name} on {entity.name} in {datacenter.name} | Informational | System |
| Removed task {scheduledTask.name} on {entity.name} in {datacenter.name} | Informational | System |
| Running task {scheduledTask.name} on {entity.name} in {datacenter.name} | Informational | System |
| A vCenter Server license has expired | Critical | System |
| vCenter started | Informational | System |
| A session for user '{terminatedUsername}' has stopped | Informational | System |
| Task: {info.descriptionId} | Informational | System |
| Task: {info.descriptionId} time-out | Informational | System |
| Upgrading template {legacyTemplate} | Informational | System |
| Cannot upgrade template {legacyTemplate} due to: {reason.msg} | Informational | System |
| Template {legacyTemplate} upgrade completed | Informational | System |
| The operation performed on {host.name} in {datacenter.name} timed out | Warning | System |
| There are {unlicensed} unlicensed virtual machines on host {host} - there are only {available} licenses available | Informational | System |
| {unlicensed} unlicensed virtual machines found on host {host} | Informational | System |
| The agent on host {host.name} is updated and will soon restart | Informational | System |
| User {userLogin} was added to group {group} | Informational | System |
| User {userName}@{ipAddress} logged in | Informational | System |
| User {userName} logged out | Informational | System |
| Password was changed for account {userLogin} on host {host.name} | Informational | System |
| User {userLogin} removed from group {group} | Informational | System |
| {message} | Informational | System |
| Created VMFS datastore {datastore.name} on {host.name} in {datacenter.name} | Informational | System |
| Expanded VMFS datastore {datastore.name} on {host.name} in {datacenter.name} | Informational | System |
| Extended VMFS datastore {datastore.name} on {host.name} in {datacenter.name} | Informational | System |
| A vMotion license for {host.name} has expired | Critical | System |
| Cannot uninstall vCenter agent from {host.name} in {datacenter.name}. {reason.@enum.fault.AgentInstallFailed.Reason} | Critical | System |
| vCenter agent has been uninstalled from {host.name} in {datacenter.name} | Informational | System |
| Cannot upgrade vCenter agent on {host.name} in {datacenter.name}. {reason.@enum.fault.AgentInstallFailed.Reason} | Critical | System |
| vCenter agent has been upgraded on {host.name} in {datacenter.name} | Informational | System |
| VIM account password was changed on host {host.name} | Informational | System |
| Remote console to {vm.name} on {host.name} in {datacenter.name} has been opened | Informational | System |
| A ticket for {vm.name} of type {ticketType} on {host.name} in {datacenter.name} has been acquired | Informational | System |
| Invalid name for {vm.name} on {host.name} in {datacenter.name}. Renamed from {oldName} to {newName} | Informational | System |
| Cloning {vm.name} on host {host.name} in {datacenter.name} to {destName} on host {destHost.name} | Informational | System |
| Cloning {vm.name} on host {host.name} in {datacenter.name} to {destName} on host {destHost.name} | Informational | System |
| Creating {vm.name} on host {host.name} in {datacenter.name} | Informational | System |
| Deploying {vm.name} on host {host.name} in {datacenter.name} from template {srcTemplate.name} | Informational | System |
| Migrating {vm.name} from {host.name} to {destHost.name} in {datacenter.name} | Informational | System |
| Relocating {vm.name} from {host.name} to {destHost.name} in {datacenter.name} | Informational | System |
| Relocating {vm.name} in {datacenter.name} from {host.name} to {destHost.name} | Informational | System |
| Cannot clone {vm.name}: {reason.msg} | Critical | System |
| Clone of {sourceVm.name} completed | Informational | System |
| Configuration file for {vm.name} on {host.name} in {datacenter.name} cannot be found | Informational | System |
| Virtual machine {vm.name} is connected | Informational | System |
| Created virtual machine {vm.name} on {host.name} in {datacenter.name} | Informational | System |
| dvPort connected to VM {vm.name} on {host.name} in {datacenter.name} changed status | Informational | System |
| {vm.name} on {host.name} in cluster {computeResource.name} in {datacenter.name} reset by HA. Reason: {reason.@enum.VmDasBeingResetEvent.ReasonCode} | Informational | System |
| {vm.name} on {host.name} in cluster {computeResource.name} in {datacenter.name} reset by HA. Reason: {reason.@enum.VmDasBeingResetEvent.ReasonCode}. A screenshot is saved at {screenshotFilePath}. | Informational | System |
| Cannot reset {vm.name} on {host.name} in cluster {computeResource.name} in {datacenter.name} | Warning | System |
| Unable to update HA agents given the state of {vm.name} | Critical | System |
| HA agents have been updated with the current state of the virtual machine | Informational | System |
| Disconnecting all hosts as the date of virtual machine {vm.name} has been rolled back | Critical | System |
| Cannot deploy template: {reason.msg} | Critical | System |
| Template {srcTemplate.name} deployed on host {host.name} | Informational | System |
| {vm.name} on host {host.name} in {datacenter.name} is disconnected | Informational | System |
| Discovered {vm.name} on {host.name} in {datacenter.name} | Informational | System |
| Cannot create virtual disk {disk} | Critical | System |
| Migrating {vm.name} off host {host.name} in {datacenter.name} | Informational | System |
| End a recording session on {vm.name} | Informational | System |
| End a replay session on {vm.name} | Informational | System |
| Cannot migrate {vm.name} from {host.name} to {destHost.name} in {datacenter.name} | Critical | System |
| Cannot complete relayout {vm.name} on {host.name} in {datacenter.name}: {reason.msg} | Critical | System |
| Cannot complete relayout for virtual machine {vm.name} which has disks on a VMFS2 volume. | Critical | System |
| vCenter cannot start the Secondary VM {vm.name}. Reason: {reason.@enum.VmFailedStartingSecondaryEvent.FailureReason} | Critical | System |
| Cannot power Off {vm.name} on {host.name} in {datacenter.name}: {reason.msg} | Critical | System |
| Cannot power On {vm.name} on {host.name} in {datacenter.name}. {reason.msg} | Critical | System |
| Cannot reboot the guest OS for {vm.name} on {host.name} in {datacenter.name}. {reason.msg} | Critical | System |
| Cannot suspend {vm.name} on {host.name} in {datacenter.name}: {reason.msg} | Critical | System |
| {vm.name} cannot shut down the guest OS on {host.name} in {datacenter.name}: {reason.msg} | Critical | System |
| {vm.name} cannot standby the guest OS on {host.name} in {datacenter.name}: {reason.msg} | Critical | System |
| Cannot suspend {vm.name} on {host.name} in {datacenter.name}: {reason.msg} | Critical | System |
| vCenter cannot update the Secondary VM {vm.name} configuration | Critical | System |
| Failover unsuccessful for {vm.name} on {host.name} in cluster {computeResource.name} in {datacenter.name}. Reason: {reason.msg} | Warning | System |
| Fault Tolerance state on {vm.name} changed from {oldState.@enum.VirtualMachine.FaultToleranceState} to {newState.@enum.VirtualMachine.FaultToleranceState} | Informational | System |
| Fault Tolerance protection has been turned off for {vm.name} | Informational | System |
| The Fault Tolerance VM ({vm.name}) has been terminated. {reason.@enum.VmFaultToleranceVmTerminatedEvent.TerminateReason} | Informational | System |
| Guest OS reboot for {vm.name} on {host.name} in {datacenter.name} | Informational | System |
| Guest OS shut down for {vm.name} on {host.name} in {datacenter.name} | Informational | System |
| Guest OS standby for {vm.name} on {host.name} in {datacenter.name} | Informational | System |
| VM monitoring state in {computeResource.name} in {datacenter.name} changed to {state.@enum.DasConfigInfo.VmMonitoringState} | Informational | System |
| Assign a new instance UUID ({instanceUuid}) to {vm.name} | Informational | System |
| The instance UUID of {vm.name} has been changed from ({oldInstanceUuid}) to ({newInstanceUuid}) | Informational | System |
| The instance UUID ({instanceUuid}) of {vm.name} conflicts with the instance UUID assigned to {conflictedVm.name} | Critical | System |
| New MAC address ({mac}) assigned to adapter {adapter} for {vm.name} | Informational | System |
| Changed MAC address from {oldMac} to {newMac} for adapter {adapter} for {vm.name} | Warning | System |
| The MAC address ({mac}) of {vm.name} conflicts with MAC assigned to {conflictedVm.name} | Critical | System |
| Reached maximum Secondary VM (with FT turned On) restart count for {vm.name} on {host.name} in cluster {computeResource.name} in {datacenter.name}. | Warning | System |
| Reached maximum VM restart count for {vm.name} on {host.name} in cluster {computeResource.name} in {datacenter.name}. | Warning | System |
| Error message on {vm.name} on {host.name} in {datacenter.name}: {message} | Critical | System |
| Message on {vm.name} on {host.name} in {datacenter.name}: {message} | Informational | System |
| Warning message on {vm.name} on {host.name} in {datacenter.name}: {message} | Warning | System |
| Migration of virtual machine {vm.name} from {sourceHost.name} to {host.name} completed | Informational | System |
| No compatible host for the Secondary VM {vm.name} | Critical | System |
| Not all networks for {vm.name} are accessible by {destHost.name} | Warning | System |
| {vm.name} does not exist on {host.name} in {datacenter.name} | Warning | System |
| {vm.name} was powered Off on the isolated host {isolatedHost.name} in cluster {computeResource.name} in {datacenter.name} | Informational | System |
| {vm.name} on {host.name} in {datacenter.name} is powered off | Informational | System |
| {vm.name} on {host.name} in {datacenter.name} is powered on | Informational | System |
| Virtual machine {vm.name} powered On with vNICs connected to dvPorts that have a port level configuration, which might be different from the dvPort group configuration. | Informational | System |
| VM ({vm.name}) failed over to {host.name}. {reason.@enum.VirtualMachine.NeedSecondaryReason} | Critical | System |
| Reconfigured {vm.name} on {host.name} in {datacenter.name} | Informational | System |
| Registered {vm.name} on {host.name} in {datacenter.name} | Informational | System |
| Relayout of {vm.name} on {host.name} in {datacenter.name} completed | Informational | System |
| {vm.name} on {host.name} in {datacenter.name} is in the correct format and relayout is not necessary | Informational | System |
| {vm.name} on {host.name} reloaded from new configuration {configPath}. | Informational | System |
| {vm.name} on {host.name} could not be reloaded from {configPath}. | Critical | System |
| Cannot relocate virtual machine '{vm.name}' in {datacenter.name} | Critical | System |
| Completed the relocation of the virtual machine | Informational | System |
| Remote console connected to {vm.name} on host {host.name} | Informational | System |
| Remote console disconnected from {vm.name} on host {host.name} | Informational | System |
| Removed {vm.name} on {host.name} from {datacenter.name} | Informational | System |
| Renamed {vm.name} from {oldName} to {newName} in {datacenter.name} | Warning | System |
| {vm.name} on {host.name} in {datacenter.name} is reset | Informational | System |
| Moved {vm.name} from resource pool {oldParent.name} to {newParent.name} in {datacenter.name} | Informational | System |
| Changed resource allocation for {vm.name} | Informational | System |
| Virtual machine {vm.name} was restarted on {host.name} since {sourceHost.name} failed | Informational | System |
| {vm.name} on {host.name} in {datacenter.name} is resumed | Informational | System |
| A Secondary VM has been added for {vm.name} | Informational | System |
| vCenter disabled Fault Tolerance on VM '{vm.name}' because the Secondary VM could not be powered On. | Critical | System |
| Disabled Secondary VM for {vm.name} | Informational | System |
| Enabled Secondary VM for {vm.name} | Informational | System |
| Started Secondary VM for {vm.name} | Informational | System |
| {vm.name} was shut down on the isolated host {isolatedHost.name} in cluster {computeResource.name} in {datacenter.name}: {shutdownResult.@enum.VmShutdownOnIsolationEvent.Operation} | Informational | System |
| Start a recording session on {vm.name} | Informational | System |
| Start a replay session on {vm.name} | Informational | System |
| {vm.name} on host {host.name} in {datacenter.name} is starting | Informational | System |
| Starting Secondary VM for {vm.name} | Informational | System |
| The static MAC address ({mac}) of {vm.name} conflicts with MAC assigned to {conflictedVm.name} | Critical | System |
| {vm.name} on {host.name} in {datacenter.name} is stopping | Informational | System |
| {vm.name} on {host.name} in {datacenter.name} is suspended | Informational | System |
| {vm.name} on {host.name} in {datacenter.name} is being suspended | Informational | System |
| Starting the Secondary VM {vm.name} timed out within {timeout} ms | Critical | System |
| Unsupported guest OS {guestId} for {vm.name} on {host.name} in {datacenter.name} | Warning | System |
| Virtual hardware upgraded to version {version} | Informational | System |
| Cannot upgrade virtual hardware | Critical | System |
| Upgrading virtual hardware on {vm.name} in {datacenter.name} to version {version} | Informational | System |
| Assigned new BIOS UUID ({uuid}) to {vm.name} on {host.name} in {datacenter.name} | Informational | System |
| Changed BIOS UUID from {oldUuid} to {newUuid} for {vm.name} on {host.name} in {datacenter.name} | Warning | System |
| BIOS ID ({uuid}) of {vm.name} conflicts with that of {conflictedVm.name} | Critical | System |
| New WWNs assigned to {vm.name} | Informational | System |
| WWNs are changed for {vm.name} | Warning | System |
| The WWN ({wwn}) of {vm.name} conflicts with the currently registered WWN | Critical | System |
| {message} | Warning | System |
| Booting from iSCSI failed with an error. See the VMware Knowledge Base for information on configuring iBFT networking. | Warning | System |
| License {licenseKey} added to VirtualCenter | Informational | System |
| License {licenseKey} assigned to asset {entityName} with id {entityId} | Informational | System |
| Failed to download license information from the host {hostname} due to {errorReason.@enum.com.vmware.license.DLFDownloadFailedEvent.DLFDownloadFailedReason} | Warning | System |
| License assignment on the host fails. Reasons: {errorMessage.@enum.com.vmware.license.LicenseAssignError}. | Informational | System |
| Your host license will expire in {remainingDays} days. The host will be disconnected from VC when its license expires. | Warning | System |
| Current license usage ({currentUsage} {costUnitText}) for {edition} exceeded the user-defined threshold ({threshold} {costUnitText}) | Warning | System |
| License {licenseKey} removed from VirtualCenter | Informational | System |
| License unassigned from asset {entityName} with id {entityId} | Informational | System |
| HA completed a failover action in cluster {computeResource.name} in datacenter {datacenter.name} | Informational | System |
| HA initiated a failover action in cluster {computeResource.name} in datacenter {datacenter.name} | Warning | System |
| HA Agent on host {host.name} in cluster {computeResource.name} in datacenter {datacenter.name} is running | Informational | System |
| HA failover host {host.name} in cluster {computeResource.name} in {datacenter.name} has failed | Critical | System |
| All shared datastores failed on the host {hostName} in cluster {computeResource.name} in {datacenter.name} | Critical | System |
| All VM networks failed on the host {hostName} in cluster {computeResource.name} in {datacenter.name} | Critical | System |
| A possible host failure has been detected by HA on host {host.name} in cluster {computeResource.name} in datacenter {datacenter.name} | Critical | System |
| No virtual machine failover will occur until Host Monitoring is enabled in cluster {computeResource.name} in {datacenter.name} | Warning | System |
| HA recovered from a total cluster failure in cluster {computeResource.name} in datacenter {datacenter.name} | Warning | System |
| HA Agent on host {host.name} in cluster {computeResource.name} in datacenter {datacenter.name} is healthy | Informational | System |
| HA agent on {host.name} in cluster {computeResource.name} in {datacenter.name} has an error: {reason.@enum.HostDasErrorEvent.HostDasErrorReason} | Critical | System |
| vCenter Service overall health changed from '{oldState}' to '{newState}' | Informational | System |
| Health of [data.group] changed from [data.oldState] to [data.newState]. | Informational | System |
| Failed to update VM files on datastore {ds.name} using host {hostName} | Critical | System |
| Updated VM files on datastore {ds.name} using host {hostName} | Informational | System |
| Updating VM files on datastore {ds.name} using host {hostName} | Informational | System |
| VMware HA has been disabled in cluster {computeResource.name} of datacenter {datacenter.name}. HA will not restart VM {vm.name} or its Secondary VM after a failure. | Warning | System |
| Network passthrough is active on adapter {deviceLabel} of virtual machine {vm.name} on host {host.name} in {datacenter.name} | Informational | System |
| Network passthrough is inactive on adapter {deviceLabel} of virtual machine {vm.name} on host {host.name} in {datacenter.name} | Informational | System |
| HA VM Component Protection protects virtual machine {vm.name} on {host.name} in cluster {computeResource.name} in datacenter {datacenter.name} as non-FT virtual machine because the FT state is disabled | Informational | System |
| FT Primary VM {vm.name} on host {host.name} in cluster {computeResource.name} in datacenter {datacenter.name} is going to fail over to Secondary VM due to component failure | Informational | System |
| FT virtual machine {vm.name} on host {host.name} in cluster {computeResource.name} in datacenter {datacenter.name} failed to failover to secondary | Critical | System |
| HA VM Component Protection is restarting FT secondary virtual machine {vm.name} on host {host.name} in cluster {computeResource.name} in datacenter {datacenter.name} due to component failure | Informational | System |
| FT Secondary VM {vm.name} on host {host.name} in cluster {computeResource.name} in datacenter {datacenter.name} failed to restart | Critical | System |
| HA VM Component Protection protects virtual machine {vm.name} on host {host.name} in cluster {computeResource.name} in datacenter {datacenter.name} as non-FT virtual machine because it has been in the needSecondary state too long | Informational | System |
| VM Component Protection test ends on host {host.name} in cluster {computeResource.name} in datacenter {datacenter.name} | Informational | System |
| VM Component Protection test starts on host {host.name} in cluster {computeResource.name} in datacenter {datacenter.name} | Informational | System |
| HA VM Component Protection did not take action on virtual machine {vm.name} on host {host.name} in cluster {computeResource.name} in datacenter {datacenter.name} due to the feature configuration setting | Informational | System |
| Virtual machine {vm.name} on host {host.name} in cluster {computeResource.name} in datacenter {datacenter.name} lost access to {datastore} | Critical | System |
| Virtual machine {vm.name} on host {host.name} in cluster {computeResource.name} in datacenter {datacenter.name} lost access to {network} | Critical | System |
| HA VM Component Protection could not power off virtual machine {vm.name} on host {host.name} in cluster {computeResource.name} in datacenter {datacenter.name} successfully after trying {numTimes} times and will keep trying | Critical | System |
| HA VM Component Protection is restarting virtual machine {vm.name} due to component failure on host {host.name} in cluster {computeResource.name} in datacenter {datacenter.name} | Informational | System |
| Virtual machine {vm.name} affected by component failure on host {host.name} in cluster {computeResource.name} in datacenter {datacenter.name} failed to restart | Critical | System |
| HA VM Component Protection could not find a destination host for virtual machine {vm.name} on host {host.name} in cluster {computeResource.name} in datacenter {datacenter.name} after waiting {numSecWait} seconds and will keep trying | Critical | System |
| Application monitoring is not supported on {host.name} in cluster {computeResource.name} in {datacenter.name} | Warning | System |
| Application heartbeat status changed to {status} for {vm.name} on {host.name} in cluster {computeResource.name} in {datacenter.name} | Warning | System |
| Application heartbeat failed for {vm.name} on {host.name} in cluster {computeResource.name} in {datacenter.name} | Warning | System |
| Network connectivity restored on virtual switch {1}, portgroups: {2}. Physical NIC {3} is up. | Informational | System |
| Network connectivity restored on DVPorts: {1}. Physical NIC {2} is up. | Informational | System |
| Uplink redundancy restored on DVPorts: {1}. Physical NIC {2} is up. | Informational | System |
| Uplink redundancy restored on virtual switch {1}, portgroups: {2}. Physical NIC {3} is up. | Informational | System |
| Physical NIC {1} linkstate is up. | Informational | System |
| Connectivity to storage device {1} (Datastores: {2}) restored. Path {3} is active again. | Informational | System |
| Path redundancy to storage device {1} (Datastores: {2}) restored. Path {3} is active again. | Informational | System |
| A corrected memory error occurred in last boot. The following details were reported. Physical Addr: {1}, Physical Addr Mask: {2}, Node: {3}, Card: {4}, Module: {5}, Bank: {6}, Device: {7}, Row: {8}, Column: {9} Error type: {10} | Critical | System |
| A fatal memory error occurred in the last boot. The following details were reported. Physical Addr: {1}, Physical Addr Mask: {2}, Node: {3}, Card: {4}, Module: {5}, Bank: {6}, Device: {7}, Row: {8}, Column: {9} Error type: {10} | Critical | System |
| A recoverable memory error occurred in last boot. The following details were reported. Physical Addr: {1}, Physical Addr Mask: {2}, Node: {3}, Card: {4}, Module: {5}, Bank: {6}, Device: {7}, Row: {8}, Column: {9} Error type: {10} | Critical | System |
| A corrected PCIe error occurred in last boot. The following details were reported. Port Type: {1}, Device: {2}, Bus #: {3}, Function: {4}, Slot: {5}, Device Vendor: {6}, Version: {7}, Command Register: {8}, Status Register: {9}. | Critical | System |
| Platform encounterd a fatal PCIe error in last boot. The following details were reported. Port Type: {1}, Device: {2}, Bus #: {3}, Function: {4}, Slot: {5}, Device Vendor: {6}, Version: {7}, Command Register: {8}, Status Register: {9}. | Critical | System |
| A recoverable PCIe error occurred in last boot. The following details were reported. Port Type: {1}, Device: {2}, Bus #: {3}, Function: {4}, Slot: {5}, Device Vendor: {6}, Version: {7}, Command Register: {8}, Status Register: {9}. | Critical | System |
| An external I/O activity is detected on datastore {1}, this is an unsupported configuration. Consult the Resource Management Guide or follow the Ask VMware link for more information. | Informational | System |
| Lost network connectivity on virtual switch {1}. Physical NIC {2} is down. Affected portgroups:{3}. | Critical | System |
| Lost network connectivity on DVPorts: {1}. Physical NIC {2} is down. | Critical | System |
| Uplink redundancy degraded on DVPorts: {1}. Physical NIC {2} is down. | Warning | System |
| Lost uplink redundancy on DVPorts: {1}. Physical NIC {2} is down. | Warning | System |
| Guest-initiated IPv6 TCP Segmentation Offload (TSO) packets ignored. Manually disable TSO inside the guest operating system in virtual machine {1}, or use a different virtual adapter. | Critical | System |
| The ESX advanced configuration option /Migrate/Vmknic is set to an invalid vmknic: {1}. /Migrate/Vmknic specifies a vmknic that vMotion binds to for improved performance. Update the configuration option with a valid vmknic. Alternatively, if you do not want vMotion to bind to a specific vmknic, remove the invalid vmknic and leave the option blank. | Warning | System |
| Virtual NIC with hardware address {1} failed to connect to distributed virtual port {2} on switch {3}. There are no more ports available on the host proxy switch. | Warning | System |
| Uplink redundancy degraded on virtual switch {1}. Physical NIC {2} is down. Affected portgroups:{3}. | Warning | System |
| Lost uplink redundancy on virtual switch {1}. Physical NIC {2} is down. Affected portgroups:{3}. | Warning | System |
| VMkernel failed to set the MTU value {1} on the uplink {2}. | Warning | System |
| A duplicate IP address was detected for {1} on the interface {2}. The current owner is {3}. | Warning | System |
| Physical NIC {1} linkstate is down. | Informational | System |
| Uplink {1} has recovered from a transient failure due to watchdog timeout | Informational | System |
| The maximum number of supported devices of {1} has been reached. A device from plugin {2} could not be created. | Critical | System |
| Space utilization on thin-provisioned device {1} exceeded configured threshold. Affected datastores (if any): {2}. | Warning | System |
| The maximum number of supported paths of {1} has been reached. Path {2} could not be added. | Critical | System |
| Frequent PowerOn Reset Unit Attentions are occurring on device {1}. This might indicate a storage problem. Affected datastores: {2} | Warning | System |
| Lost connectivity to storage device {1}. Path {2} is down. Affected datastores: {3}. | Critical | System |
| Frequent PowerOn Reset Unit Attentions are occurring on path {1}. This might indicate a storage problem. Affected device: {2}. Affected datastores: {3} | Warning | System |
| Frequent path state changes are occurring for path {1}. This might indicate a storage problem. Affected device: {2}. Affected datastores: {3} | Warning | System |
| Path redundancy to storage device {1} degraded. Path {2} is down. Affected datastores: {3}. | Warning | System |
| Lost path redundancy to storage device {1}. Path {2} is down. Affected datastores: {3}. | Warning | System |
| Successfully restored access to volume {1} ({2}) following connectivity issues. | Informational | System |
| Lost access to volume {1} ({2}) due to connectivity issues. Recovery attempt is in progress and outcome will be reported shortly. | Informational | System |
| Lost connectivity to volume {1} ({2}) and subsequent recovery attempts have failed. | Critical | System |
| No space for journal on volume {1} ({2}). Opening volume in read-only metadata mode with limited write support. | Critical | System |
| At least one corrupt on-disk lock was detected on volume {1} ({2}). Other regions of the volume might be damaged too. | Critical | System |
| Failed to mount to the server {1} mount point {2}. {3} | Critical | System |
| Failed to mount to the server {1} mount point {2}. {3} | Critical | System |
| Lost connection to server {1} mount point {2} mounted as {3} ({4}). | Critical | System |
| Restored connection to server {1} mount point {2} mounted as {3} ({4}). | Informational | System |
| At least one corrupt resource metadata region was detected on volume {1} ({2}). Other regions of the volume might be damaged too. | Critical | System |
| Volume on device {1} locked, possibly because remote host {2} encountered an error during a volume operation and could not recover. | Critical | System |
| License downgrade: {licenseKey} removes the following features: {lostFeatures} | Warning | System |
| Lost network connectivity on virtual switch {1}. Physical NIC {2} is down. Affected portgroups:{3}. | Critical | System |
| Guest-initiated IPv6 TCP Segmentation Offload (TSO) packets ignored. Manually disable TSO inside the guest operating system in virtual machine {1}, or use a different virtual adapter. | Critical | System |
| The ESX advanced config option /Migrate/Vmknic is set to an invalid vmknic: {1}. /Migrate/Vmknic specifies a vmknic that vMotion binds to for improved performance. Please update the config option with a valid vmknic or, if you do not want vMotion to bind to a specific vmknic, remove the invalid vmknic and leave the option blank. | Warning | System |
| Virtual NIC with hardware address {1} failed to connect to distributed virtual port {2} on switch {3}. There are no more ports available on the host proxy switch. | Warning | System |
| Uplink redundancy degraded on virtual switch {1}. Physical NIC {2} is down. {3} uplinks still up. Affected portgroups:{4}. | Warning | System |
| Lost uplink redundancy on virtual switch {1}. Physical NIC {2} is down. Affected portgroups:{3}. | Warning | System |
| Space utilization on thin-provisioned device {1} exceeded configured threshold. | Warning | System |
| Lost connectivity to storage device {1}. Path {2} is down. Affected datastores: {3}. | Critical | System |
| Path redundancy to storage device {1} degraded. Path {2} is down. {3} remaining active paths. Affected datastores: {4}. | Warning | System |
| Lost path redundancy to storage device {1}. Path {2} is down. Affected datastores: {3}. | Warning | System |
| Successfully restored access to volume {1} ({2}) following connectivity issues. | Informational | System |
| Lost access to volume {1} ({2}) due to connectivity issues. Recovery attempt is in progress and outcome will be reported shortly. | Informational | System |
| Lost connectivity to volume {1} ({2}) and subsequent recovery attempts have failed. | Critical | System |
| No space for journal on volume {1} ({2}). Opening volume in read-only metadata mode with limited write support. | Critical | System |
| At least one corrupt on-disk lock was detected on volume {1} ({2}). Other regions of the volume may be damaged too. | Critical | System |
| Lost connection to server {1} mount point {2} mounted as {3} ({4}). | Critical | System |
| Restored connection to server {1} mount point {2} mounted as {3} ({4}). | Informational | System |
| At least one corrupt resource metadata region was detected on volume {1} ({2}). Other regions of the volume might be damaged too. | Critical | System |
| Volume on device {1} locked, possibly because remote host {2} encountered an error during a volume operation and could not recover. | Critical | System |
Ejecución manual
Ejecución normal
./pandora_vmware <ruta_del_conf>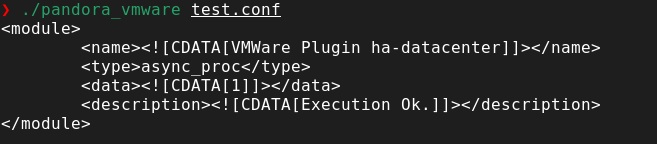
Generar contraseña encriptada
./pandora_vmware <ruta_del_conf> --generate_password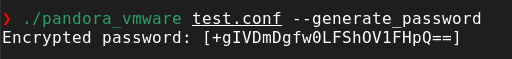
Recuerda que la contraseña debe estar especificada en el apartado "password" del fichero de configuración.
Discovery
Este plugin puede integrarse con el Discovery de Pandora FMS.
Para ello se debe cargar el paquete ".disco" que puede descargar desde la librería de Pandora FMS:
https://pandorafms.com/library/
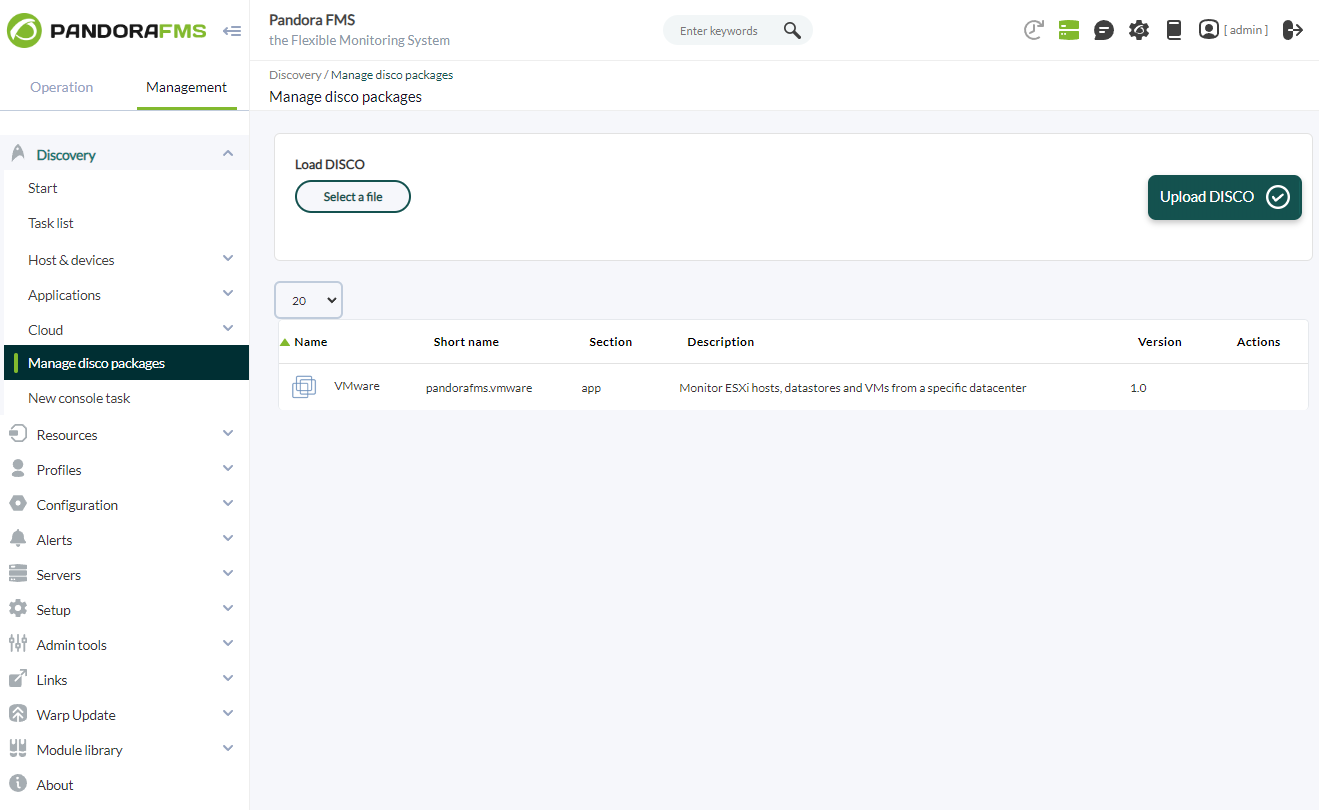
Una vez cargado, se podrán monitorizar entornos de VMware creando tareas de Discovery desde la sección Management > Discovery > Applications.
Para cada tarea se solicitarán los siguientes datos mínimos:
- V-Center IP: Dirección IP del V-Center a monitorizar.
- Datacenter name: Nombre del datacenter a monitorizar en el V-Center indicado.
- Datacenter user: Usuario de conexión al V-Center.
- Password: Contraseña del usuario indicado.
- Encrypt passwords: Si se activa, la contraseña indicada se encriptará para las ejecuciones, haciendo así que vaya enmascarada.
- Tentacle IP: IP del servidor de Tentacle al que enviar los datos de los agentes. Normalmente este parámetro no se modificará.
- Tentacle port: Puerto del servidor de Tentacle al que enviar los datos. Normalmente este parámetro no se modificará.
- Tentacle extra options: Opciones adicionales para el envio de datos mediante el cliente de Tentacle. Normalmente este parámetro no se modificará.
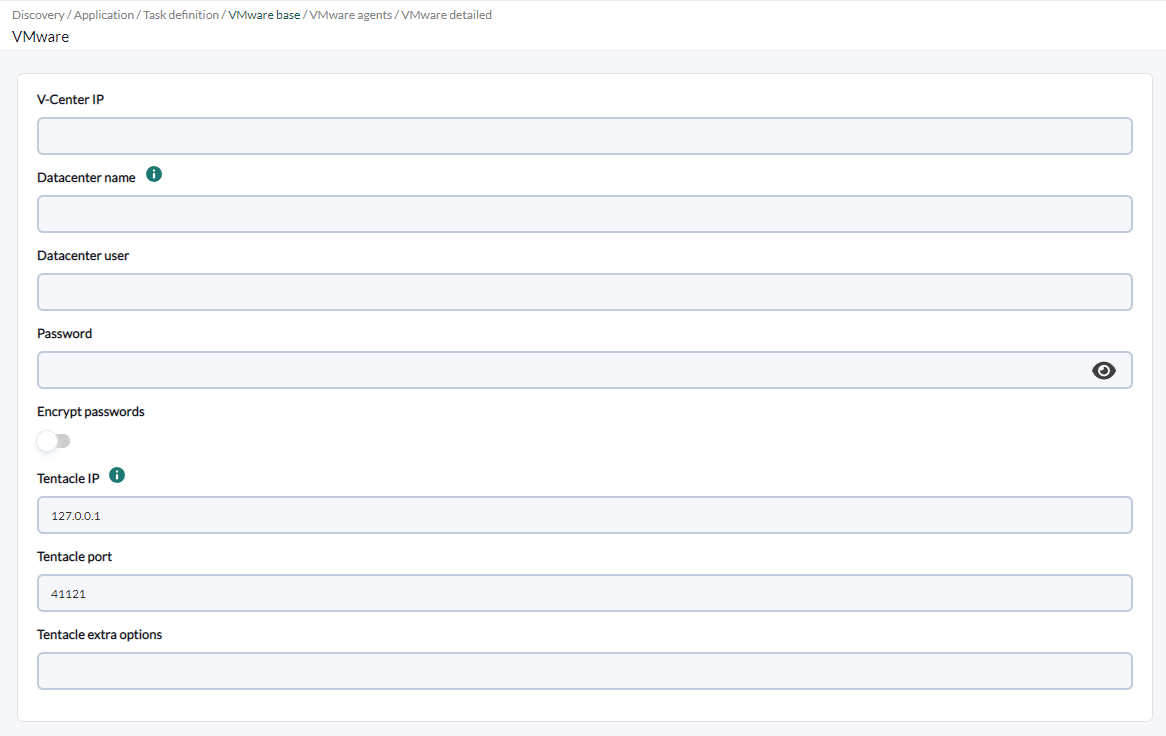
Si los datos de conexión proporcionados son correctos y el servidor de Pandora FMS es capaz de conectar, se podrá ver un árbol con los ESX, datastores y VMs del entorno. En este árbol se podrá, si se desea indicar agentes específicos para ser monitorizados por la tarea. En caso de no activar la monitorización exclusiva de agentes, la tarea por defecto escaneará el entorno en cada ejecución en busca de nuevos agentes (esto se puede ajustar en el siguiente paso de configuración).
- Monitor exclusive agents: Si se activa la tarea monitorizará exclusivamente los elementos del árbol seleccionado, en lugar de realizar el escaneo de agentes que haría normalmente. Esta opción tiene prioridad sobre las opciones de escaneo de pasos siguientes.

También se podrá ajustar la configuración de la tarea para personalizar la monitorización deseada:
- Max threads: Para optimizar el tiempo de ejecución, se podrán configurar múltiples hilos para monitorizar los agentes de la tarea. Hay que tener en cuenta que configurar múltiples hilos puede aumentar el uso de CPU de la tarea.
- Re-scan interval: Intervalo de búsqueda de nuevos agentes en el entorno de VMware. Este parámetro solo tiene efecto si la monitorización exclusiva de agentes está deshabilitada. No se debe confundir con el intervalo de ejecución de la tarea.
- Retry send: Al activarlo se reintenta el envío de los ficheros XML por Tentacle en caso de fallo.
- Event mode: Al activarlo se realiza la monitorización de eventos del V-Center. Esto hace que los eventos de VMware se muestren en la consola de eventos de Pandora FMS, entrando en su flujo normal de funcionamiento. Es necesario configurar el API de la consola en el fichero de configuración del servidor para que este modo funcione. Esta opción solo esta disponible para vCenter.
- Virtual network monitoring: Al activarlo se generarán agentes para los switches virtuales del entorno de VMware.
- Scan datastores: Al activarlo se generarán agentes para cada datastore encontrado en el entorno. Este parámetro solo tiene efecto si la monitorización exclusiva de agentes está deshabilitada.
- Scan datacenters: Al activarlo se generará un agente para el datacenter indicado en la tarea.
- Scan ESXs: Al activarlo se generarán agentes para cada ESX encontrado en el entorno. Este parámetro solo tiene efecto si la monitorización exclusiva de agentes está deshabilitada.
- Scan VMs: Al activarlo se generarán agentes para cada VM encontrada en el entorno. Este parámetro solo tiene efecto si la monitorización exclusiva de agentes está deshabilitada.
- Scan Resource Pools: Al activarlo se generarán agentes para cada VM encontrada en el entorno. Este parámetro solo tiene efecto si la monitorización exclusiva de agentes está deshabilitada.
- Extra settings: Bloque de configuración adicional opcional. Aquí se pueden incluir todos los parámetros de configuración del plugin que se quiera como por ejemplo el bloque Rename.
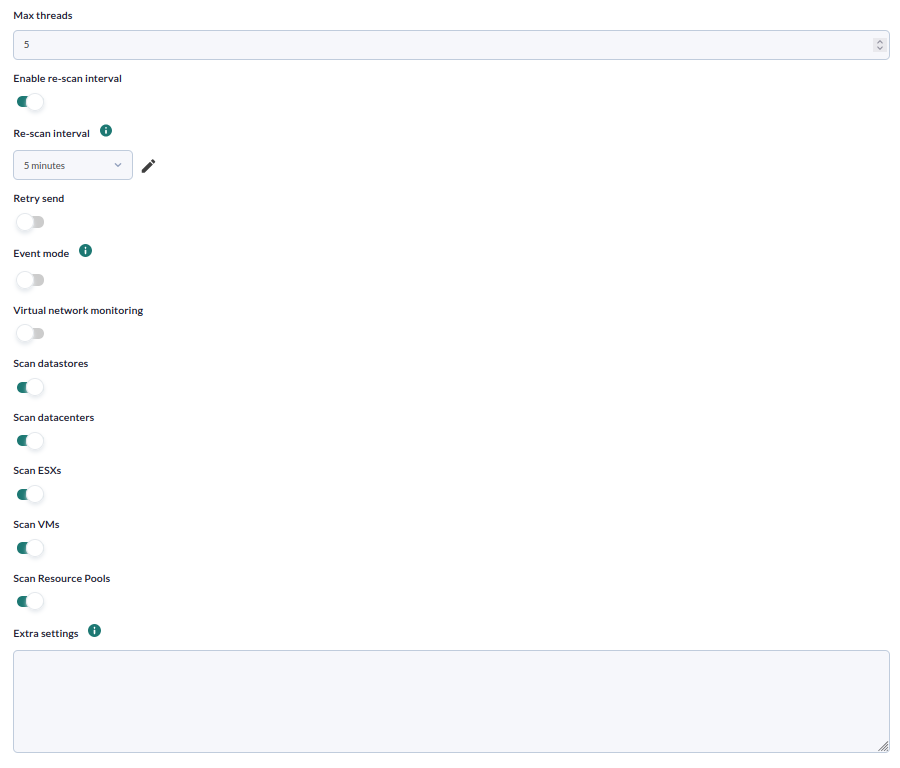
Las tareas que se completen exitosamente dispondrán de un sumario de ejecución con la siguiente información:
- Datacenter: Nombre del datacenter monitorizado en la ejecución.
- ESXs: Cantidad de ESXs monitorizados por la tarea.
- Datastores: Cantidad de datastores monitorizados por la tarea.
- Vms: Cantidad de VMs monitorizadas por la tarea.
- ResourcePools: Cantidad de RPs monitorizadas por la tarea.
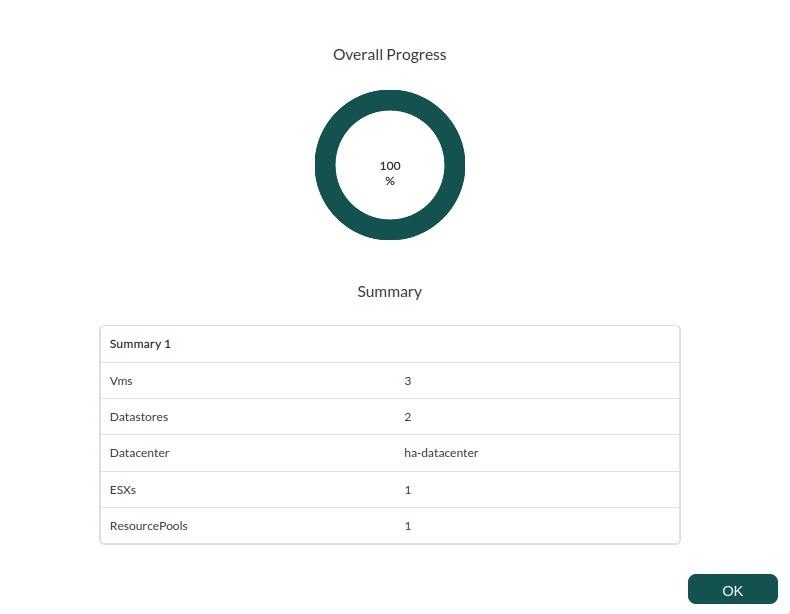
Las tareas que no se completen exitosamente dispondrán de un sumario de ejecución registrando los errores producidos.
Agentes generados por el plugin
La ejecución de este plugin creara varios agentes, dependiendo de la configuración que se haya implementado en el archivo de configuración. En total el plugin puede crear los siguientes tipos de agente con los siguientes módulos:
Datacenter
Se creara un agente para el datacenter especificado en el archivo de configuración, con los siguientes módulos
| Módulo | Nombre corto | Descripción | Versión API | Disponibilidad |
| Ping | ping | Chequeo ping a la máquina que soporta el vCenter | Todas | Siempre |
| Check 443 port | check443 | Chequeo al puerto 443 de la máquina que soporta el vCenter | Todas | Siempre |
Datastores
Se creará un agente por cada datastore a monitorizar, según la configuración especificada, con los siguientes módulos
| Módulo | Nombre corto | Descripción | Versión API | Disponibilidad |
|---|---|---|---|---|
| Capacity | capacity | Capacidad máxima del Datastore en bytes | Todas | Siempre |
| Free Space | freeSpace | Porcentaje de espacio libre del Datastore | Todas | Siempre |
| Disk Overallocation | overallocation | Porcentaje de sobre asignación del disco | ≥v4.0 | Siempre |
| Free Space Bytes | freeSpaceBytes | Cantidad de espacio libre en bytes | Todas | Siempre |
| ESX-DS Paths Status |
dsPathStatus |
Datastore es accesible por todos los esx configurados |
Todas |
Siempre |
ESX
Se creará un agente por cada host de ESXI a monitorizar, según la configuración específica.
| Módulo | Nombre corto | Descripción | Versión API | Disponibilidad |
|---|---|---|---|---|
| Boot Time | bootTime | Última fecha en la que se encendió el host | Todas | Siempre |
| CPU Info [x] | cpuInfo | Información general de la CPU (se crea un módulo por CPU del ESXi) | Todas | Si conectado |
| Memory Size | memorySize | Cantidad total de memoria física del host en Bytes | Todas | Si conectado |
| Overall CPU Usage | overallCpuUsage | Suma del uso de todas las CPUs en Mhz | Todas | Si conectado |
| Overall Memory Usage | overallMemoryUsage | Overall Memory Usage of VMware Hosts | Todas | Si conectado |
| Power State | powerState | Estado de la energía del host | ≥v2.5 | Siempre |
| SSL Thumbprint | sslThumbprint | Huella SSL del host | ≥v4.0 | Si configurado |
| Uptime | uptime | Uptime del host en segundos | ≥v4.1 | Si conectado |
| VNIC Info [x] | vnicInfo | Información sobre interfaces de red virtuales del host | Todas | Si conectado y configurado |
| Host Alive | hostAlive | Módulo que vale 1 si el ESX está conectada y 0 en caso contrario | Todas | Siempre |
| Connection State | connectionState | Estado de la conexión del host | Todas | Siempre |
| Disk Read | diskRead | Tasa de Kbps leídos del disco | Todas | Nivel stats ≥2 |
| Disk Write | diskWrite | Tasa de Kbps escritos del disco | Todas | Nivel stats ≥2 |
| Disk Read Latency | diskReadLatency | Latencia de lectura del disco en milisegundos | Todas | Nivel stats ≥2 |
| Disk Write Latency | diskWriteLatency | Latencia de escritura del disco en milisegundos | Todas | Nivel stats ≥2 |
| Data received | netReceived | Tasa de Kbps recibidos del host | Todas | Nivel stats ≥2 |
| Data transmitted | netTransmitted | Tasa de Kbps enviados del host | Todas | Nivel stats ≥2 |
| Packages Received | netPkgRx | Número de paquetes recibidos en el intervalo | Todas | Nivel stats ≥2 |
| Packages Transmitted | netPkgTx | Número de paquetes enviados en el intervalo | Todas | Nivel stats ≥2 |
| CPU Usage | cpuUsagePercent | Porcentaje de uso de CPU | Todas | Nivel stats ≥2 |
| Memory Usage | memoryUsagePercent | Porcentaje de uso de la memoria RAM | Todas | Nivel stats ≥2 |
| Net Usage | netUsage | Datos de red recibidos y enviados de todas las NICs | Todas | Nivel stats ≥2 |
| Disk Rate | diskRate | Tasa I/O agredada en KB/seg | Todas | Nivel stats ≥2 |
| Max. Disk Latency | maxDiskLatency | Latencia máxima de todos los discos | Todas | Nivel stats ≥2 |
| HA Status | haStatus | Estado HA del host | ≥v5.0 | Si configurado |
| Sensor* | systemHealthInfo | Estado de los sensores de hardware (un módulo por sensor) | Todas | ESXi >= 3.5 |
| Sensor* | systemHealthInfoMetrics | Métricas de los sensores | Todas | ESXi >= 3.5 |
| <Nombre path) | pathStatus | Estado de cada path | Todas | Nivel stats ≥2 |
VM
Se creará un agente por cada máquina virtual a monitorizar, según la configuración específica.
| Módulo | Nombre corto | Descripción | Versión API | Disponibilidad |
|---|---|---|---|---|
| Boot Time | bootTime | Última fecha en la que se encendió la máquina virtual | Todas | Si conectado |
| Connection State | connectionState | Estado de la conexión | Todas | Siempre |
| Consumed Overhead Memory | consumedOverheadMemory | Cantidad de memoria consumida por la máquina virtual en MB | ≥v4.0 | Si configurado |
| CPU Allocation | cpuAllocation | Información sobre los recursos asignados a la CPU de la máquina virtual | Todas | Si configurado |
| Disk Free [x] | diskFree | Porcentaje libre del disco de la máquina virtual. (Habrá un módulo por cada disco que contenga la máquina virtual) | Todas | Si configurado |
| Guest State | guestState | Modo de operación del sistema operativo huésped | Todas | Si configurado |
| Host Info | host | Información sobre el host VMware | Todas | Si configurado |
| Host Alive | hostAlive | Módulo que vale 1 si la máquina virtual está en ejecución y 0 en caso contrario | Todas | Siempre |
| Host Memory Usage | hostMemoryUsage | Memoria consumida por la máquina virtual en MB | Todas | Si conectado |
| Host Name | hostName | Nombre del host asociado | Todas | Si configurado |
| IP Address [x] | ipAddress | Dirección IP de la máquina. (Aparecerá una por interfaz de red disponible) | ≥v4.1 | Si configurado |
| MAC Address [x] | macAddress | Dirección MAC de la máquina. (Aparecerá una por interfaz de red disponible) | Todas | Si configurado |
| Max CPU Usage | maxCpuUsage | Límite superior de uso de la CPU de la máquina virtual | Todas | Si conectado |
| Max Memory Usage | maxMemoryUsage | Límite superior de uso de la memoria RAM de la máquina virtual | Todas | Si conectado |
| Memory Allocation | memoryAllocation | Límite de los recursos para la memoria | Todas | Si configurado |
| Memory Overhead | memoryOverhead | Cantidad de memoria usada por la máquina virtual por encima de las necesidades del sistema operativo huésped en Bytes | Todas | Si configurado |
| Overall CPU Demand | overallCpuDemand | Estadísticas básicas sobre el rendimiento de la CPU en Mhz | ≥v4.0 | Si conectado |
| Overall CPU Usage | overallCpuUsage | Estadísticas básicas sobre el uso de la CPU en Mhz | Todas | Si conectado |
| Power State | powerState | Estado actual de la máquina virtual | Todas | Siempre |
| Private Memory | privateMemory | Cantidad de memoria en MB que se otorga a la máquina virtual de la memoria no compartida | ≥v4.0 | Si conectado |
| Shared Memory | sharedMemory | Cantidad de memoria en MB que se otorga a la máquina virtual de la memoria compartida | ≥v4.0 | Si conectado |
| Tools Running Status | toolsRunningStatus | Estado actual de ejecución de VMware Tools instaladas en el sistema operativo huésped | ≥v4.0 | Si configurado |
| Trigger Alarm State | triggeredAlarmState | Estado de las alarmas de VMware | ≥v4.0 | Si configurado |
| Uptime Seconds | uptimeSeconds | Uptime de la máquina virtual en segundos | ≥v4.1 | Si conectado |
| Virtual Image Path | virtualImagePath | Ruta del archivo de configuración de la máquina virtual (.vmx) | Todas | Siempre |
| Disk Read | diskRead | Tasa de Kbps leidos del disco | Todas | Nivel stats ≥2 |
| Disk Write | diskWrite | Tasa de Kbps escritos del disco | Todas | Nivel stats ≥2 |
| Disk Read Latency | diskReadLatency | Latencia de lectura del disco en milisegundos | Todas | Nivel stats ≥2 |
| Disk Write Latency | diskWriteLatency | Latencia de escritura del disco en milisegundos | Todas | Nivel stats ≥2 |
| Data received | netReceived | Tasa de Kbps recibidos del host | Todas | Nivel stats ≥2 |
| Data transmitted | netTransmitted | Tasa de Kbps enviados del host | Todas | Nivel stats ≥2 |
| Packages Received | netPkgRx | Número de paquetes recibidos en el intervalo | Todas | Nivel stats ≥2 |
| Packages Transmitted | netPkgTx | Número de paquetes enviados en el intervalo | Todas | Nivel stats ≥2 |
| CPU Usage | cpuUsagePercent | Porcentaje de uso de CPU | Todas | Nivel stats ≥2 |
| Memory Usage | memoryUsagePercent | Porcentaje de uso de la memoria RAM | Todas | Nivel stats ≥2 |
| Net Usage | netUsage | Datos de red recibidos y enviados de todas las NICs | Todas | Nivel stats ≥2 |
| Disk Rate | diskRate | Tasa I/O agredada en KB/seg | Todas | Nivel stats ≥2 |
| Max. Disk Latency | maxDiskLatency | Latencia máxima de todos los discos | Todas | Nivel stats ≥2 |
| HeartBeat | heartbeat | Número de heartbeats de la máquina virtual | Todas | Nivel stats ≥2 |
| CPU Ready | cpuReady | Porcentaje de tiempo que la máquina está en lista, pero no encolada para ejecutarse en la CPU física | Todas | Nivel stats ≥2 |
| Number Snapshots | snapshotCounter | Número de snapshots para la máquina virtual (este Módulo puede afectar al rendimiento de la monitorización, por ello se recomienda ejecutarlo con un valor de intervalo alto, por ejemplo cada hora). | Todas | Nivel stats ≥2 |
| Date Snapshots | snapshotDate | Nombre y fecha de los snapshots de una máquina virtual | Todas | Si configurado |
| HA Status | haStatus | Estado HA para la máquina virtual | ≥v5.0 | Si configurado |
RP
Se creara un agente para cada grupo de recursos especificado en el archivo de configuración, con los siguientes módulos
| Módulo | Nombre corto | Descripción | Versión API | Disponibilidad |
| CPU usage MHz | cpuUsageMhz | CPU consumida en MHz por el Resource Pool. Muestra la capacidad de procesamiento usada actualmente por las máquinas virtuales del pool. | Todas | Siempre |
| Active memory | memActive | Memoria activa utilizada por el Resource Pool. Representa la memoria que está siendo usada de forma activa recientemente por las máquinas virtuales. | Todas | Siempre |
| Granted memory | memGranted | Memoria asignada al Resource Pool. Indica la cantidad de memoria concedida a las máquinas virtuales del pool. | Todas | Siempre |
| Shared memory | memShared | Memoria compartida en el Resource Pool. Cantidad de memoria ahorrada mediante técnicas de compartición entre máquinas virtuales. | Todas | Siempre |
| Swapped memory | memSwapped | Memoria intercambiada (swap) del Resource Pool. Memoria movida a disco por falta de memoria física disponible. | Todas | Siempre |
| Balloon memory | memVmmemctl | Memoria balloon del Resource Pool. Memoria recuperada por VMware mediante el controlador balloon para aliviar presión de memoria. | Todas | Siempre |
| Overhead memory | memOverhead | Memoria de sobrecarga del Resource Pool. Memoria utilizada por VMware para gestionar las máquinas virtuales y su infraestructura. | Todas | Siempre |
Switches
Si se activa la monitorización de switches con la opción "virtual_network_monitoring" del archivo de configuración, se creará un agente por cada switch con los siguientes módulos:
| <nombre_switch>_ifOperStatus | indica el estado operativo de una interfaz de red física o virtual |
| <nombre_switch>_overallStatus | indica el estado general del switch en términos de disponibilidad y salud |
| <nombre_switch>_connectedVMs | muestra el número de máquinas virtuales que están conectadas |