Sap hana Discovery
This document describes the SAP HANA functionality of PandoraFMS discovery.
Introduction
The SAP HANA plugin for Pandora FMS discovers the configured HANA databases and collects status and performance metrics to create the corresponding monitoring modules. Among other indicators, it obtains information on connectivity and availability, memory usage, CPU, volume I/O, connections, transactions, and services.
Prerequisites
-
Connectivity to SAP HANA from Pandora
The plugin is a binary that contains the dependencies packaged within it, so no installation of any kind of dependency is required for its use.
Discovery
This plugin can be integrated with Pandora FMS Discovery.
To do this, you must upload the ".disco" package, which can be downloaded from the Pandora FMS library:
https://pandorafms.com/library/

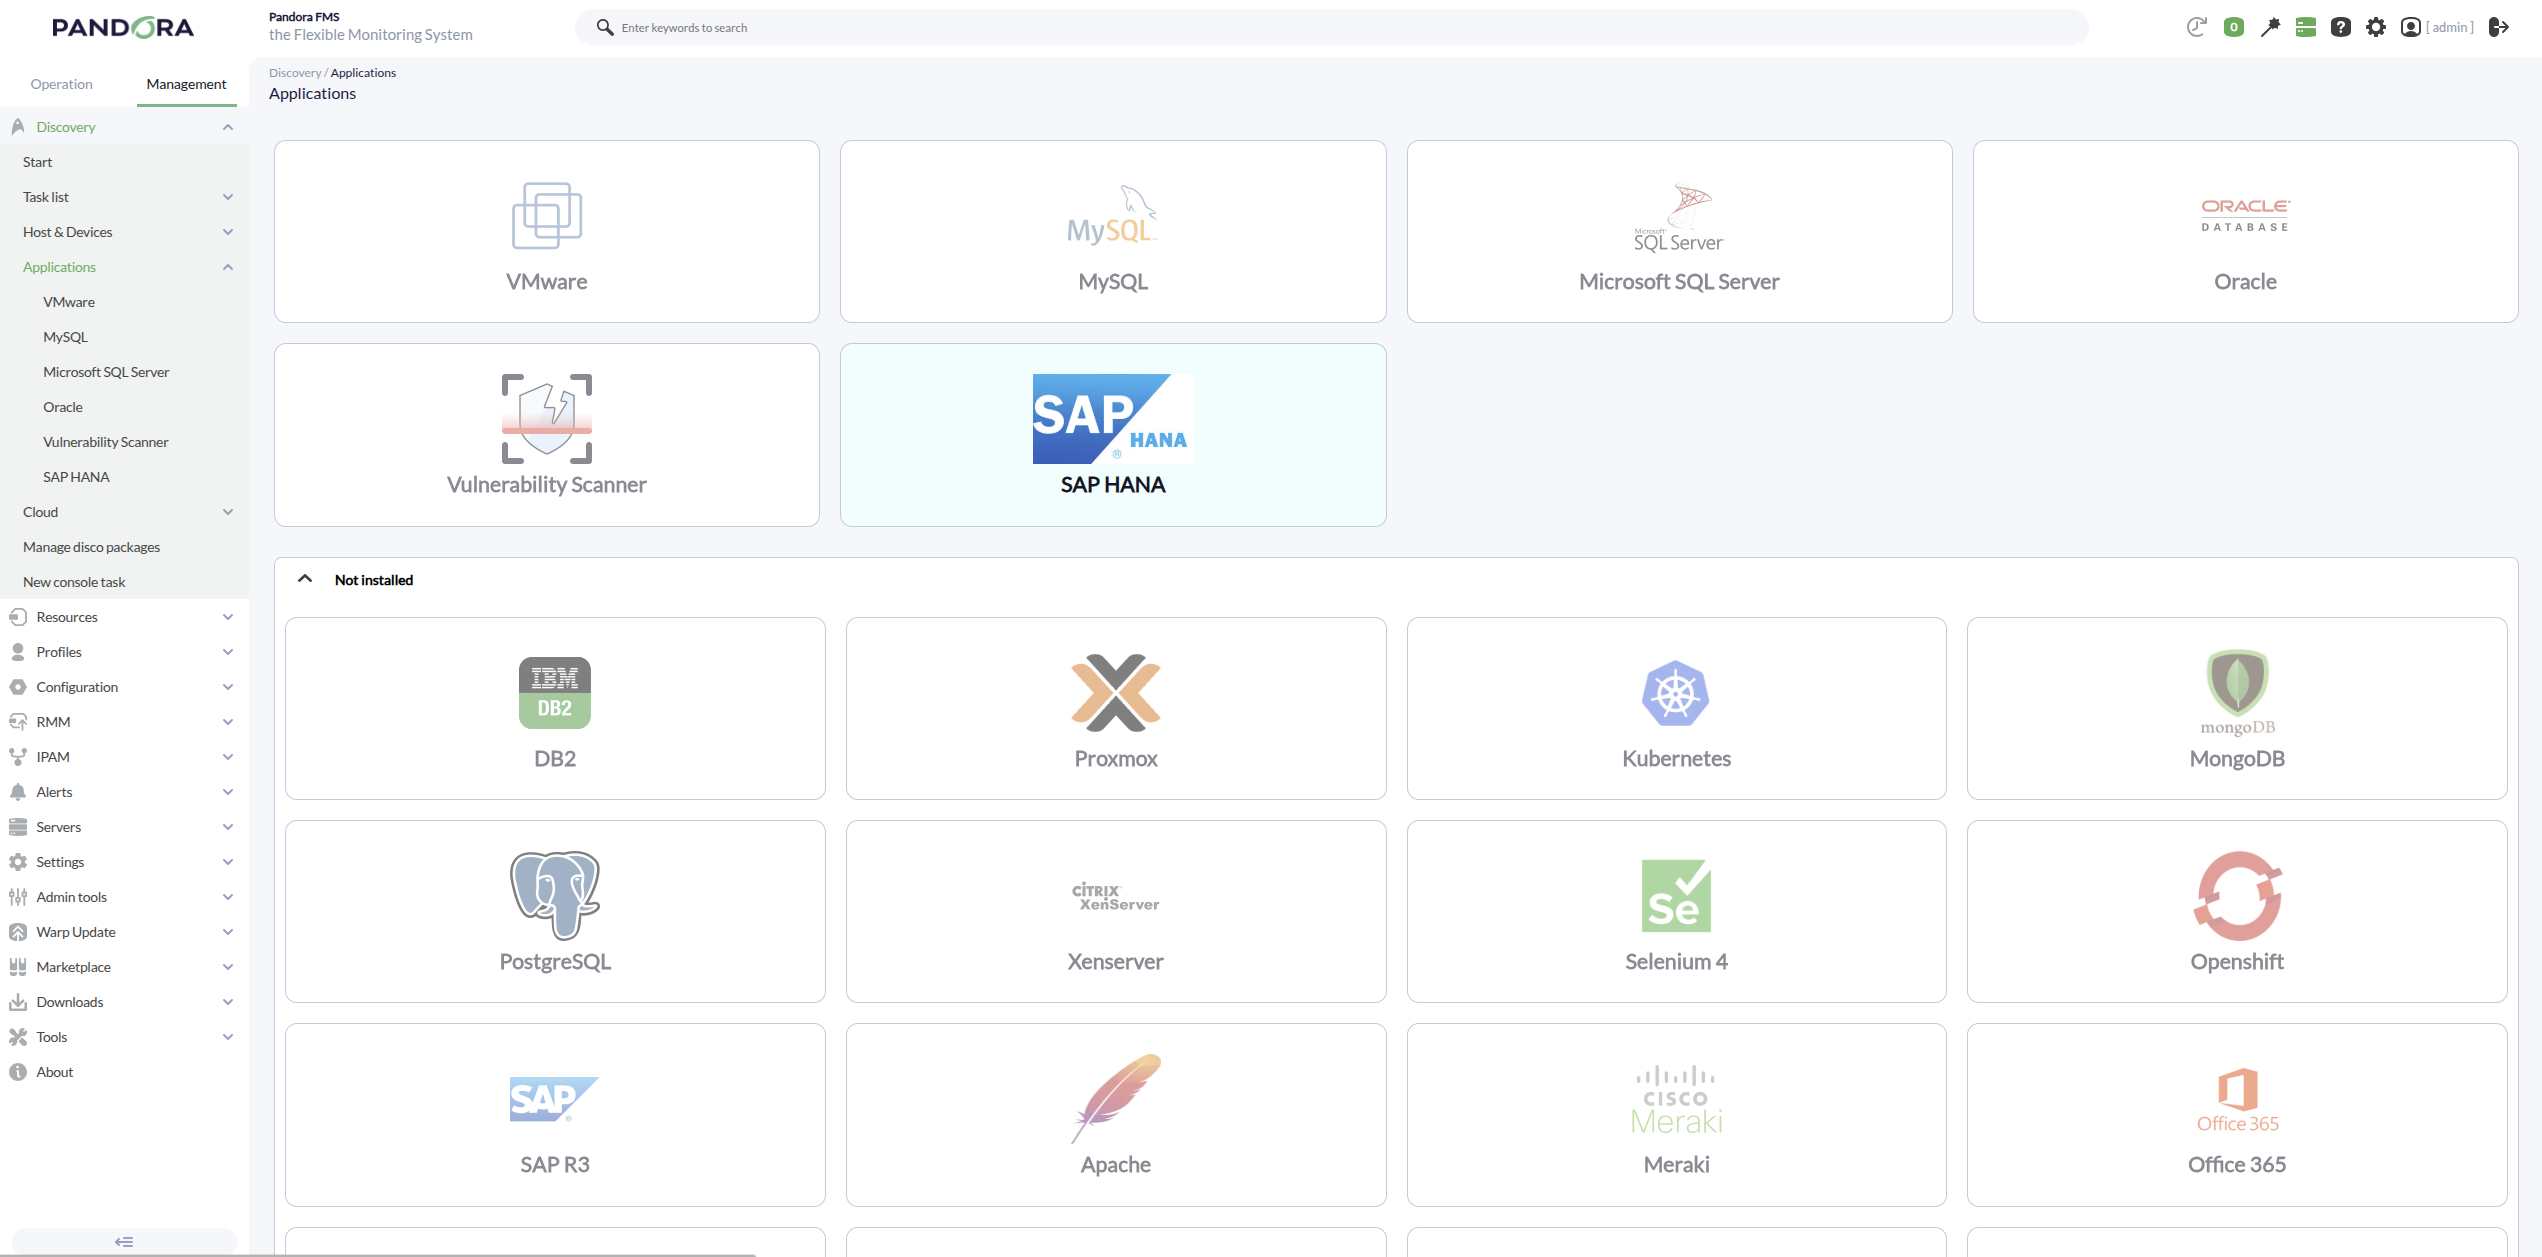
Once uploaded, SAP HANA environments can be monitored by creating Discovery tasks from the Management > Discovery > Applications section.
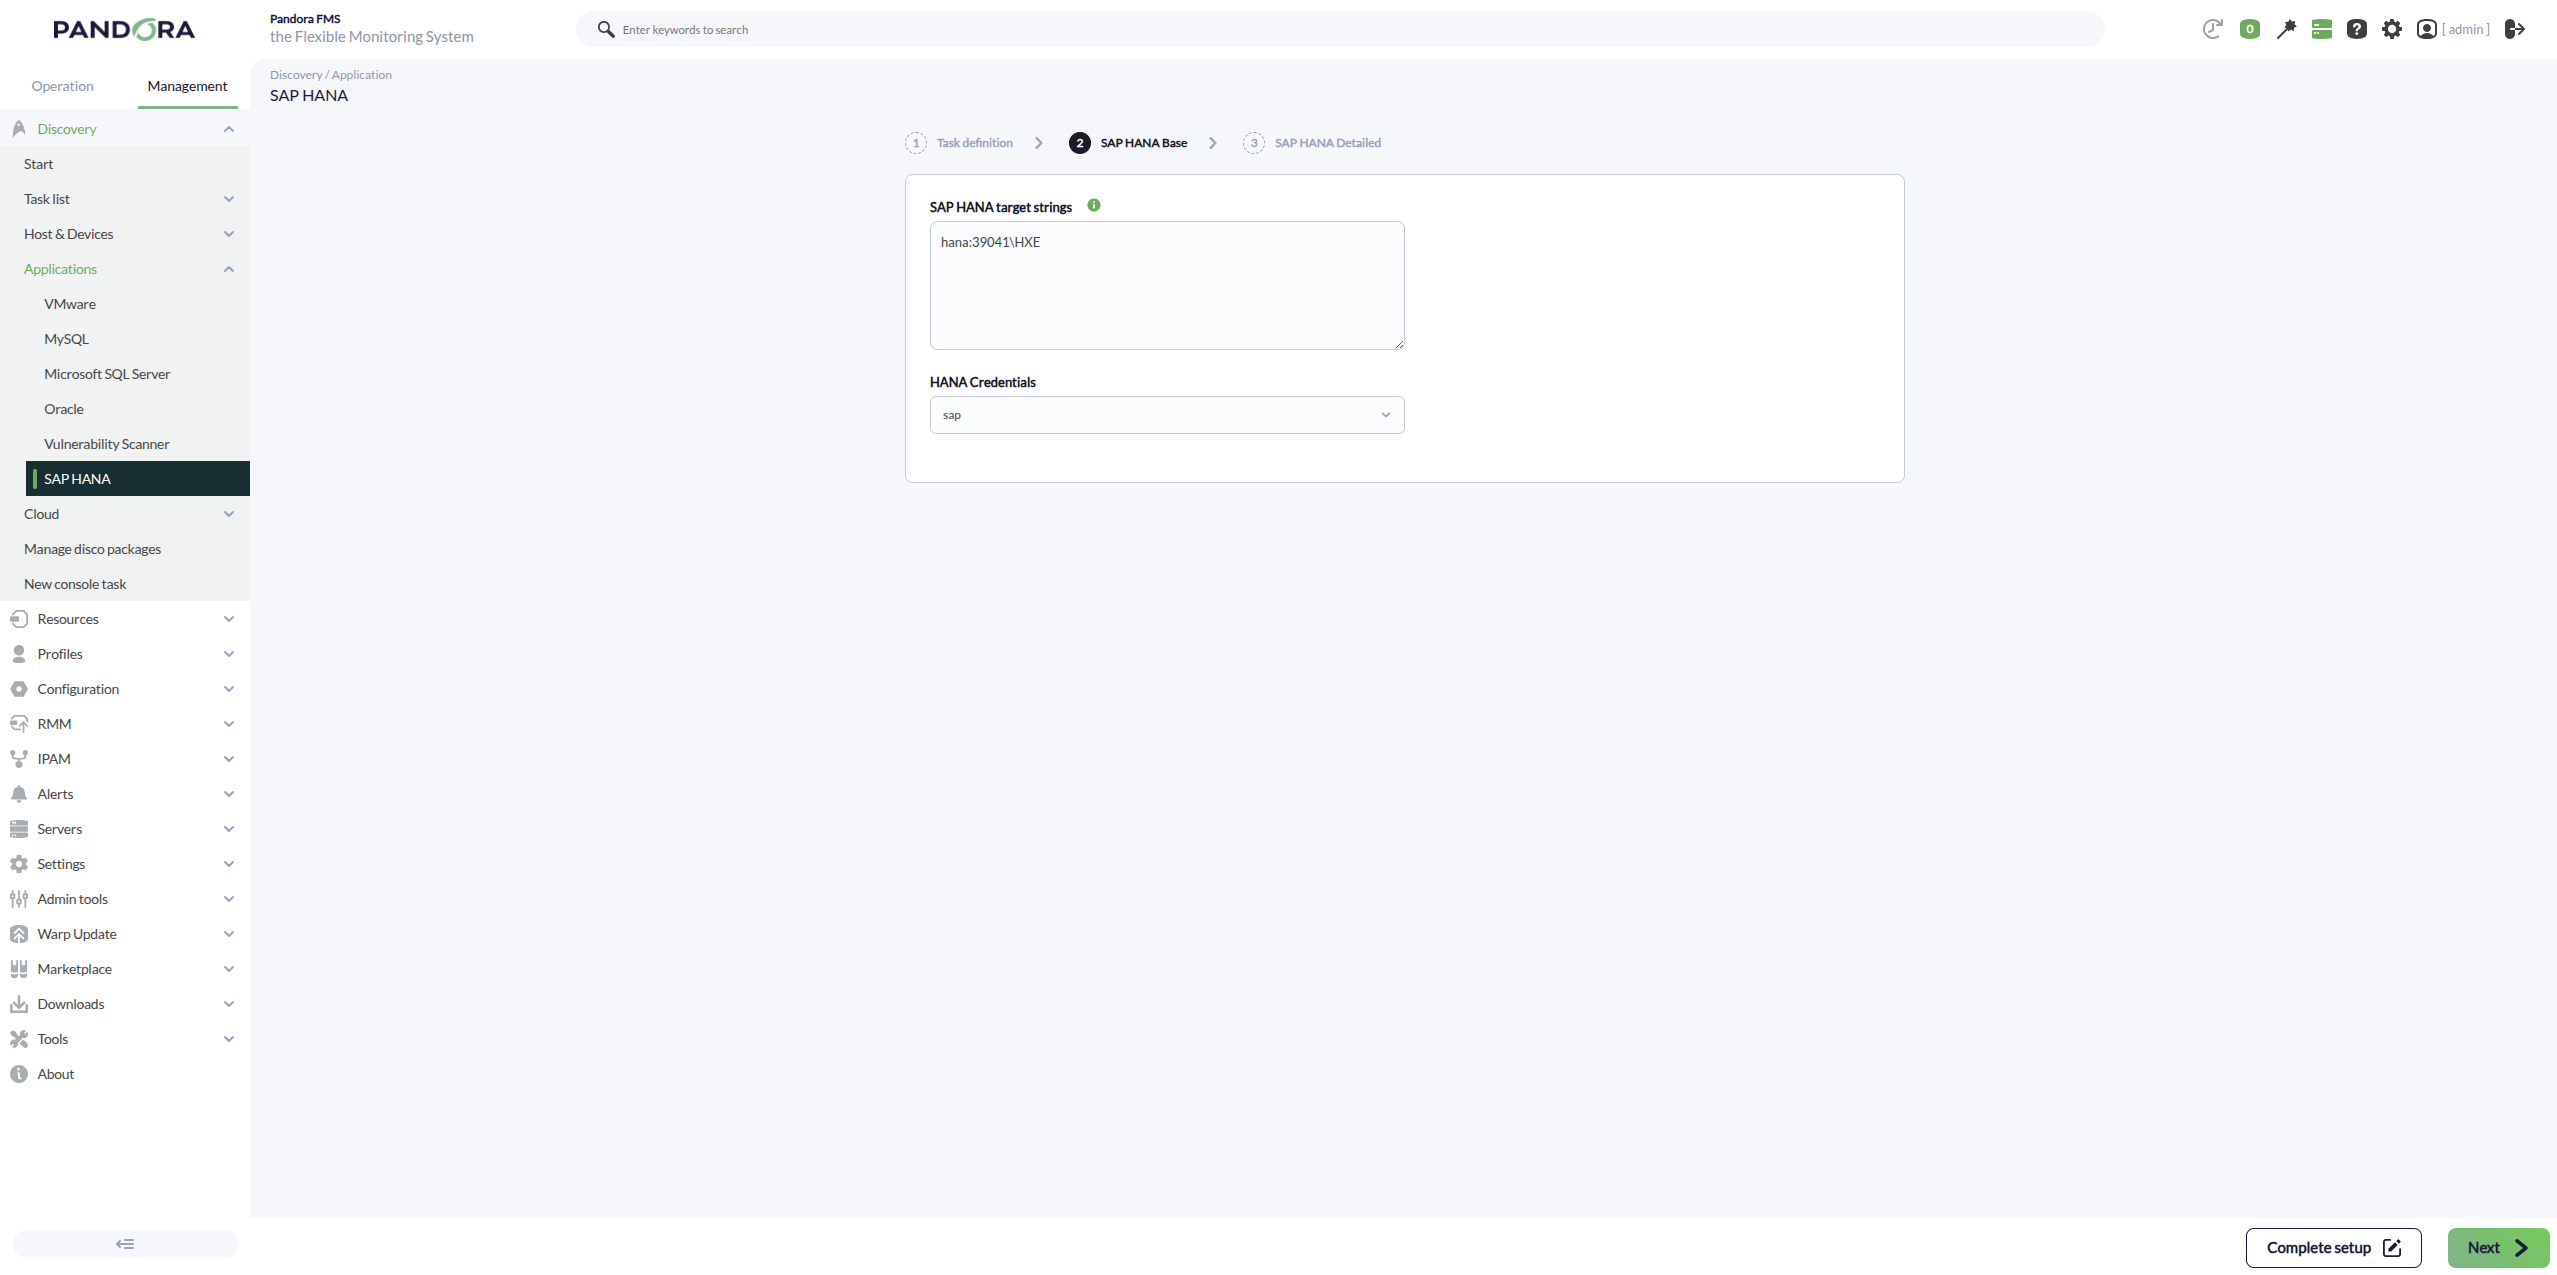
For each task, the following minimum parameters will be required:
- SAP HANA target string: IP address of the host running SAP HANA, port, and database instance.
- Credentials: Custom-type username and password. To use them, a new credential must be created in Management > Configuration > Credential store.
The task configuration can also be adjusted to customize the desired monitoring:
- Max threads: Maximum number of concurrent threads used to execute monitoring queries.
- Target agent: Allows manually defining the agent names where modules will be created. One agent name must be provided for each SAP HANA target string, preserving the same order. If left empty, the plugin will automatically create agents using the HOST - DATABASE format.
- Regexp to filter modules: Enables module filtering using regular expressions.
- Allow regexp: If filtering is enabled, only modules whose names match this regular expression will be created.
- Regexp to discard modules: Enables module exclusion using regular expressions.
- Deny regexp: If exclusion is enabled, modules whose names match this regular expression will not be created.
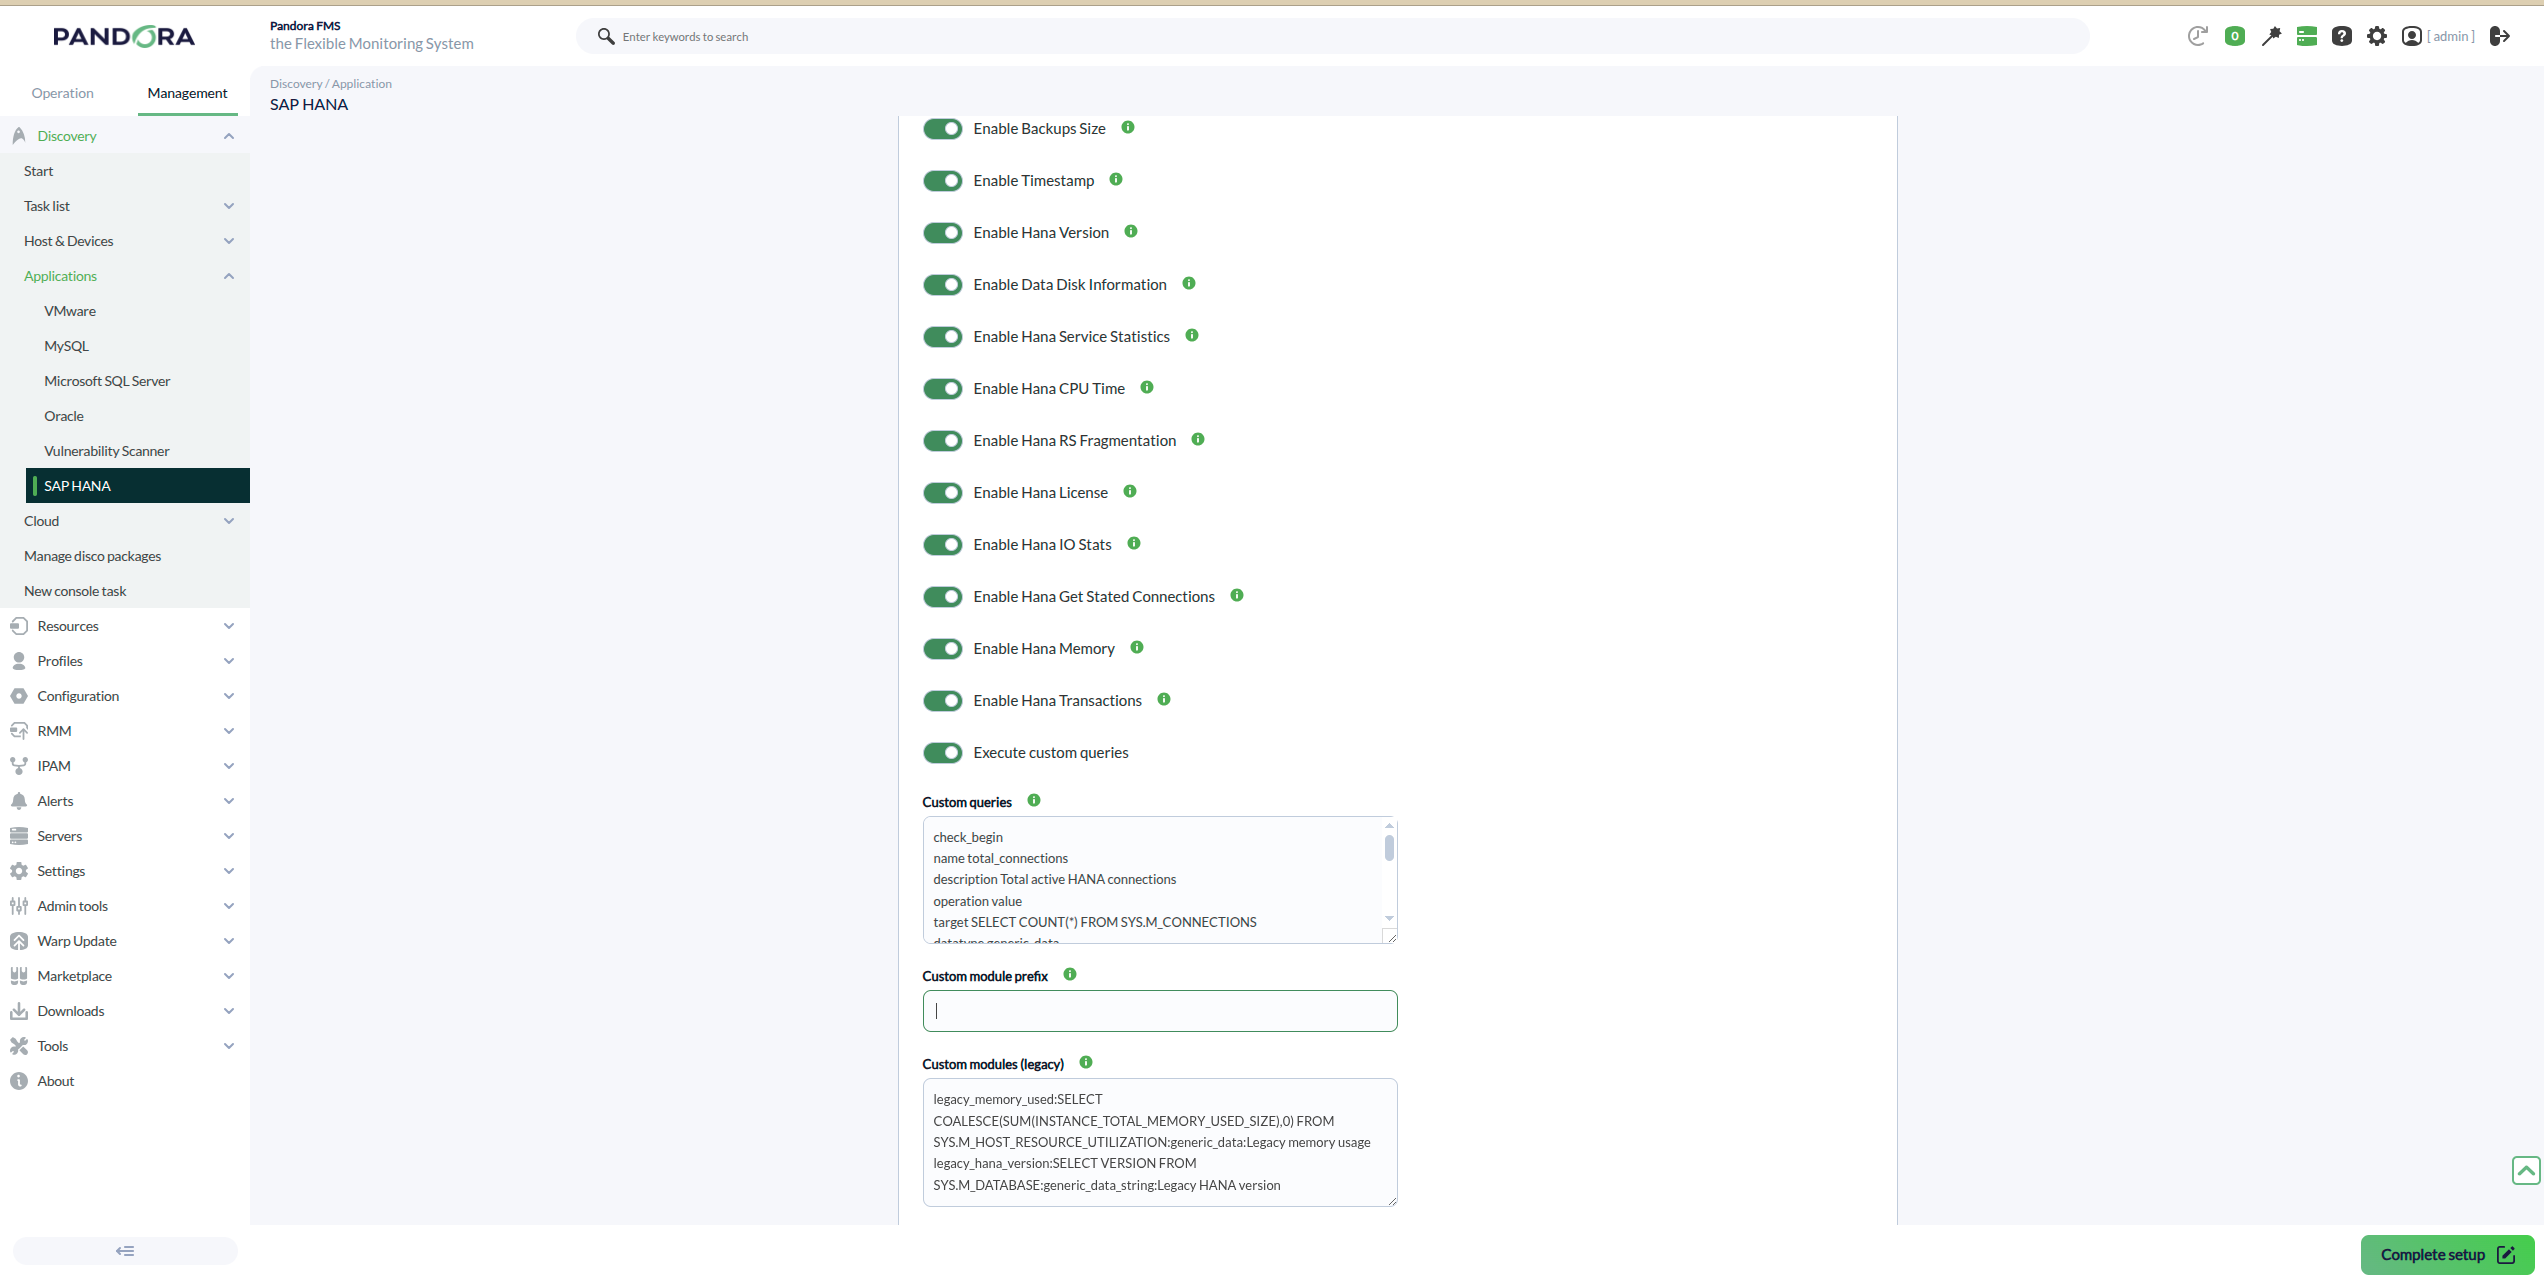
- Backups Size: Creates the module backups_estimated_size_bytes, containing the estimated SAP HANA backup size.
- Timestamp: Creates the module timestamp, containing the current database date/time to verify time drift.
- Hana Version: Creates the module version, containing the installed SAP HANA version.
- Data Disk Information: Creates the modules volumes_count and volumes_io_entries, with basic volume and I/O activity information.
- Hana Service Statistics: Creates modules for each detected SAP HANA service, including ACTIVE_STATUS, PROCESS_CPU_TIME, TOTAL_CPU_TIME, PROCESS_MEMORY, TOTAL_MEMORY, AVAILABLE_MEMORY, ACTIVE_REQUEST_COUNT, PENDING_REQUEST_COUNT, ACTIVE_THREAD_COUNT, THREAD_COUNT, OPEN_FILE_COUNT, REQUESTS_PER_SEC, RESPONSE_TIME, START_TIME, and SYS_TIMESTAMP.
- Hana CPU Time: Creates the modules cpu_total_time_ms, cpu_process_time_ms, and cpu_service_count, with aggregated CPU usage metrics across SAP HANA services.
- Hana RS Fragmentation: Creates the module rowstore_fragmentation_pct, with the estimated Row Store fragmentation percentage.
- Hana License: Creates the modules license_expiration_date, license_days_remaining, license_memory_limit, license_hardware_key, license_installation_number, license_product_name, license_system_id, license_swproductname, and license_enforced, with SAP HANA environment license information.
- Hana IO Stats: Creates the modules io_total_read_bytes, io_total_write_bytes, and io_total_time_ms, with aggregated read, write, and I/O timing metrics.
- Hana Get Stated Connections: Creates the modules connections_total, connections_running, connections_idle, connections_queued, connections_disconnected, and connections_unknown, with active connection status metrics.
- Hana Memory: Creates the modules memory_used_bytes and memory_allocation_limit_bytes, with memory usage and allocation limit metrics.
- Hana Transactions: Creates the modules blocked_transactions, blocked_transactions_distinct_users, and open_transactions, with information about open and blocked transactions.
- Execute custom queries: Enables execution of custom queries defined in the Custom queries field.
- Custom queries: Allows creating multiple custom modules using check_begin/check_end blocks.
- Custom module prefix: Defines a prefix that will be appended to generated module names.
- Custom modules (legacy): Allows defining custom modules using the legacy module:query:type:description format.
Examples of custom queries:
check_begin
name connections_total
description Total connections (SYS.M_CONNECTIONS)
operation value
target SELECT COUNT(*) FROM SYS.M_CONNECTIONS
datatype generic_data
unit conns
check_end

check_begin
name connections_active
description Active RUNNING connections (SYS.M_CONNECTIONS)
operation value
target SELECT COUNT(*) FROM SYS.M_CONNECTIONS WHERE CONNECTION_STATUS = 'RUNNING'
datatype generic_data
unit conns
check_end

check_begin
name memory_used_bytes
description Total used memory (INSTANCE_TOTAL_MEMORY_USED_SIZE)
operation value
target SELECT COALESCE(SUM(INSTANCE_TOTAL_MEMORY_USED_SIZE),0) FROM SYS.M_HOST_RESOURCE_UTILIZATION
datatype generic_data
unit bytes
check_end

check_begin
name memory_allocation_limit_bytes
description Memory allocation limit (ALLOCATION_LIMIT)
operation value
target SELECT COALESCE(SUM(ALLOCATION_LIMIT),0) FROM SYS.M_HOST_RESOURCE_UTILIZATION
datatype generic_data
unit bytes
check_end

check_begin
name cpu_total_time_ms
description Aggregated total CPU time (TOTAL_CPU_TIME)
operation value
target SELECT COALESCE(SUM(TOTAL_CPU_TIME),0) FROM SYS.M_SERVICE_STATISTICS
datatype generic_data
unit ms
check_end

check_begin
name cpu_process_time_ms
description Aggregated process CPU time (PROCESS_CPU_TIME)
operation value
target SELECT COALESCE(SUM(PROCESS_CPU_TIME),0) FROM SYS.M_SERVICE_STATISTICS
datatype generic_data
unit ms
check_end

check_begin
name service_total_memory_bytes
description Aggregated total service memory (TOTAL_MEMORY)
operation value
target SELECT COALESCE(SUM(TOTAL_MEMORY),0) FROM SYS.M_SERVICE_STATISTICS
datatype generic_data
unit bytes
check_end

check_begin
name service_available_memory_bytes
description Aggregated available memory (AVAILABLE_MEMORY)
operation value
target SELECT COALESCE(SUM(AVAILABLE_MEMORY),0) FROM SYS.M_SERVICE_STATISTICS
datatype generic_data
unit bytes
check_end

check_begin
name io_total_read_bytes
description Aggregated total bytes read (TOTAL_READ_SIZE)
operation value
target SELECT COALESCE(SUM(TOTAL_READ_SIZE),0) FROM SYS.M_VOLUME_IO_TOTAL_STATISTICS
datatype generic_data
unit bytes
check_end

check_begin
name io_total_write_bytes
description Aggregated total bytes written (TOTAL_WRITE_SIZE)
operation value
target SELECT COALESCE(SUM(TOTAL_WRITE_SIZE),0) FROM SYS.M_VOLUME_IO_TOTAL_STATISTICS
datatype generic_data
unit bytes
check_end

check_begin
name io_total_time_ms
description Aggregated total I/O time (TOTAL_IO_TIME)
operation value
target SELECT COALESCE(SUM(TOTAL_IO_TIME),0) FROM SYS.M_VOLUME_IO_TOTAL_STATISTICS
datatype generic_data
unit ms
check_end

check_begin
name rowstore_free_pct
description Row Store free percentage (FREE_SIZE/ALLOCATED_SIZE)
operation value
target SELECT CASE WHEN SUM(ALLOCATED_SIZE)=0 THEN 0 ELSE ROUND(SUM(FREE_SIZE)*100.0/SUM(ALLOCATED_SIZE),2) END FROM SYS.M_RS_MEMORY
datatype generic_data
unit %
min_warning 40
min_critical 20
inverse_warning 1
inverse_critical 1
check_end

check_begin
name hana_time_utc
description Database UTC timestamp
operation value
target SELECT TO_VARCHAR(CURRENT_UTCTIMESTAMP) FROM DUMMY
datatype generic_data_string
check_end

check_begin
name hana_services_running
description Number of active services (ACTIVE_STATUS='YES')
operation value
target SELECT COUNT(*) FROM SYS.M_SERVICE_STATISTICS WHERE ACTIVE_STATUS = 'YES'
datatype generic_data
unit services
check_end
Examples of legacy queries:
legacy_memory_used:SELECT COALESCE(SUM(INSTANCE_TOTAL_MEMORY_USED_SIZE),0) FROM SYS.M_HOST_RESOURCE_UTILIZATION:generic_data:Legacy memory usage
legacy_hana_version:SELECT VERSION FROM SYS.M_DATABASE:generic_data_string:Legacy HANA version
Agents and modules generated by the plugin
An example of agents created with the plugin would be this:
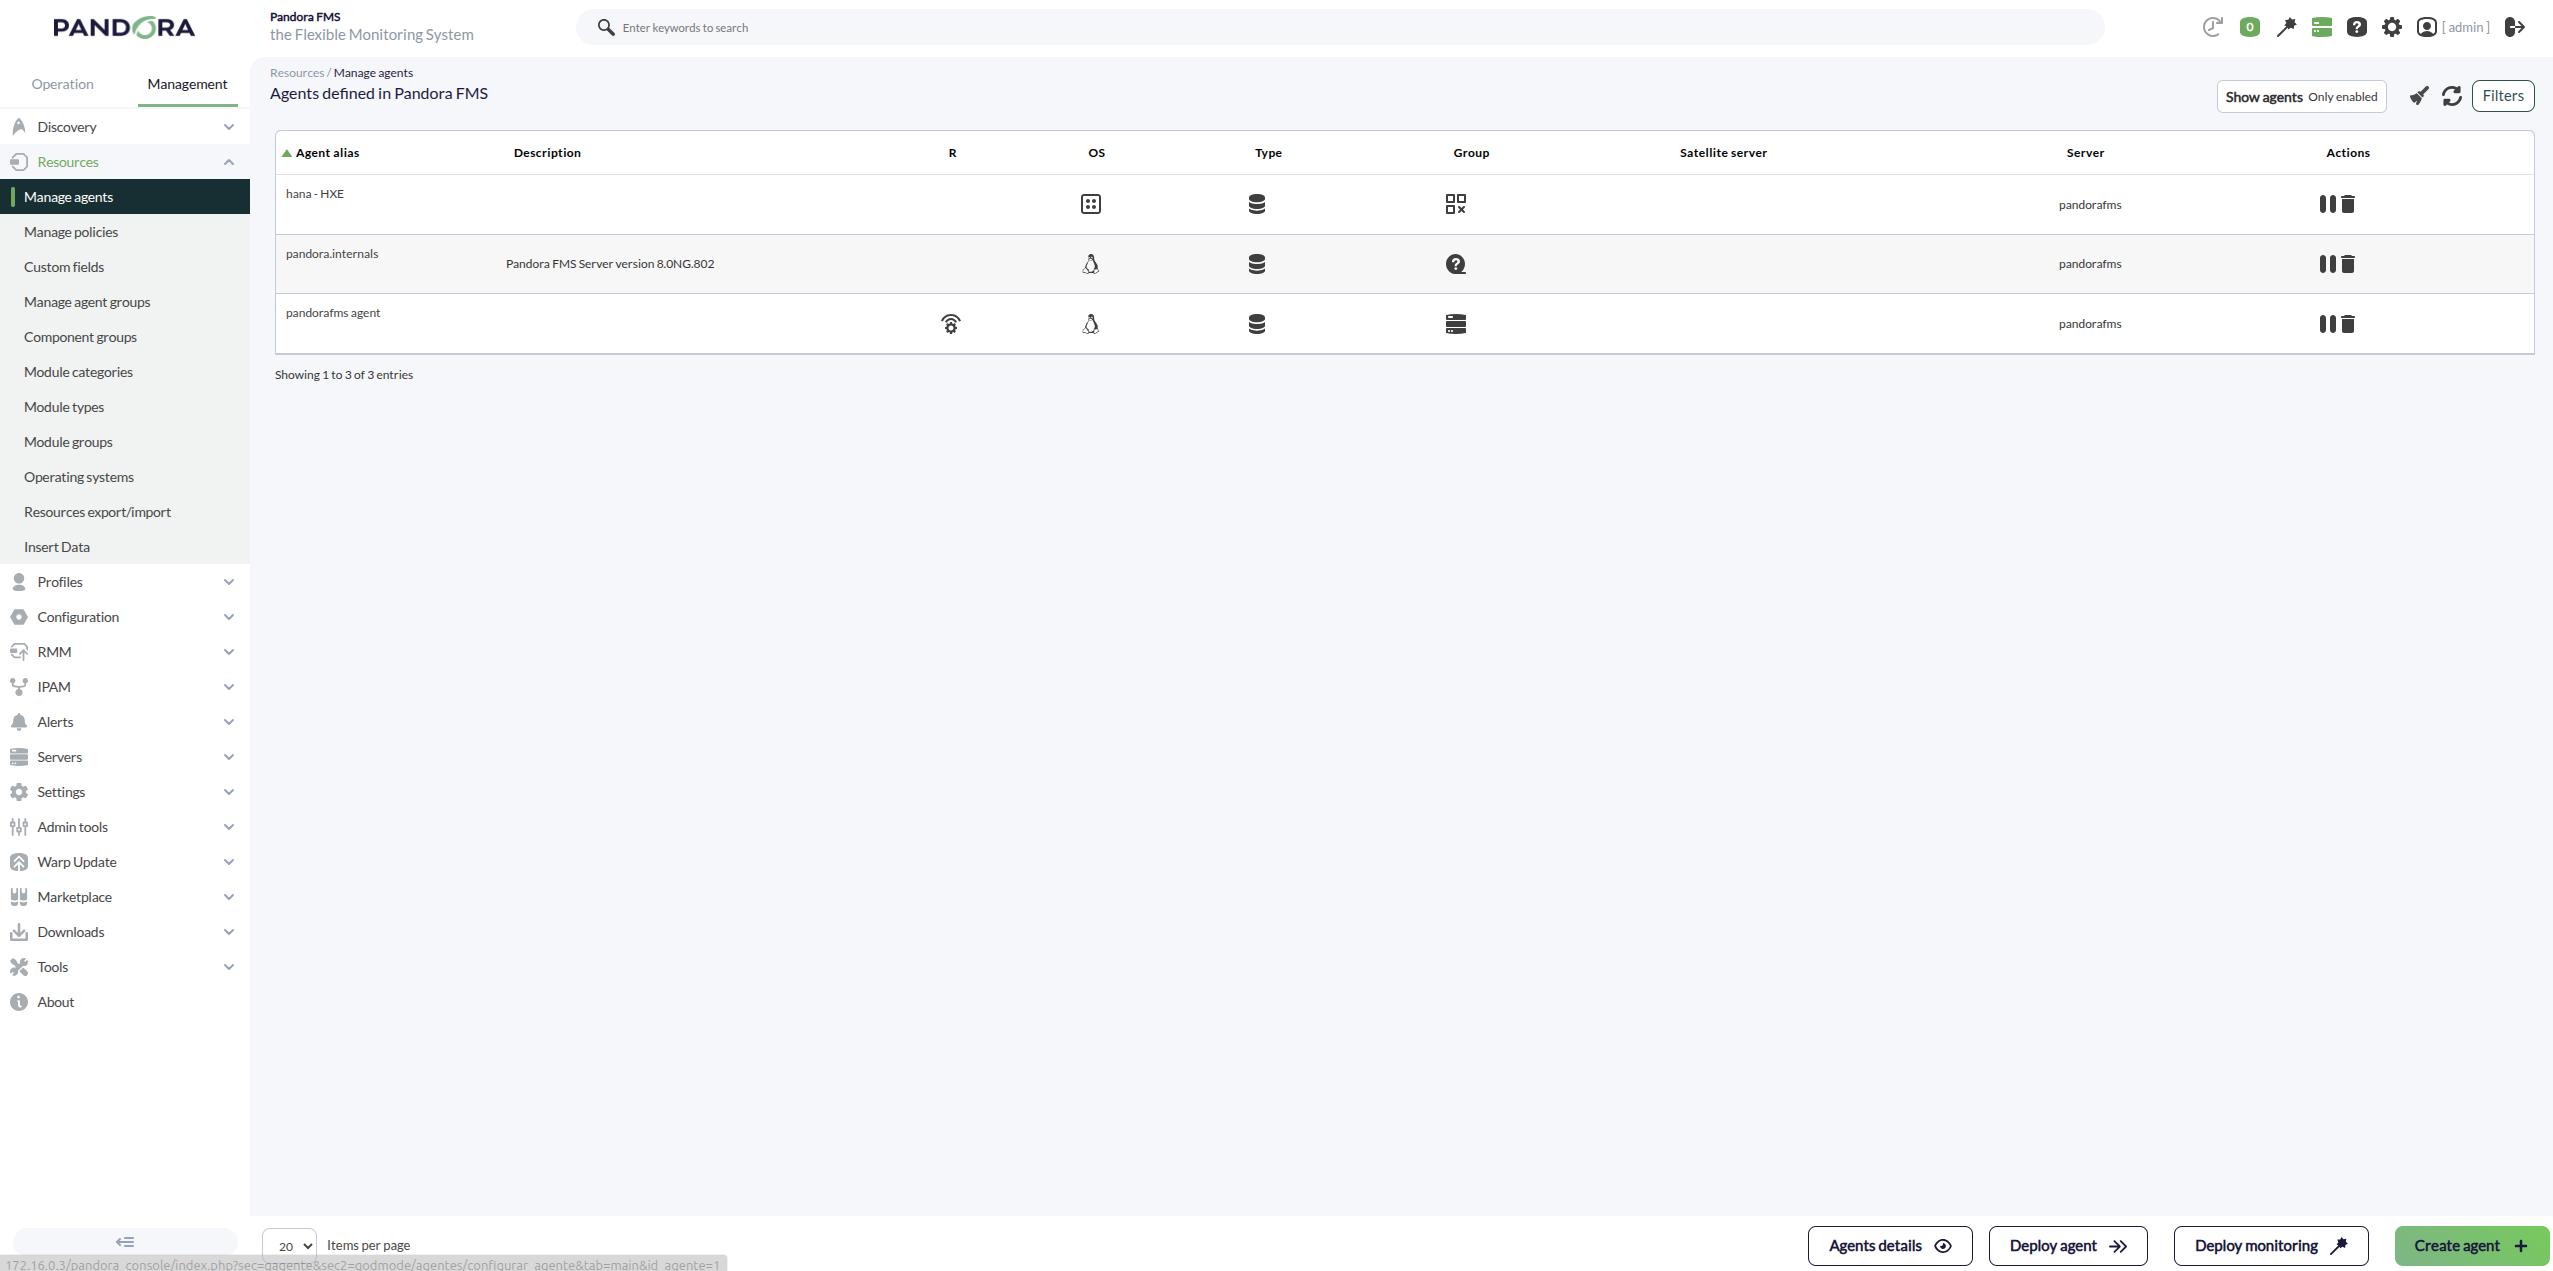
The modules of the SAP HANA host will be as follows:
Enable Backups Size
| Module | Description |
| backups_estimated_size_bytes | Estimated SAP HANA database backup size. |
Enable Timestamp
| Module | Description |
| timestamp | Current database timestamp used for time synchronization validation. |
Enable Hana Version
| Module | Description |
| version | Installed SAP HANA version. |
Enable Data Disk Information
| Module | Description |
| volumes_count | Total number of detected SAP HANA data volumes. |
| volumes_io_entries | Number of detected I/O volume entries. |
Enable Hana Service Statistics
| Module | Description |
| ACTIVE_STATUS | Current service active status. |
| PROCESS_CPU_TIME | CPU time consumed by the service process. |
| TOTAL_CPU_TIME | Total CPU time consumed by the service. |
| PROCESS_MEMORY | Memory currently used by the service process. |
| TOTAL_MEMORY | Total memory allocated to the service. |
| AVAILABLE_MEMORY | Available memory reported by the service. |
| ACTIVE_REQUEST_COUNT | Number of currently active requests. |
| PENDING_REQUEST_COUNT | Number of pending service requests. |
| ACTIVE_THREAD_COUNT | Number of active service threads. |
| THREAD_COUNT | Total number of service threads. |
| OPEN_FILE_COUNT | Number of open files used by the service. |
| REQUESTS_PER_SEC | Requests processed per second. |
| RESPONSE_TIME | Average service response time. |
| START_TIME | Service startup timestamp. |
| SYS_TIMESTAMP | Current system timestamp reported by the service. |
Enable Hana CPU Time
| Module | Description |
| cpu_total_time_ms | Aggregated total CPU time across SAP HANA services. |
| cpu_process_time_ms | Aggregated process CPU time across SAP HANA services. |
| cpu_service_count | Number of services included in CPU statistics. |
Enable Hana RS Fragmentation
| Module | Description |
| rowstore_fragmentation_pct | Estimated Row Store fragmentation percentage. |
Enable Hana License
| Module | Description |
| license_expiration_date | License expiration date. |
| license_days_remaining | Remaining days until license expiration. |
| license_memory_limit | Configured memory limit for the license. |
| license_hardware_key | Hardware key associated with the license. |
| license_installation_number | License installation identifier. |
| license_product_name | Licensed SAP HANA product name. |
| license_system_id | SAP HANA system identifier. |
| license_swproductname | Licensed software product name. |
| license_enforced | Indicates whether license enforcement is enabled. |
Enable Hana IO Stats
| Module | Description |
| io_total_read_bytes | Total bytes read from disk. |
| io_total_write_bytes | Total bytes written to disk. |
| io_total_time_ms | Total accumulated disk I/O time. |
Enable Hana Get Stated Connections
| Module | Description |
| connections_total | Total number of database connections. |
| connections_running | Number of active running connections. |
| connections_idle | Number of idle connections. |
| connections_queued | Number of queued connections. |
| connections_disconnected | Number of disconnected sessions. |
| connections_unknown | Connections with unknown status. |
Enable Hana Memory
| Module | Description |
| memory_used_bytes | Total SAP HANA memory currently in use. |
| memory_allocation_limit_bytes | Configured SAP HANA memory allocation limit. |
Enable Hana Transactions
| Module | Description |
| blocked_transactions | Total number of blocked transactions. |
| blocked_transactions_distinct_users | Number of distinct users with blocked transactions. |
| open_transactions | Total number of currently open transactions. |
Execute Custom Queries
| Module | Description |
| Custom user-defined modules | Modules dynamically generated from configured custom queries. |