HP One View Discovery
This document describes the HP One View functionality of PandoraFMS.
- Introduction
- Pre requisites
- Parameters
- Manual execution
- Discovery
- Agent, modules and alerts generated by the plugin
Introduction
This plugin allows you to monitor physical environments managed by HP OneView, collecting key information about servers, chassis, and the overall status of the system. It extracts metrics such as device health status, power status, presence of critical or blocking errors, and a summary of active or maintenance alerts.
It also collects information about the HP OneView appliance itself, including its version, operational status, and any detected issues. All this data is transformed into Pandora FMS-compatible modules, enabling centralized and accurate monitoring of the hardware managed by the platform. This solution facilitates continuous control of the infrastructure, helping to detect hardware failures, pending alerts, and other relevant events in real time.
Pre requisites
- The system running the plugin must have connectivity and be able to remotely access the HP One View environment.
Parameters
| --conf | Ruta al archivo de configuración |
agents_group_name= < Group for created agents >
interval= < Agent creation interval >
transfer_mode= < Agent transfer mode >
prefix = < Prefix for created agents >
ip= < IP of the HP One View environment >
user= < HP One View environment user >
password= < HP One View environment password >
tentacle_ip= < Tentacle IP >
tentacle_port= < Tentacle port >
server_conf= < Pandora server conf path (required to retrieve database credentials)>
events_id_group= < Group for created events >
api_url= < API URL >
token_api= < API token >
scan_alerts= < Set to 1 to enable alert scanning >
scan_appliances= < Set to 1 to enable appliance scanning >
scan_servers= < Set to 1 to enable server scanning >
Ejemplo
agents_group_name= Servers
interval=300
transfer_mode=tentacle
prefix = mad
ip= 172.78.11.03
user=admin
password=W4rr!0R
tentacle_ip=127.0.0.1
tentacle_port=41121
server_conf= /etc/pandora/pandora_server.conf
events_id_group= 6
api_url= http://172.42.42.101/pandora_console/
token_api= dnaf78av8f9a8fac98caca8c9a7c
scan_alerts= 1
scan_appliances= 1
scan_servers= 1
Manual execution
The format for executing the plugin is as follows:
./pandora_hponeview --conf < path to the configuration file >For example:
./pandora_hponeview --conf /usr/share/pandora_server/util/plugin/hp_one_view.confThe execution will return output in JSON format with information about the execution, and will generate an XML file for each monitored agent that will be sent to the Pandora FMS server using the transfer method specified in the configuration.
Discovery
This plugin can be integrated with Pandora FMS Discovery.
To do so, you must load the “.disco” package, which can be downloaded from the Pandora FMS library:
https://pandorafms.com/library/
Once loaded, Meraki environments can be monitored by creating Discovery tasks from the Management > Discovery > App section.
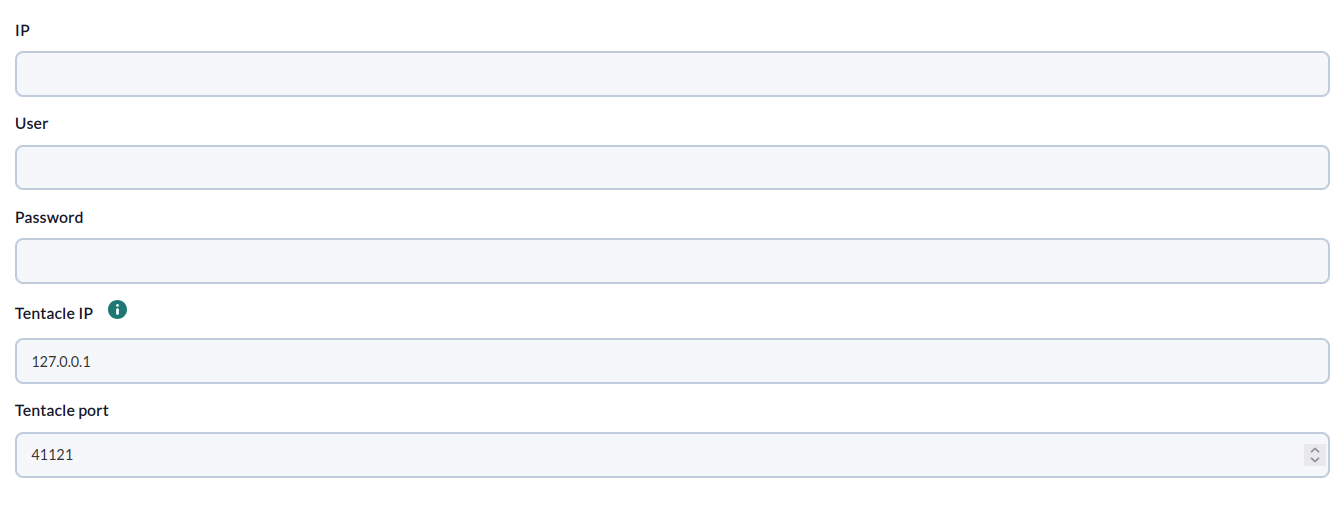
For each task, the following minimum information will be requested:
- IP: IP address of the hp one view environment
- User: User of the hp one view environment
- Password: Password of the user of the hp one view environment
- Tentacle IP: Tentacle IP
- Tentacle port: Tentacle Port
On the next page, we will be asked for the following:
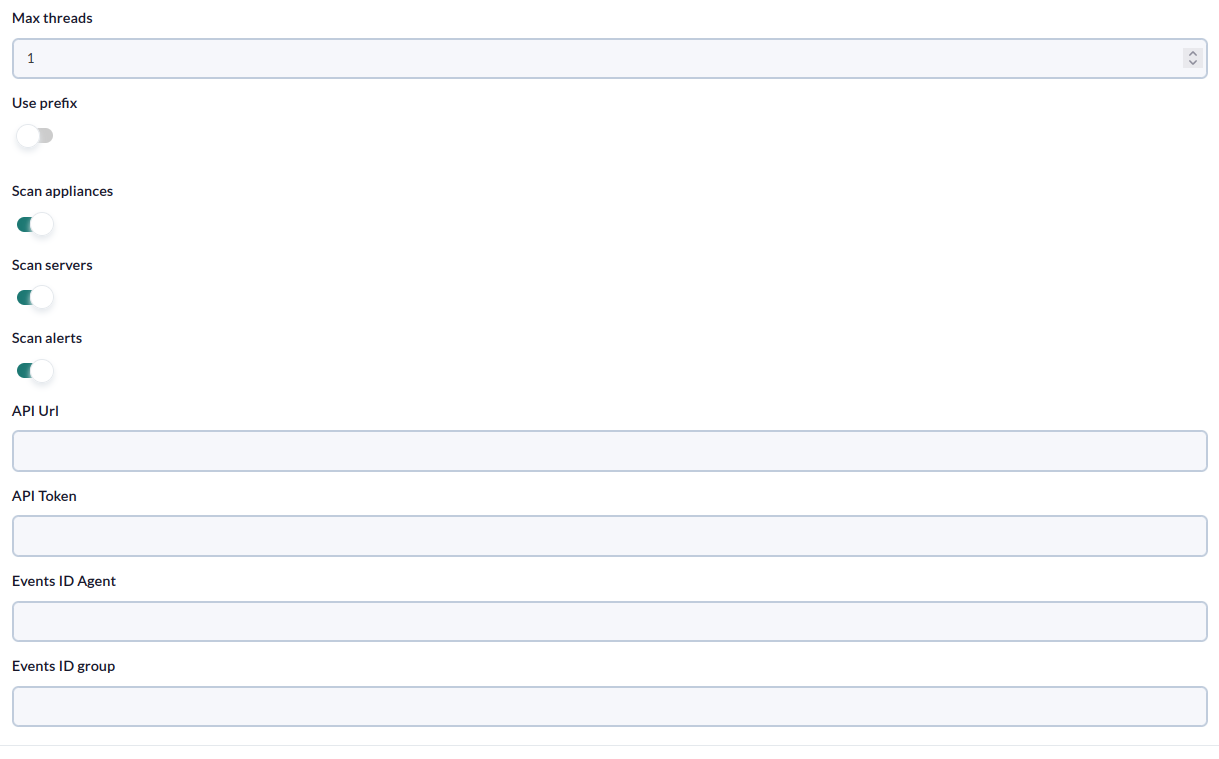
- Max Threads: Prefix for agents.
- Prefix: Prefix for modules.
- Scan appliances: Enable to create an appliance agent that will contain resource statistics.
- Scan servers: Enable to create an agent for each server.
- Scan alerts: Enable to enable the creation of events for each “active” or “locked” alert.
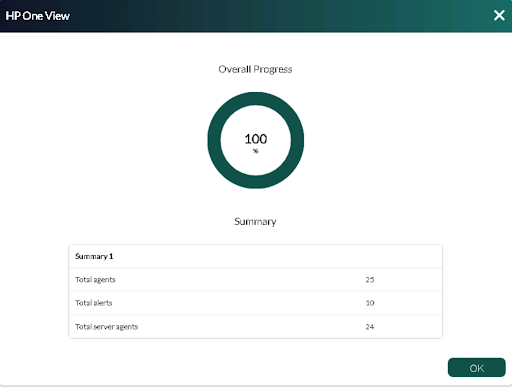
Successfully completed tasks will have an execution summary with the following information:
- Total agents : Total number of agents generated by the task.
- Total alerts: Total number of alerts created by the task.
- Total server agents: Total number of server agents generated by the task.
Agent, modules and alerts generated by the plugin
Running the plugin will create the following agents and modules:
One agent per server
-
<prefix> Status -
<prefix>State -
<prefix> PowerState
An Appliance agent
-
<prefix> <resource_id> <resource_type}> available -
<prefix> <resource_id> <resource_type}> capacity <prefix> <resource_id> <resource_type}> used percent
Within the Appliance agent, an event will be created for each alert with alertState Locked or alertState active.