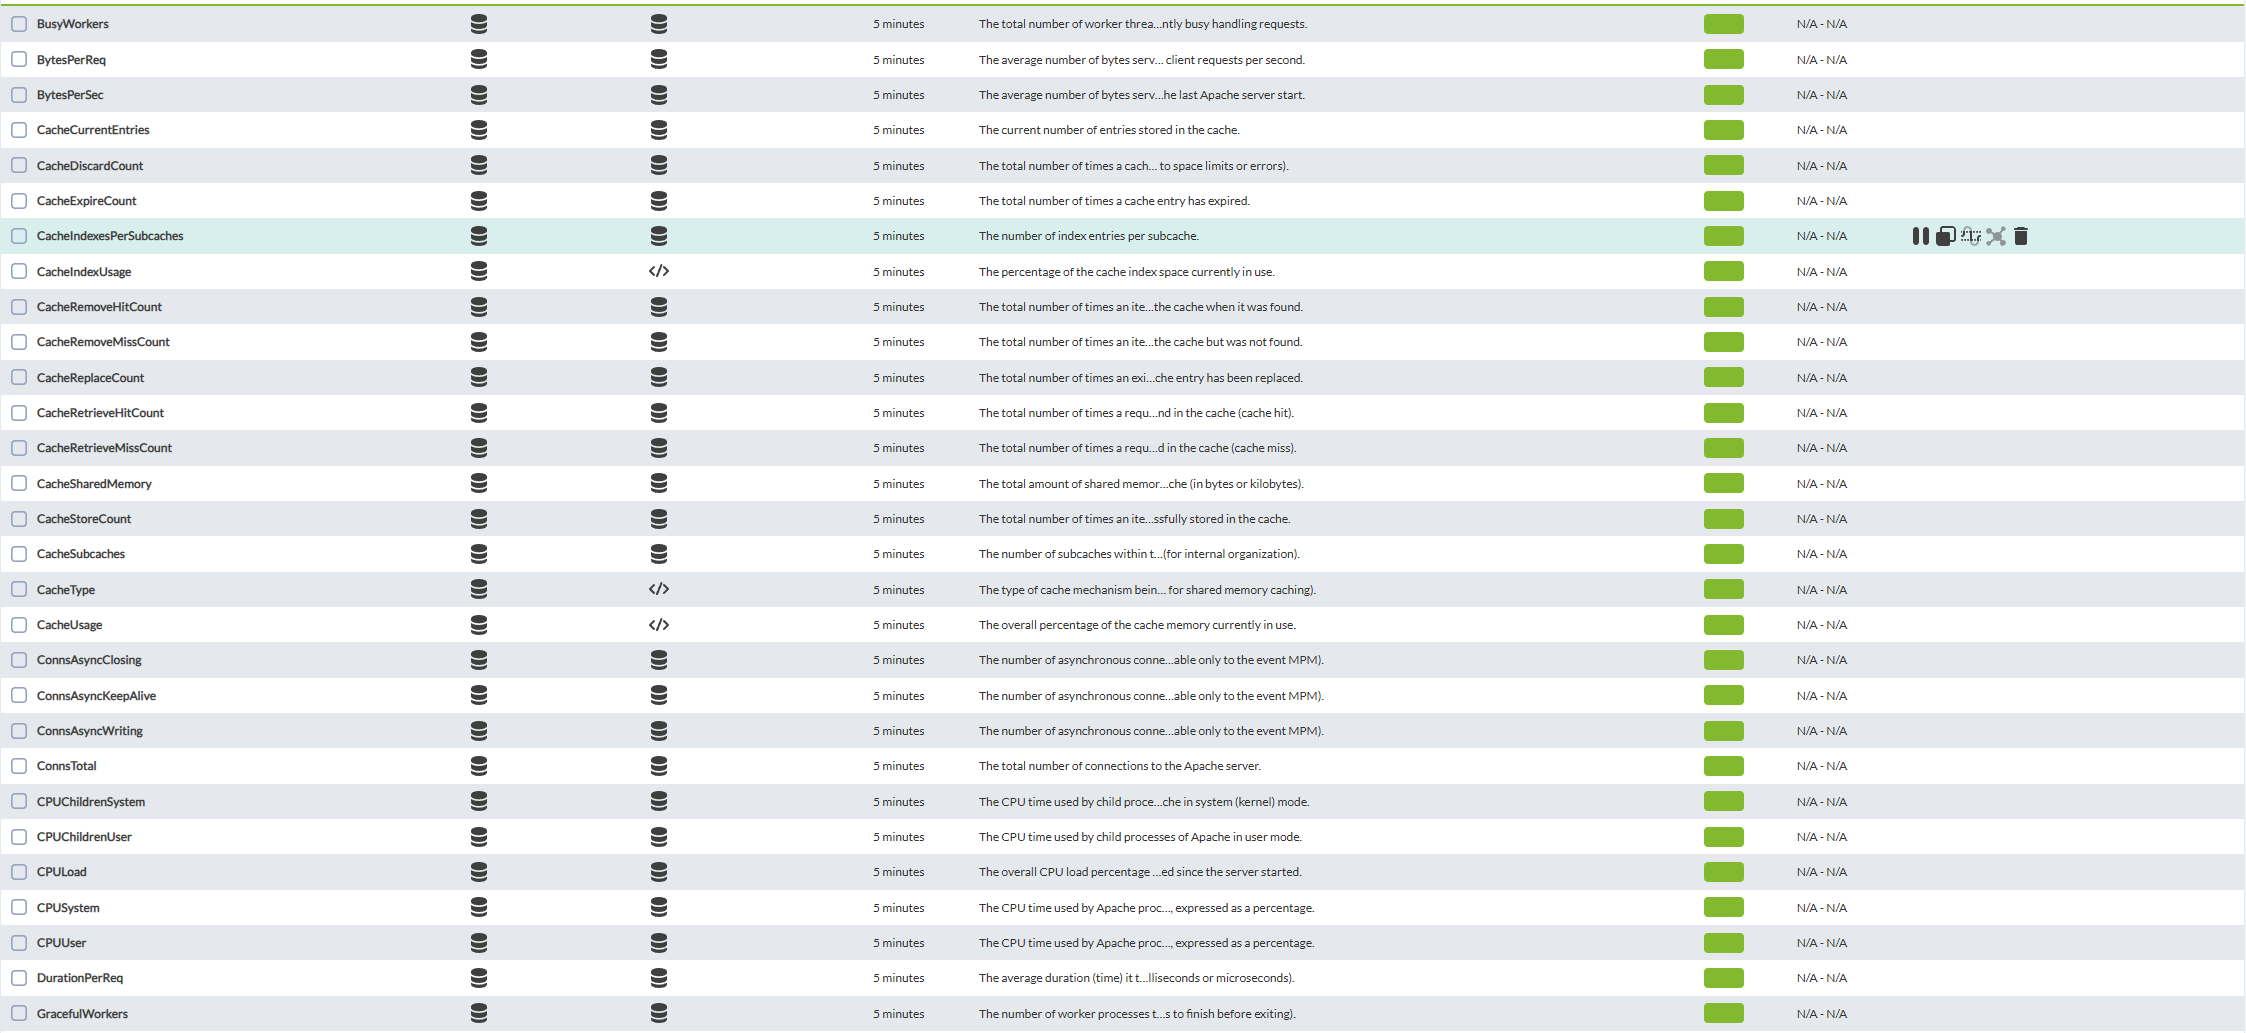
Agent and modules generated by the plugin
The plugin will create one agent for every HAProxy URL configured. The agent name is computed as an agent,MD5 eachhash instance withof the nameURL taken from the URL. If it's in advanced mode, it will create the number of agents depending on the blocks sent,netloc, and the namealias willis beset definedto bythat thesame netloc (for example, 192.168.0.10:8404). Each agent name field. Otherwise, it will also take the name from the URL if no name is specified. It will containincludes the modules obtained by interactingparsing withthe HAProxy CSV stats endpoint.
The status module is created always for every row, regardless of the monitor tokens, in order to alert on DOWN/MAINT/STOP states. The remaining numeric fields are included as generic_data (integer/decimal) or generic_data_string (string) modules, following the format <pxname>_<svname>_<field>.
The main fields available in the HAProxy CSV that generate modules are:
pxname: Proxy name (frontend/backend/listener).
svname: Service name (FRONTEND/BACKEND/server name).
qcur: Current queued requests.
qmax: Max queued requests.
scur: Current sessions.
smax: Max sessions.
slim: Configured session limit.
stot: Cumulative sessions.
bin: Bytes in.
bout: Bytes out.
dreq: Requests denied (security).
dresp: Responses denied (security).
ereq: Request errors.
econ: Connection errors to backend.
eresp: Response errors.
wretr: Connection retries.
wredis: Redispatches to another server.
status: Status (UP/DOWN/MAINT/STOP/...) — always monitored.
weight: Total weight / server weight.
act: Active servers (backend) / server active.
bck: Backup servers (backend) / server backup.
chkfail: Failed health checks.
chkdown: UP->DOWN transitions.
lastchg: Seconds since last UP<->DOWN transition.
downtime: Total downtime (seconds).
qlimit: Configured maxqueue for the server.
pid: Process ID.
iid: Unique proxy ID.
sid: Server ID (unique inside the proxy).
throttle: Current throttle percentage.
lbtot: Times the server statuswas page.selected.
Thetracked: modulesID toof beproxy/server createdif aretracking asis follows:enabled.
ServerVersion:Thetype: Apache service versionType (e.g.,0=frontend, Apache/2.4.62)1=backend, 2=server, 3=socket).,
ServerMPM:Therate: Multi-ProcessingSessions Moduleper second (MPM)last currentlysecond).
inrate_lim: useConfigured bylimit Apacheon (e.g.,new event,sessions/s.
prefork,rate_max: worker).,Max Serversessions Built:Theper datesecond.
andcheck_status: time when the Apache server binary was compiled.,
ParentServerConfigGeneration:The configuration generationStatus of the parentlast Apachehealth process.check.
Incrementscheck_code: withLayer each5-7 gracefulcheck restart.,code.
ParentServerMPMGeneration:Thecheck_duration: MPMTime generationin ms of the parentlast Apachehealth process.,check.
ServerUptimeSeconds:Thehrsp_1xx: serviceHTTP uptimeresponses expressedwith in1xx seconds.,code.
Load1:Thehrsp_2xx: systemHTTP loadresponses averagewith 2xx code.
hrsp_3xx: HTTP responses with 3xx code.
hrsp_4xx: HTTP responses with 4xx code.
hrsp_5xx: HTTP responses with 5xx code.
hrsp_other: HTTP responses with other codes.
hanafail: Failed health checks details.
req_rate: HTTP requests per second.
req_rate_max: Max HTTP requests per second.
req_tot: Total HTTP requests received.
cli_abrt: Data transfers aborted by the client.
srv_abrt: Data transfers aborted by the server.
comp_in: HTTP response bytes fed to the compressor.
comp_out: HTTP response bytes emitted by the compressor.
comp_byp: Bytes that bypassed the HTTP compressor.
comp_rsp: HTTP responses that were compressed.
lastsess: Seconds since the last session was assigned.
last_chk: Last health check contents/error.
last_agt: Last agent check contents/error.
qtime: Average queue time (ms) over the last 11024 minute.,requests.
Load5:Thectime: systemAverage loadconnect averagetime (ms) over the last 51024 minutes.,requests.
Load15:Thertime: systemAverage loadresponse averagetime (ms) over the last 151024 minutes.,requests.
Totalttime: Accesses:TheAverage total session time (ms) over the last 1024 requests.
agent_status: Status of the last agent check.
agent_code: Numeric code reported by the agent.
agent_duration: Time in ms of the last agent check.
check_desc: Human-readable description of check_status.
agent_desc: Human-readable description of agent_status.
check_rise: Server's rise parameter used by checks.
check_fall: Server's fall parameter used by checks.
check_health: Server's health check value.
agent_rise: Agent's rise parameter.
agent_fall: Agent's fall parameter.
agent_health: Agent's health parameter.
addr: Address:port or unix socket.
cookie: Server's cookie value or backend's cookie name.
mode: Proxy mode (tcp, http, health, unknown).
algo: Load balancing algorithm.
conn_rate: Connections over the last elapsed second.
conn_rate_max: Highest known conn_rate.
conn_tot: Cumulative number of clientconnections.
requestsintercepted: receivedCumulative intercepted requests.
dcon: Requests denied by thetcp-request serverconnection sincerules.
itsdses: lastRequests start/restart.denied Itby tcp-request session rules.

The status module is calculatedtranslated asto a ratenumeric ofvalue change for the Total requests statistics.,
Total kBytes:The total kilobytes of data served by the Apache server since its last start/restart.,
Total Duration:The cumulative time spent processing all requests since the server started (in microseconds or milliseconds, depending on Apache version and configuration). This can be higher than Uptime because multiple processes/threads can be active simultaneously.,
CPUUser:The CPU time used by Apache processes in user mode since the server started, expressed as a percentage.,
CPUSystem:The CPU time used by Apache processes in system (kernel) mode since the server started, expressed as a percentage.,
CPUChildrenUser:The CPU time used by child processes of Apache in user mode.,
CPUChildrenSystem:The CPU time used by child processes of Apache in system (kernel) mode.,
CPULoad:The overall CPU load percentage consumed by all Apache processes combined since the server started.,
Uptime:The human-readable representation of the server's uptime (e.g., '2 days 4 hours 40 minutes'). This is derived from ServerUptimeSeconds.,
ReqPerSec:The average number of requests served per second since the server was started/restarted. ReqPerSec is not used, as it counts the average since the last Apache server start.,
BytesPerSec:The average number of bytes served per second since the server was started/restarted. BytesPerSec is not used, as it counts the average since the last Apache server start.,
BytesPerReq:The average number of bytes served per request since the server was started/restarted. The average number of client requests per second., # Note: The Zabbix description for BytesPerReq seems to confuse it with ReqPerSec. BytesPerReq is bytes per request.
DurationPerReq:The average duration (time) it took to serve each request since the server was started/restarted (in milliseconds or microseconds).,
BusyWorkers:The total number of worker threads/processes that are currently busy handling requests.,
GracefulWorkers:The number of worker processes that are currently in a graceful shutdown state (waiting for current requests to finish before exiting).,
IdleWorkers:The total number of worker threads/processes that are currently idle and ready to handle new requests.,
Processes:The number of active Apache processes (not threads) currently running.,
Stopping:The number of worker processes that are in a stopping state.,
ConnsTotal:The total number of connectionsaccording to the Apachefollowing server.,mapping: ConnsAsyncWriting:The5=UP, number4=OPEN, of3=NOLB, asynchronous2=MAINT, connections1=STOP/STOPPING, in0=DOWN, writingwhich stateallows configuring alerts based on warning (applicable2-4) onlyand to the event MPM).,
ConnsAsyncKeepAlive:The number of asynchronous connections in keep-alive statecritical (applicable0-2) only to the event MPM).,
ConnsAsyncClosing:The number of asynchronous connections in closing state (applicable only to the event MPM).,
CacheType:The type of cache mechanism being used by Apache (e.g., SHMCB for shared memory caching).,
CacheSharedMemory:The total amount of shared memory allocated for the cache (in bytes or kilobytes).,
CacheCurrentEntries:The current number of entries stored in the cache.,
CacheSubcaches:The number of subcaches within the main cache (for internal organization).,
CacheIndexesPerSubcaches:The number of index entries per subcache.,
CacheIndexUsage:The percentage of the cache index space currently in use.,
CacheUsage:The overall percentage of the cache memory currently in use.,
CacheStoreCount:The total number of times an item has been successfully stored in the cache.,
CacheReplaceCount:The total number of times an existing cache entry has been replaced.,
CacheExpireCount:The total number of times a cache entry has expired.,
CacheDiscardCount:The total number of times a cache entry has been discarded (e.g., due to space limits or errors).,
CacheRetrieveHitCount:The total number of times a requested item was found in the cache (cache hit).,
CacheRetrieveMissCount:The total number of times a requested item was not found in the cache (cache miss).,
CacheRemoveHitCount:The total number of times an item was successfully removed from the cache when it was found.,
CacheRemoveMissCount:The total number of times an item was attempted to be removed from the cache but was not found.