HAProxy Discovery
This document describes the use of discovery plugin for HA proxy
- Introduction
- Prerrequisites
- HAProxy Configuration
- Parameters
- Manual execution
- Discovery
- Agent and modules generated by the plugin
Introduction
This HAProxy discovery plugin for Pandora FMS is designed to automate the monitoring of your HAProxy load balancers by leveraging the detailed information exposed by the CSV stats endpoint (/stats;csv). By interacting with that endpoint, the plugin collects real-time metrics that are crucial to understanding the performance and health of your HAProxy environment, including sessions, transferred bytes, errors, queues, health checks, and much more. For every HAProxy URL configured, the plugin will create one agent in Pandora FMS with one module per available metric.
Prerrequisites
- The plugin is distributed as a compiled binary that already includes all the dependencies required for its use, so it does not require Python or any additional libraries to be installed.
- The HAProxy stats endpoint must be enabled and reachable (port and URI configured in
haproxy.cfg). See the HAProxy Configuration section for the required steps.
HAProxy Configuration
In order for the plugin to gather statistics, HAProxy must expose the /stats;csv endpoint. This is done by editing the haproxy.cfg file (default location: /etc/haproxy/haproxy.cfg).
Minimum configuration (no authentication, no SSL)
Add a dedicated frontend for statistics:
frontend stats
    bind *:8404
    stats enable
    stats uri /stats
    stats refresh 10s
With this configuration the plugin will consume the URL:
http://<SERVER_IP>:8404/stats
The plugin automatically normalizes the URL by appending the
;csvsuffix and thenorefreshparameter when missing, so it is enough to provide the base stats URL.
Configuration with basic authentication
To protect the endpoint with a username and password, define a userlist and apply http-request auth on the stats frontend:
frontend stats
    bind *:8404
    stats enable
    stats uri /stats
    stats refresh 10s

    acl auth_ok http_auth(stats_users)
    http-request auth realm stats if !auth_ok

userlist stats_users
    user admin password $6$rounds=5000$<SHA512_HASH>
Generate the password hash with mkpasswd or openssl:
mkpasswd -m sha-256 mypassword
# or
openssl passwd -6 mypassword
In the plugin, the same username and password must be provided through --user / --password (or the username / password fields in the configuration file).
Configuration with SSL/TLS
To serve the stats over HTTPS, add ssl crt to the bind directive:
frontend stats
    bind *:8404 ssl crt /etc/haproxy/certs/stats.pem
    stats enable
    stats uri /stats
    stats refresh 10s
Generate a self-signed certificate for testing with:
openssl req -x509 -nodes -days 365 -newkey rsa:2048 \
  -keyout /etc/haproxy/certs/stats.key \
  -out /etc/haproxy/certs/stats.crt \
  -subj "/CN=localhost"
cat /etc/haproxy/certs/stats.crt /etc/haproxy/certs/stats.key > /etc/haproxy/certs/stats.pem
In the plugin, point to the URL with the https:// scheme and set the --ssl (or verify_ssl) parameter depending on whether the certificate should be validated:
-
verify_ssl = true→ for valid certificates in production. -
verify_ssl = false→ for self-signed certificates or testing environments.
Complete configuration (SSL + authentication)
global
    maxconn 4096

defaults
    mode http
    timeout connect 5s
    timeout client 30s
    timeout server 30s

frontend stats
    bind *:8404 ssl crt /etc/haproxy/certs/stats.pem
    stats enable
    stats uri /stats
    stats refresh 10s
    stats admin if TRUE

    acl auth_ok http_auth(stats_users)
    http-request auth realm stats if !auth_ok

userlist stats_users
    user admin password $6$rounds=5000$<SHA512_HASH>

frontend myapp
    bind *:80
    default_backend servers

backend servers
    server s1 127.0.0.1:8080 check
After modifying haproxy.cfg, reload the service to apply the changes:
sudo systemctl reload haproxy
Verification
To confirm that the endpoint is responding correctly, you can make a manual request to the stats CSV:
curl -u admin:mypassword http://192.168.0.10:8404/stats;csv
The output must be a CSV whose first record is the header with the column names (# pxname,svname,qcur,qmax,...) and the following rows contain the data of each frontend, backend and server.
Parameters
Simple mode
| --urls | HAProxy stats endpoint URLs, comma-separated. Each URL will create one agent. |
| --user | username if the HAProxy endpoint requires basic authentication, optional |
| --password | password if the HAProxy endpoint requires basic authentication, optional |
| --ssl | whether the URL has an HTTPS certificate to be verified, optional |
| --prefix | prefix for the module names, optional |
| --transfer_mode | data transfer mode (native or tentacle), optional |
| --tentacle_ip | tentacle IP, optional |
| --tentacle_port | tentacle port, optional |
| --interval | monitoring interval in seconds, optional |
| --allow_list | regular expression to include only modules whose name matches, optional |
| --deny_list | regular expression to exclude modules whose name matches, optional |
| --monitor_frontends | monitor frontend rows (type=0), optional |
| --monitor_backends | monitor backend rows (type=1), optional |
| --monitor_servers | monitor server rows (type=2), optional |
Advanced mode
| --conf | path to the configuration file |
| --conf_targets | path to the file with the HAProxy URLs (mandatory when using --conf) |
Configuration file (--conf)
username= username if the HAProxy endpoint requires basic authentication, optional
password= password if the HAProxy endpoint requires basic authentication, optional
verify_ssl= whether the URL has an HTTPS certificate to be verified, optional
prefix= prefix for the module names, optional
transfer_mode= data transfer mode (native or tentacle), optional
tentacle_ip= tentacle IP, optional
tentacle_port= tentacle port, optional
agents_group= name of the agent group the created agents will be assigned to, optional
agents_group_id= ID of the agent group the created agents will be assigned to, optional
interval= monitoring interval in seconds, optional
allow_list= regular expression to include only modules whose name matches, optional
deny_list= regular expression to exclude modules whose name matches, optional
monitor_frontends= monitor frontend rows (type=0), optional
monitor_backends= monitor backend rows (type=1), optional
monitor_servers= monitor server rows (type=2), optional
Example
[CONF]
username=admin
password=12345
verify_ssl=true
prefix=haproxy_
transfer_mode=native
tentacle_ip=127.0.0.1
tentacle_port=41121
interval=300
allow_list=
deny_list=.*_wredis|.*_wretr
monitor_frontends=true
monitor_backends=true
monitor_servers=true
Targets file (--conf_targets):
http://192.168.0.10:8404/stats
http://192.168.0.11:8404/stats
Manual execution
The plugin execution format is as follows:
./pandora_haproxy --urls <HAProxy endpoint URLs comma-separated> --user <username> --password <password> --ssl <true|false> --prefix <prefix> --transfer_mode <native|tentacle> --tentacle_ip <tentacle IP> --tentacle_port <tentacle port> --interval <interval> --allow_list <regex> --deny_list <regex> --monitor_frontends <true|false> --monitor_backends <true|false> --monitor_servers <true|false> --conf <path to configuration file> --conf_targets <path to URLs file>
Examples:
to run the simple mode
./pandora_haproxy --urls http://192.168.0.10:8404/stats,http://192.168.0.11:8404/stats --user admin --password 12345 --ssl false --transfer_mode native --tentacle_ip 127.0.0.1 --tentacle_port 41121
to run the advanced mode
./pandora_haproxy --conf /etc/pandora/haproxy.conf --conf_targets /etc/pandora/haproxy_targets.conf
The execution will return a JSON output with information about the run, and will generate an XML file for every monitored agent (in tentacle mode) that will be sent to the Pandora FMS server using the transfer method configured. In native mode the data is exposed in the monitoring_data field of the JSON output to be consumed by the Discovery server.
Discovery
This plugin can be integrated with Pandora FMS Discovery.
To do so, the ".disco" package must be loaded. It can be downloaded from the Pandora FMS library:
https://pandorafms.com/library/
Once loaded, HAProxy instances can be monitored by creating Discovery tasks from the Management > Discovery > Application > HAProxy section.
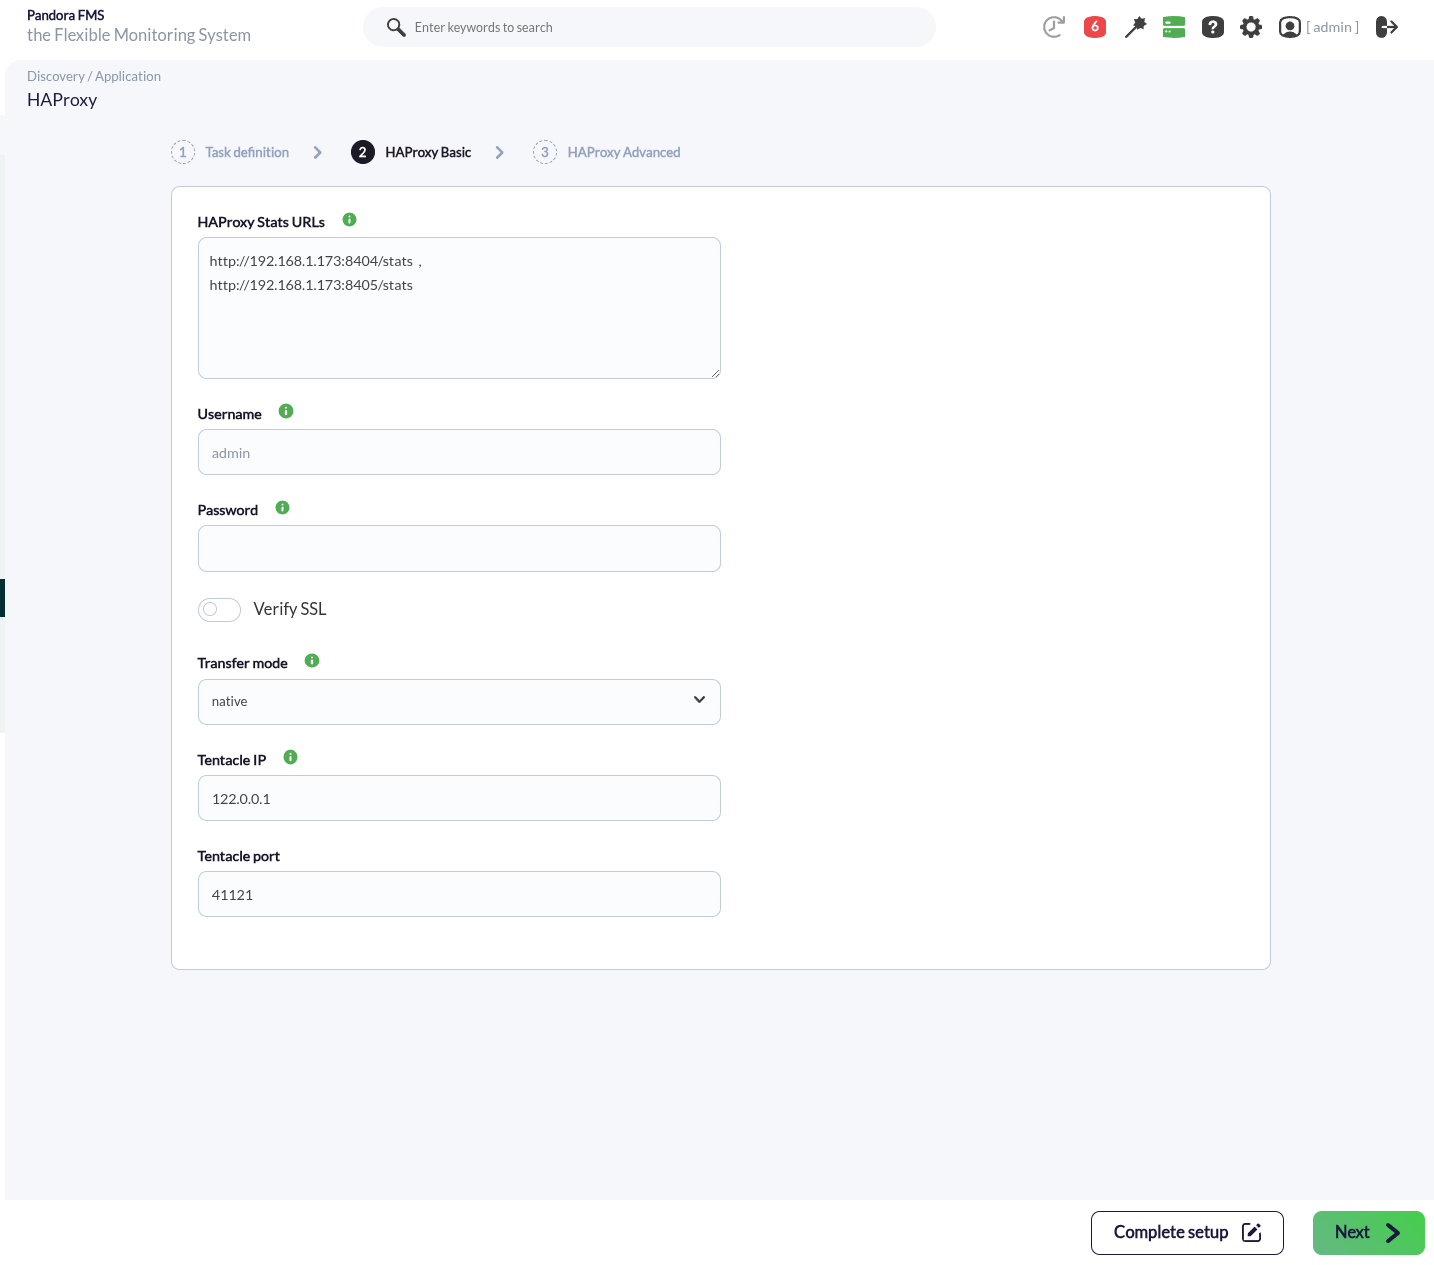
Each task will require the following minimum data in the HAProxy Basic step:
- HAProxy Stats URLs: HAProxy stats endpoint URLs, comma-separated or one per line. Each URL will create one agent.
- Username: HAProxy endpoint user if basic authentication is required, optional
- Password: HAProxy endpoint password if basic authentication is required, optional
- Verify SSL: enabled if the URL has an SSL certificate to be verified, disabled by default
- Transfer mode: transfer mode (native or tentacle), optional
- Tentacle IP: tentacle IP, optional
- Tentacle port: Tentacle port, optional
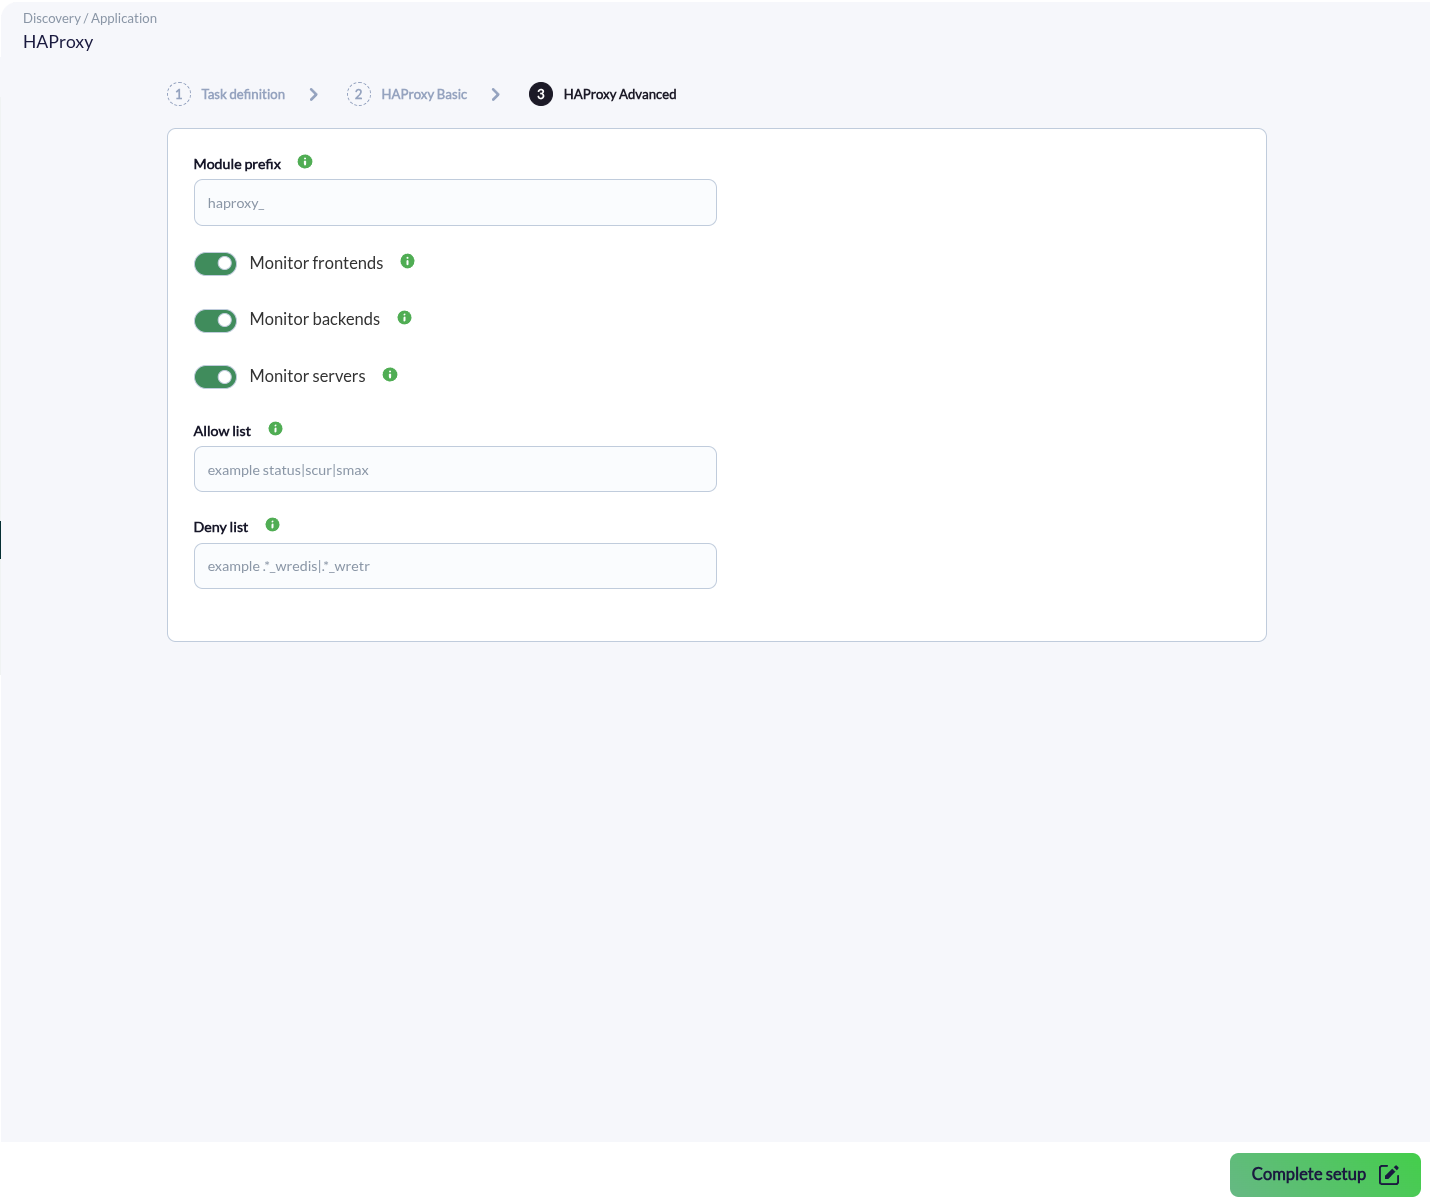
In the HAProxy Advanced step the following additional options can be configured:
- Module prefix: prefix to be added to every created module name, optional
- Monitor frontends: enables monitoring of frontend rows (type=0), optional
- Monitor backends: enables monitoring of backend rows (type=1), optional
- Monitor servers: enables monitoring of server rows (type=2), optional
- Allow list: regular expression to include only modules whose name matches, optional
- Deny list: regular expression to exclude modules whose name matches, optional
Successfully completed tasks will have an execution summary with the following information:
- Total agents: Total number of agents generated by the task.
- Total modules: Total number of modules generated by the task.
Agent and modules generated by the plugin
The plugin will create one agent for every HAProxy URL configured. The agent name is computed as an MD5 hash of the URL netloc, and the alias is set to that same netloc (for example, 192.168.0.10:8404). Each agent includes the modules obtained by parsing the HAProxy CSV stats endpoint.
The status module is created always for every row, regardless of the monitor tokens, in order to alert on DOWN/MAINT/STOP states. The remaining numeric fields are included as generic_data (integer/decimal) or generic_data_string (string) modules, following the format <pxname>_<svname>_<field>.
The main fields available in the HAProxy CSV that generate modules are:
pxname: Proxy name (frontend/backend/listener).
svname: Service name (FRONTEND/BACKEND/server name).
qcur: Current queued requests.
qmax: Max queued requests.
scur: Current sessions.
smax: Max sessions.
slim: Configured session limit.
stot: Cumulative sessions.
bin: Bytes in.
bout: Bytes out.
dreq: Requests denied (security).
dresp: Responses denied (security).
ereq: Request errors.
econ: Connection errors to backend.
eresp: Response errors.
wretr: Connection retries.
wredis: Redispatches to another server.
status: Status (UP/DOWN/MAINT/STOP/...) — always monitored.
weight: Total weight / server weight.
act: Active servers (backend) / server active.
bck: Backup servers (backend) / server backup.
chkfail: Failed health checks.
chkdown: UP->DOWN transitions.
lastchg: Seconds since last UP<->DOWN transition.
downtime: Total downtime (seconds).
qlimit: Configured maxqueue for the server.
pid: Process ID.
iid: Unique proxy ID.
sid: Server ID (unique inside the proxy).
throttle: Current throttle percentage.
lbtot: Times the server was selected.
tracked: ID of proxy/server if tracking is enabled.
type: Type (0=frontend, 1=backend, 2=server, 3=socket).
rate: Sessions per second (last second).
rate_lim: Configured limit on new sessions/s.
rate_max: Max sessions per second.
check_status: Status of the last health check.
check_code: Layer 5-7 check code.
check_duration: Time in ms of the last health check.
hrsp_1xx: HTTP responses with 1xx code.
hrsp_2xx: HTTP responses with 2xx code.
hrsp_3xx: HTTP responses with 3xx code.
hrsp_4xx: HTTP responses with 4xx code.
hrsp_5xx: HTTP responses with 5xx code.
hrsp_other: HTTP responses with other codes.
hanafail: Failed health checks details.
req_rate: HTTP requests per second.
req_rate_max: Max HTTP requests per second.
req_tot: Total HTTP requests received.
cli_abrt: Data transfers aborted by the client.
srv_abrt: Data transfers aborted by the server.
comp_in: HTTP response bytes fed to the compressor.
comp_out: HTTP response bytes emitted by the compressor.
comp_byp: Bytes that bypassed the HTTP compressor.
comp_rsp: HTTP responses that were compressed.
lastsess: Seconds since the last session was assigned.
last_chk: Last health check contents/error.
last_agt: Last agent check contents/error.
qtime: Average queue time (ms) over the last 1024 requests.
ctime: Average connect time (ms) over the last 1024 requests.
rtime: Average response time (ms) over the last 1024 requests.
ttime: Average total session time (ms) over the last 1024 requests.
agent_status: Status of the last agent check.
agent_code: Numeric code reported by the agent.
agent_duration: Time in ms of the last agent check.
check_desc: Human-readable description of check_status.
agent_desc: Human-readable description of agent_status.
check_rise: Server's rise parameter used by checks.
check_fall: Server's fall parameter used by checks.
check_health: Server's health check value.
agent_rise: Agent's rise parameter.
agent_fall: Agent's fall parameter.
agent_health: Agent's health parameter.
addr: Address:port or unix socket.
cookie: Server's cookie value or backend's cookie name.
mode: Proxy mode (tcp, http, health, unknown).
algo: Load balancing algorithm.
conn_rate: Connections over the last elapsed second.
conn_rate_max: Highest known conn_rate.
conn_tot: Cumulative number of connections.
intercepted: Cumulative intercepted requests.
dcon: Requests denied by tcp-request connection rules.
dses: Requests denied by tcp-request session rules.
The status module is translated to a numeric value according to the following mapping: 5=UP, 4=OPEN, 3=NOLB, 2=MAINT, 1=STOP/STOPPING, 0=DOWN, which allows configuring alerts based on warning (2-4) and critical (0-2) thresholds.