
Configure the integration
1) Adding the Pandora FMS Extension
The first thing to do is to load in our Pandora FMS console the extension that will allow us to obtain the data to be represented in the Grafana dashboard.
To do this, we will only have to download the ZIP package that we can find in our library and upload it to Pandora FMS console from the menu: Admin tools > Extension manager > Extension uploader:
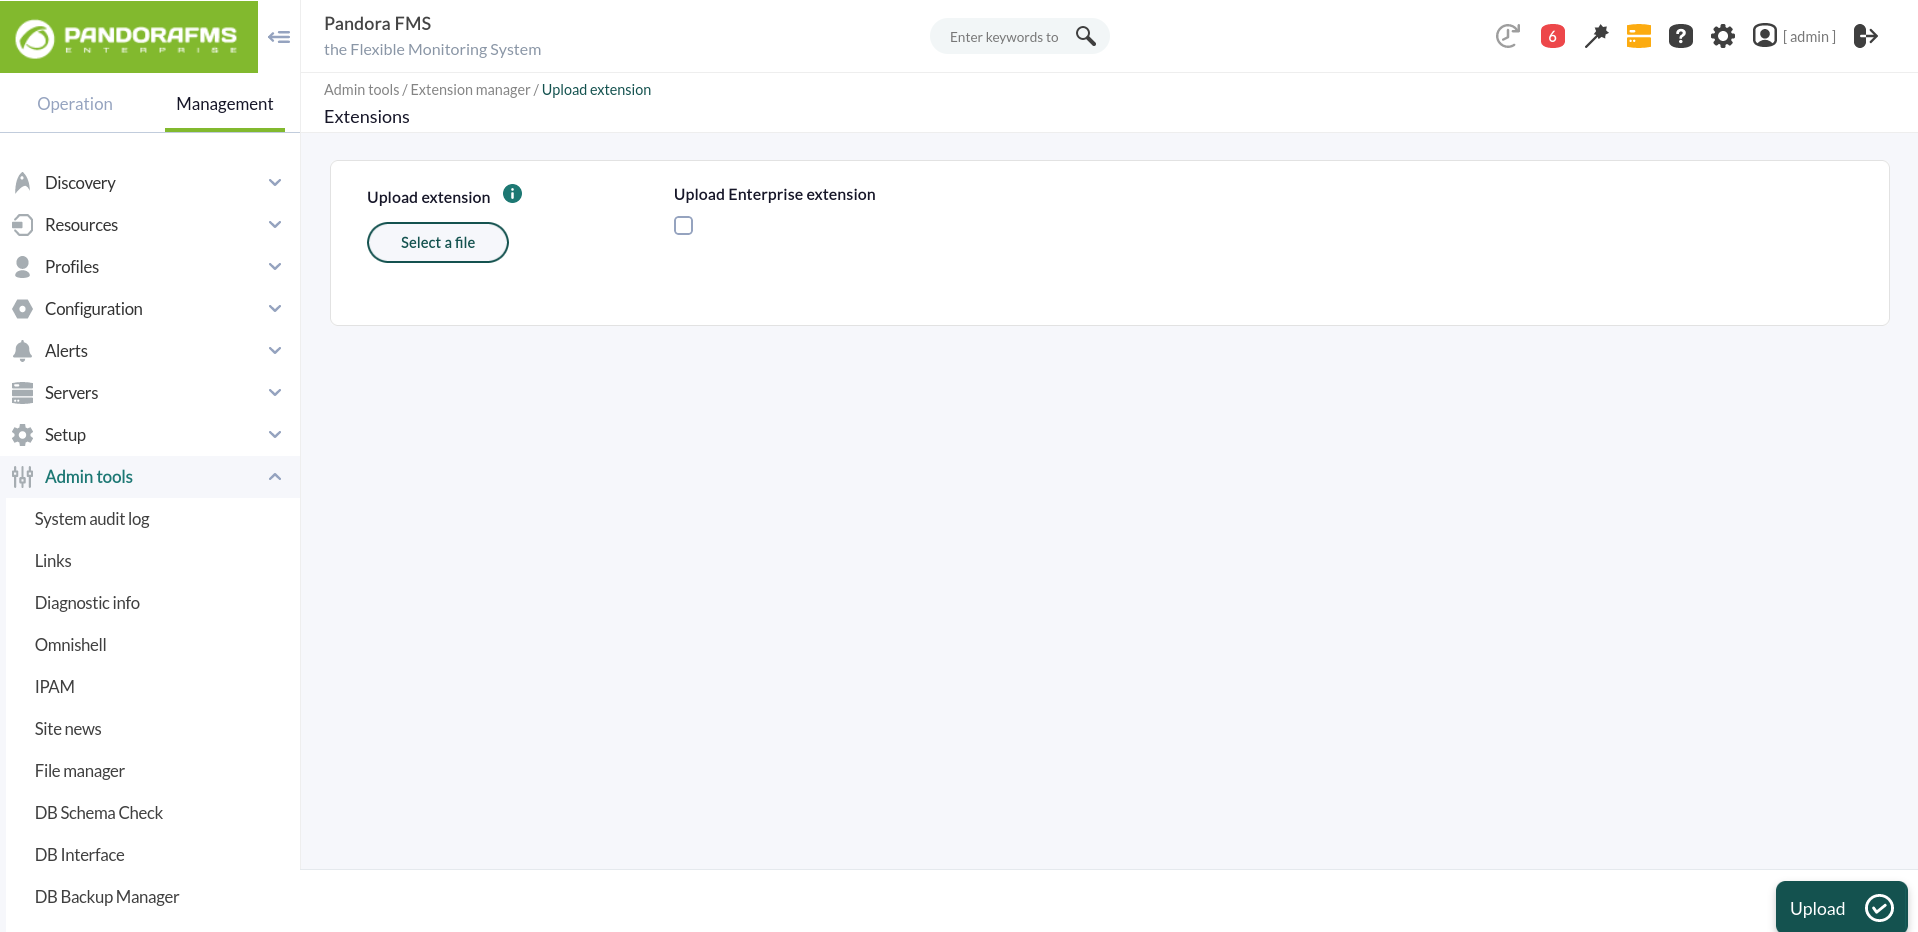
It is important not to check the "Upload enterprise extension" option.
In short, what we are doing is to place the content of the ZIP file in the extensions directory of the Pandora FMS console, which will result in the creation of the directory:
/var/www/html/pandora_console/extensions/grafana.
If, as in our case, the installation starts from a Pandora FMS ISO, it will also be necessary to modify a parameter of the Apache server configuration.
It is enough to edit the file /etc/httpd/conf/httpd.conf, and put the parameter "AllowOverride none" as "AllowOverride All", inside the directives of the block '<directory "/var/www/html">' since it is where our Pandora FMS console is located. Therefore, it should look like this:
<Directory "/var/www/html">
#
# Possible values for the Options directive are "None", "All",
# or any combination of:
# Indexes Includes FollowSymLinks SymLinksifOwnerMatch ExecCGI MultiViews
#
# Note that "MultiViews" must be named *explicitly* --- "Options All"
# doesn't give it to you.
#
# The Options directive is both complicated and important. Please see
# http://httpd.apache.org/docs/2.4/mod/core.html#options
# for more information.
#
Options Indexes FollowSymLinks

#
# AllowOverride controls what directives may be placed in .htaccess files.
# It can be "All", "None", or any combination of the keywords:
# Options FileInfo AuthConfig Limit
#
AllowOverride All

#
# Controls who can get stuff from this server.
#
Require all granted
</Directory>
We will also add a parameter in the PHP configuration. We will have to add the following line at the end of the /etc/php.ini file:
serialize_precision = -1
And for these changes to take effect the Apache service must be restarted:
systemctl restart httpd
2) Loading the Pandora FMS plugin for Grafana
We will have to upload to the Grafana server the ZIP file with all the plugin files and place it in the path "/var/lib/grafana/plugins". Unzip the file in this path with the "unzip" command and restart the Grafana service to load it:
cd /var/lib/grafana/plugins
unzip pandorafms_grafana_datasource.zip
service grafana-server restart
3) Configuring Pandora FMS as data source for Grafana dashboards
Add the following lines to the end of the Grafana configuration file (/etc/grafana/grafana.ini):
[plugins]
allow_loading_unsigned_plugins = "pandorafms-pandorafmsgrafana-datasource"
After this change the Grafana service must be restarted using the following command:
At this point what we have to do is to configure the plugin uploaded in Grafana so that it connects with the extension loaded in Pandora FMS and allows us to use its data in the Grafana dashboard.
We have to access in Grafana to the "Configuration > Datasources" menu and click on the "Add datasource" button
service grafana-server restart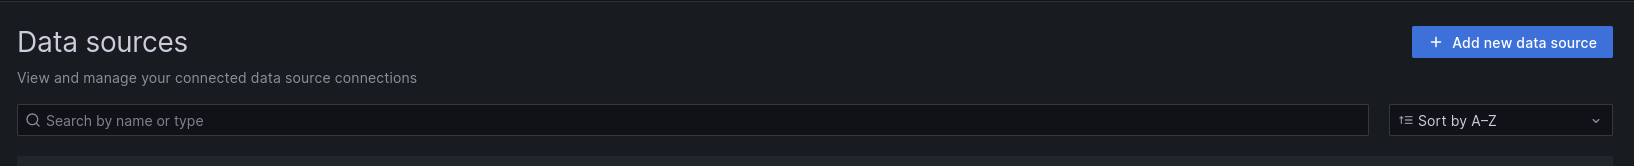
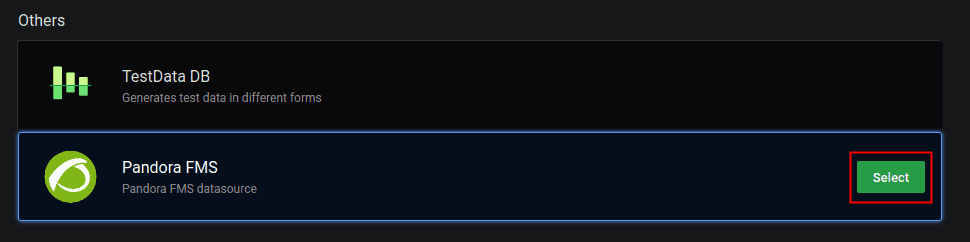
We will see different plugins that we can configure, and at the bottom of the list we will see the plugin that we have just loaded for Pandora FMS. Click on it:
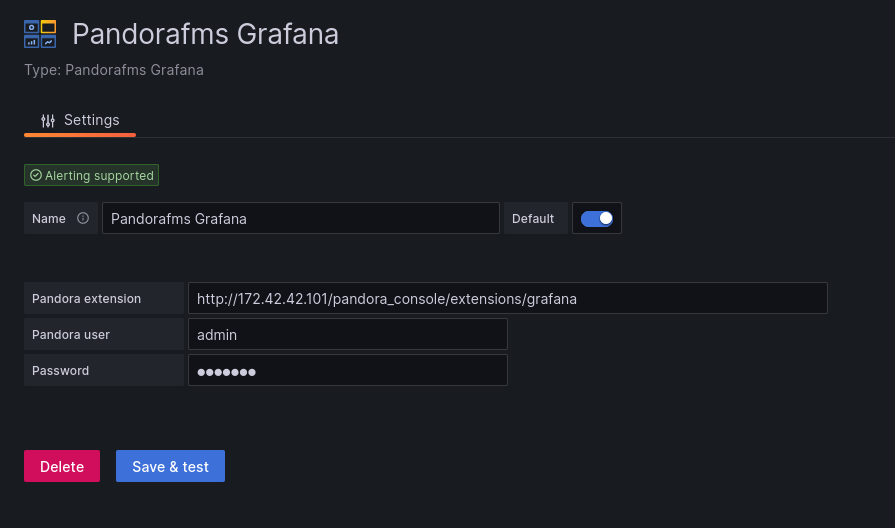
Esto nos llevará a un formulario donde solo necesitaremos rellenar 3 campos para la conexión con la extensión de Pandora FMS:
URL a la extensión, que de acuerdo a la sugerencia que veremos será (por defecto) “http://x.x.x.x/pandora_console/extensions/grafana”, siendo “x.x.x.x” la dirección IP o nombre DNS a nuestra consola de Pandora FMS.
Usuario de Pandora FMS, el cual nos permitirá obtener los datos para los dashboards de Grafana. Este usuario debe tener al menos permisos de lectura de agentes (AR) y solo podrá obtener los datos de aquellos agentes sobre los que tenga permisos.
Contraseña del usuario de Pandora FMS.
Con estos campos completados, podremos hacer click en el botón “Save & Test” para verificar el funcionamiento de nuestro nuevo origen de datos:
What happens if it does not work correctly? In configuration we could see different errors, such as:
HTTP Error Bad Gateway → If Grafana could not connect to Pandora FMS or if the indicated IP address was incorrect.
HTTP Error Not Found → If the indicated URL was not correct, for example because the Pandora FMS extension was not loaded correctly or simply because of an error when writing the URL in the form.
Datasource connection error: Unauthorized → If the indicated user and/or password were not correct or if the user did not have the minimum permissions to read agents (AR).