
7. Network device remote monitoring
Monitoring through network modules. TCP Service.Service
In this case, monitoring will be added to verify that an SMTP (mail)email) service is active on a machinemachine. will be added. Although this couldcan be a very complex check (simulating thatthe sending of user credentials and passwordspasswords, are sent, thatsending an email is sent,email, etc.), it will be simplified here by only checkingverifying that the port is open and responsive.responding.
To do that,this, repeat the samesome steps from the previous chapter,chapter butwill thisbe timerepeated: choosefirst creating an agent and then creating a "network module (Network module".TCP module):
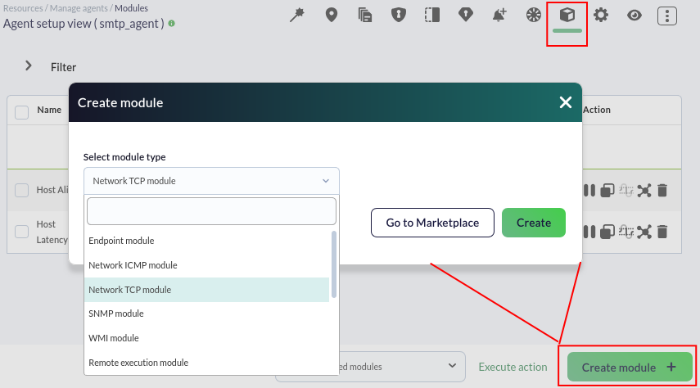
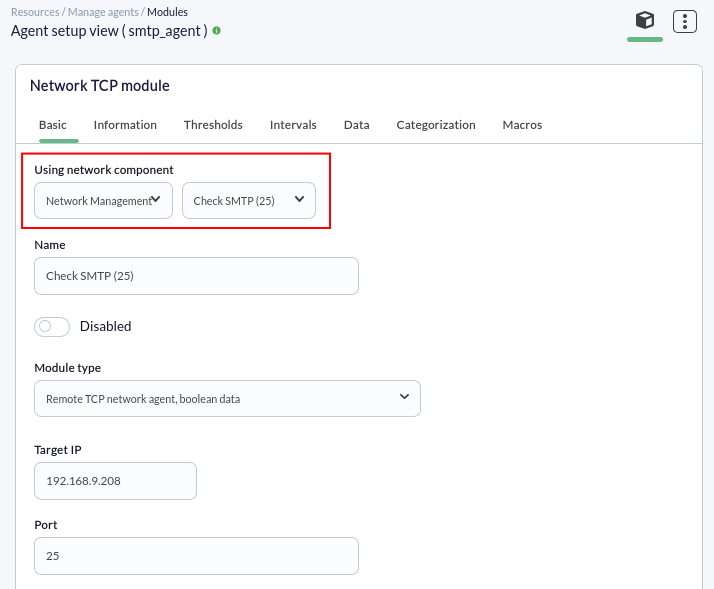
ThenNext, use the drop-down controls until you find the desired check (is found, Check SMTP Server)(25), and click on it to create the module:module (only necessary fields are shown; ensure it brings the agent's IP address):
Finally, repeat the steps will be repeated (go to the operation view and refresh until the monitor appears). Until a module has no data, it will be BLUE, which indicatesindicating that it ishas not yet been initialized:
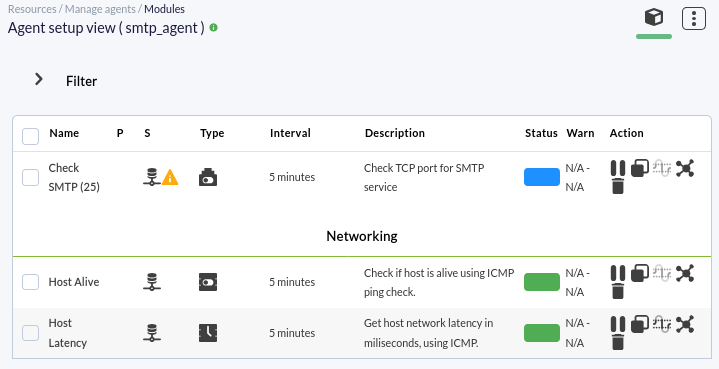
After a few secondsseconds, it should start and take a value,value: GREEN if the SMTP server responds, or RED if it does not:
![]()

Monitoring through server plugins.plugins. Network packet loss.loss
We are going to monitor the network packet loss using a remote check that comes pre-configuredpreconfigured in Pandora FMS. ForTo thatdo this, go to the configurationagent administration view, of any agent connected to your network, becauseas we are going towill measure the packet loss from Pandora FMS to the IP address of thatany agent.
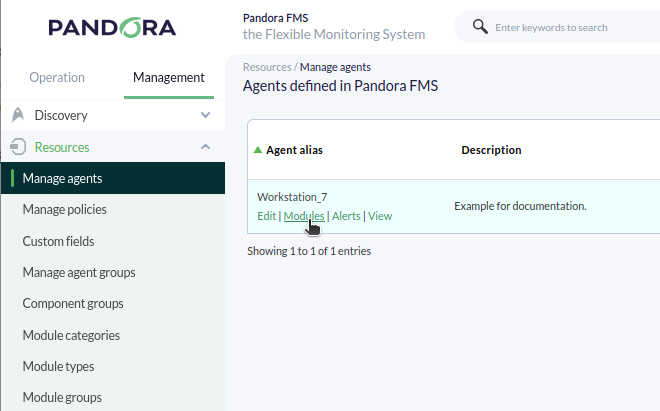
The configuration view can be accessed through the cogwheel icon: ![]()
From there go to the module view:

And we will create a "Plugin"module module:of the Plugin type:
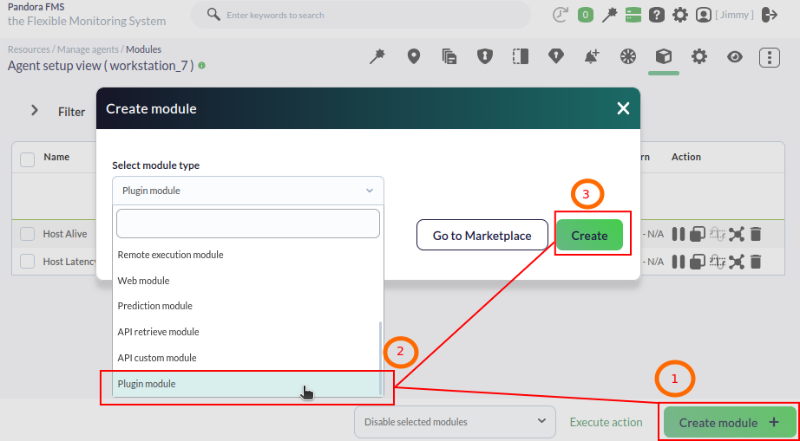
ChooseSelect "the Network management"management component group component and looksearch for "Packet loss"loss:
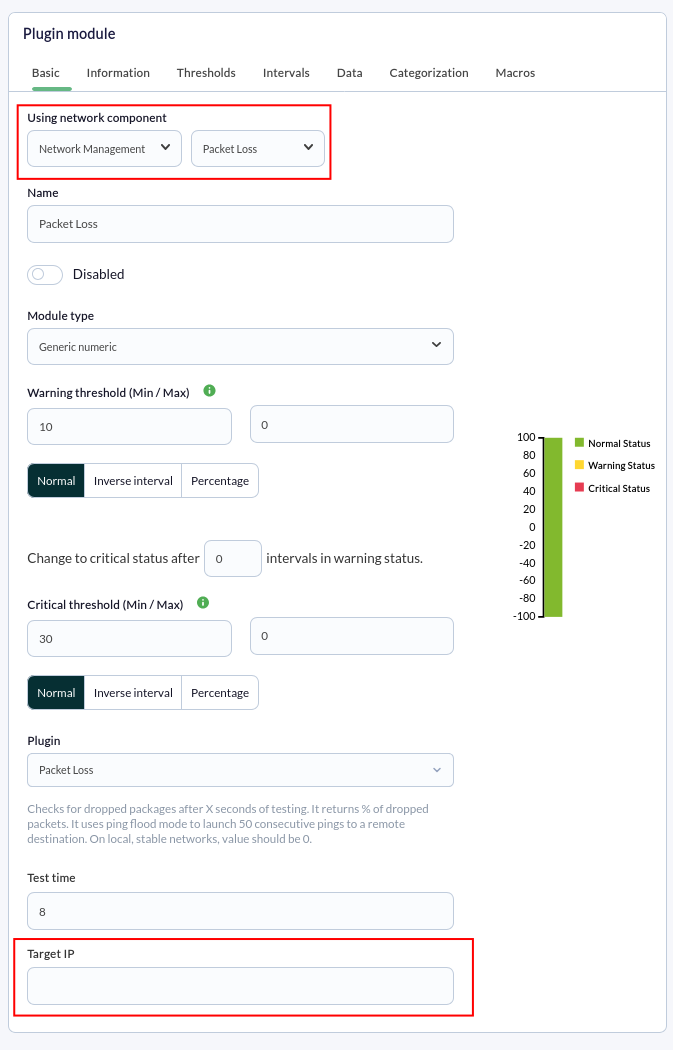
SoYou must enter the IP address of the device to be monitored in the Target IP field before saving the new module should look like this:module.

We chose a "library" module that uploads some values automatically.
Click "Create" and returnGo to the operationmain viewagent (eyeview; icon):initially, the module will be displayed as uninitialized in blue:
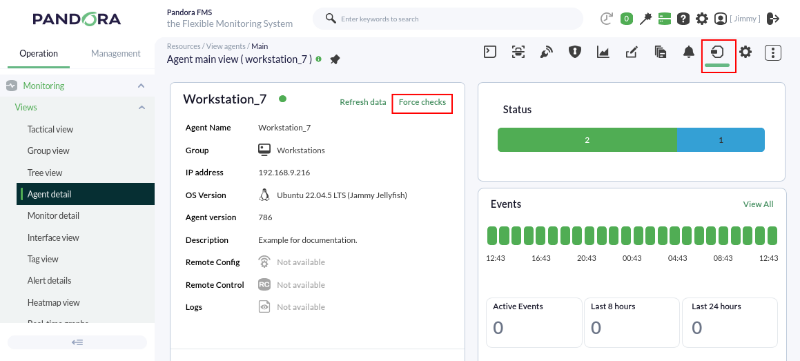
TheTo screenspeed is updated a couple of times, untilup the newprocess, moduleyou appearscan force all checks (Force checks button) for the agent in the list:
![]()
The round icon is to "force"force only the check againof (itthe onlynew works with remote checks):module:
![]()
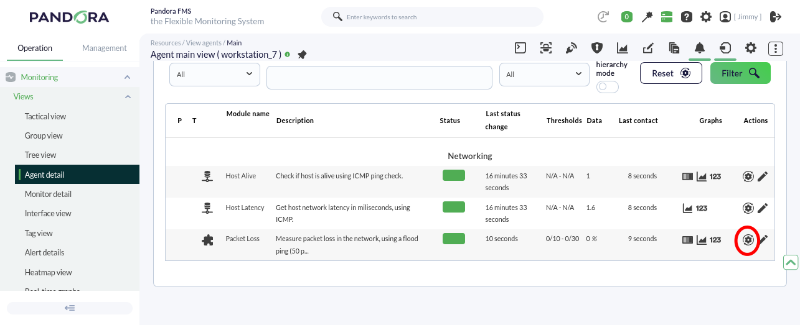
TheJust to the left of the force module check button, we have the graph and data table iconicons respectivelyrespectively. helpThese showare used to display an interactive graph or a table with the data collected by that module. All the modules with active history have the possibilityoption to seeview graphs or data:
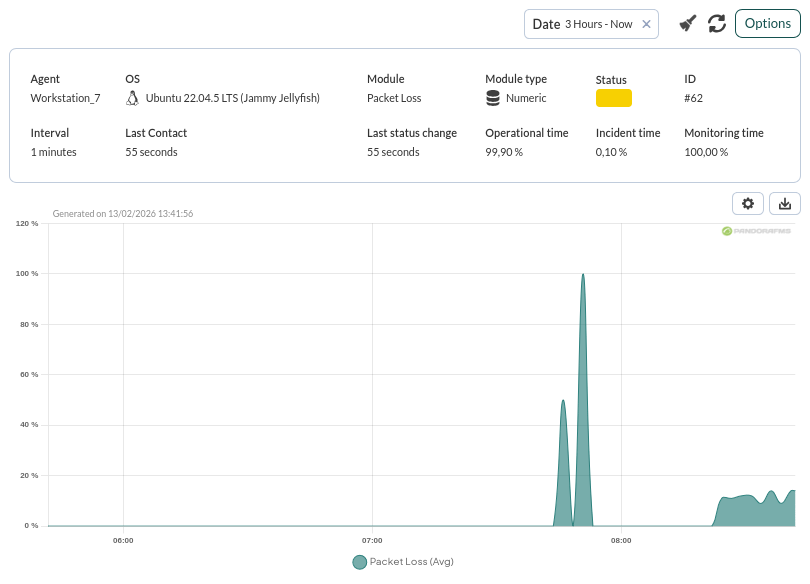

This is a very interesting plugin,plugin; which,when used togetherin conjunction with basic connectivity (ping) and latency time, determinesit serves to determine the quality of your network quality,network, as it indicates the percentage of packet loss percentage.loss.
DidAre you not getachieving the expectedresults results?explained Goin tothis chapter? Access the help or support sections.section.