6. Network device monitoring through SNMP Interface Wizard
In order to perform this type of monitoring, it is essential for the SNMP to be configured in the remote device. This usually needs to be activated as well as a minimum configuration that allows us to check data. SNMP devices allow you to configure which IPs can make queries and with which ''community'', which for all intents and purposes is a kind of password.
Most network devices (routers, switches) have the community "public" by default.
First locate the agent from where you want to get the network traffic; in this case we are going to use a CISCO Catalyst switch, but it could be any device with SNMP enabled. Following the same process ''Monitoring" > "Views" > "Agent detail'' you will reach the main view of the agent you want to configure and click on the last tab on the right, which will take you to the editing view of that agent.
Go to the main view of the agent editing. Here you will see the agent configuration "Wizards" submenu, where to choose the SNMP Interface Wizard, as you can see in the following screenshot:
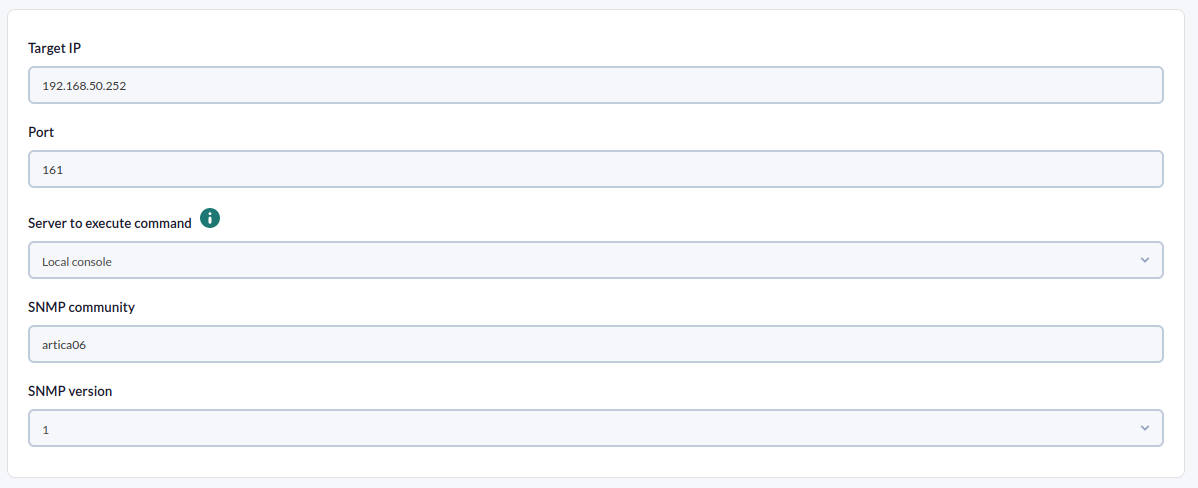
The SNMP wizard will allow to track the agent's interfaces. Provide "SNMP community" and "version" data. If everything works, it will show the interfaces and the data that can be obtained from them.
With a simple click you will be able to select the metrics you are interested in from all the switch interfaces and even define thresholds with warning and critical values that will later be useful to work with the alerts.
Click on "Create modules" and a screen should inform that the modules have been created.
The network traffic modules are ''incremental'', that means that its value is the difference between the information sample that has just been collected and the previous one. It shows a ''rate'' (in this case in bytes/sec), so it needs time (about 1 or 2 agent intervals) before showing anything.
Click on the "View" tab to return to the agent view and wait for a minimum of 1 agent interval until you already have data, updating or clicking on the "View" tab.
If you do not want to wait any more or you want to "force" the execution of all the remote agent modules, use the "force remote check" icon. Depending on the server load, it can take between 2 and 15 seconds to execute the test:
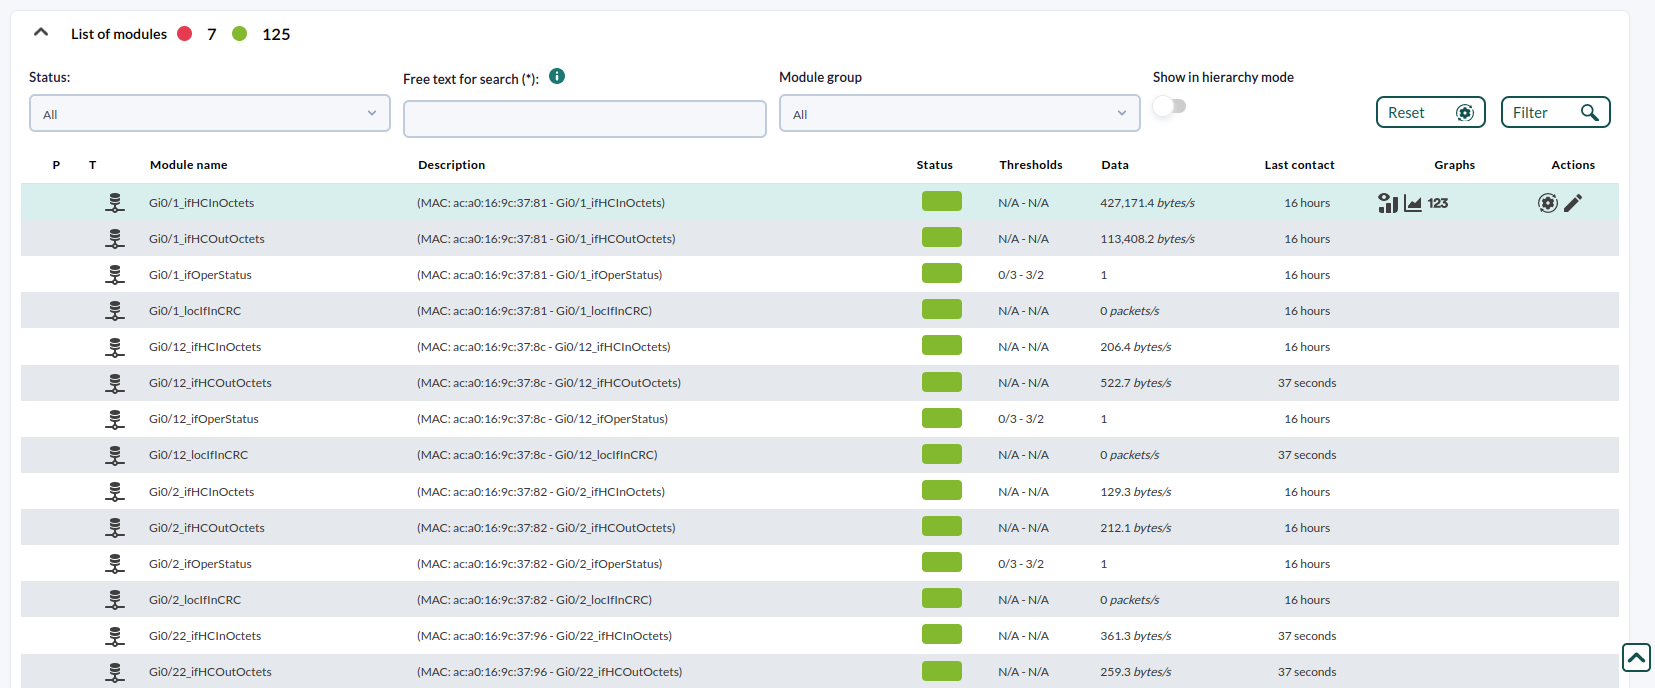
Module information will be seen this way and the graphs for each metric will show a window with the graph of that monitor and when clicking on the data icon, a table with the data:
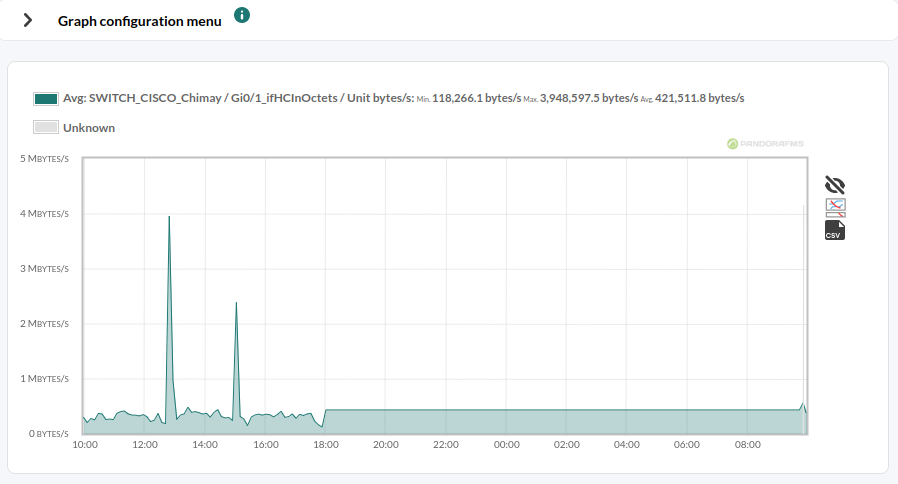
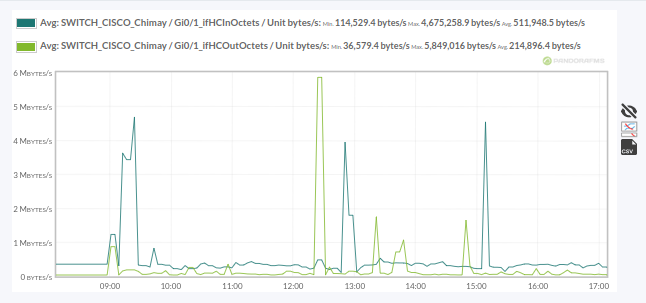
Let us see a graph of one of the individual metrics (Gi0/1_ifHCInOctets):
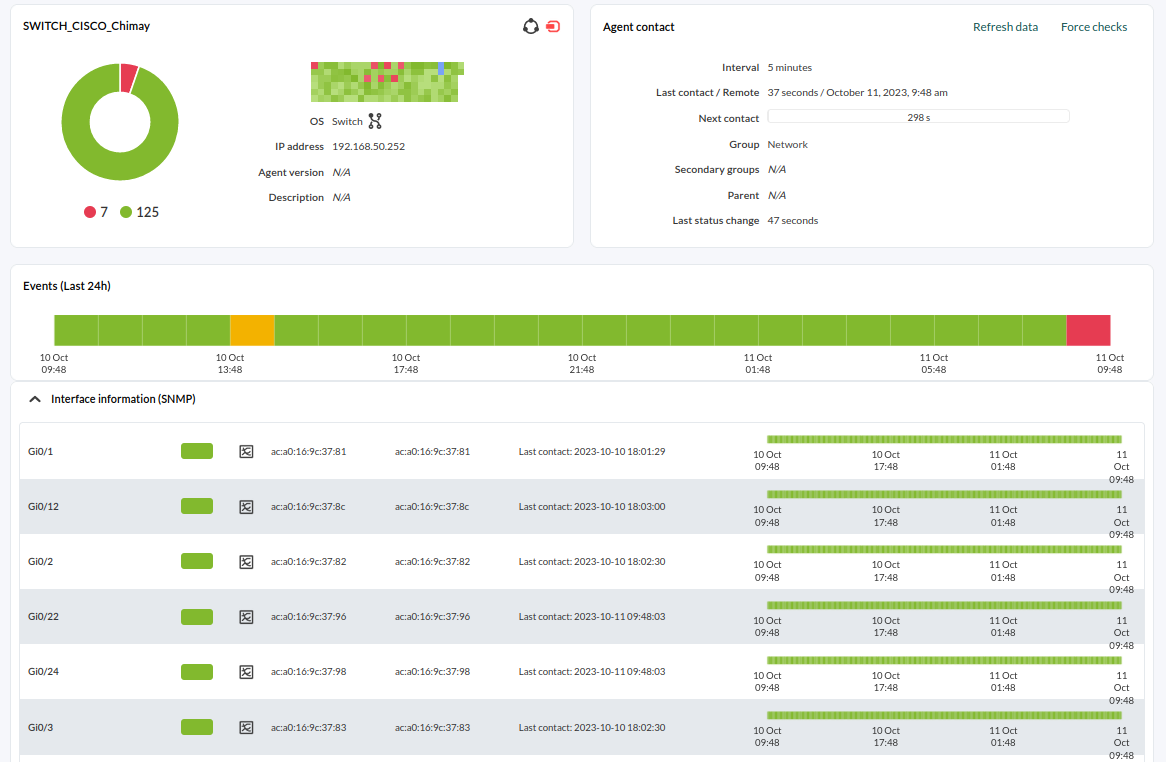
You may also use the "Interfaces" view to easily see the information of the input/output traffic of each interface. To do this, open the "Interface information (SNMP)" box under the agent overview:
By clicking on the graphical icon of an interface ( ):
):
DidAre you not getachieving the resultsexpected explained in this chapter?results? Go to to help or support sections.


