
6. Network device monitoring through SNMP Interface Wizard
In order toTo perform this type of monitoring, it is essential for thethat SNMP to beis configured inon the remote device. This usuallygenerally needs to be activated,activated as well aswith a minimum configuration that allows youdata toqueries.
SNMP devices allow you to configure which IPsIP addresses can makeperform queries and with which ''community'',community whichwill be used for allthose intents and purposes is a kind of password.queries.
Most network devices (routers,routers, switches)switches) have the "community public by default." community
FirstFor locatethis monitoring, an agent will be created via the menu Management → Resources → Manage agents → Create agent, fromwith the following configuration:
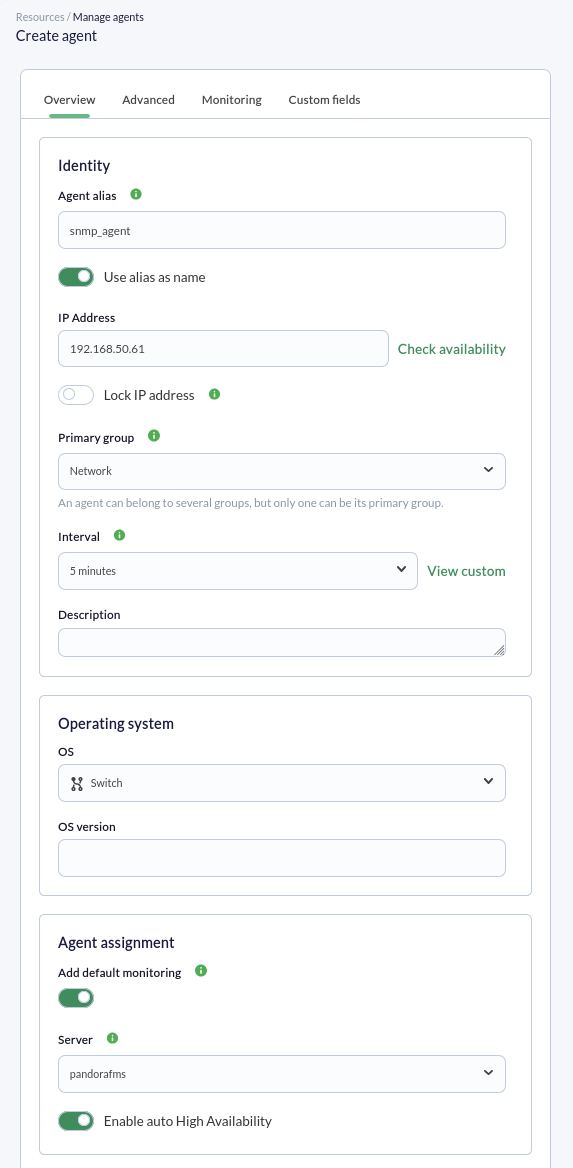
Important fields include IP Address, where youthe wantIP address of the remote SNMP device to getbe checked will be entered. Generally, this IP address is automatically used when modules are created, but you should always verify that this IP address has actually been used in each module. In the networkAdd traffic;default monitoring field (active by default), we will see this feature in action: two modules will be created, one to verify connectivity—in this case wewith arethe goingswitch—and the latency or connection time (speed). Click the Create button to usesave.
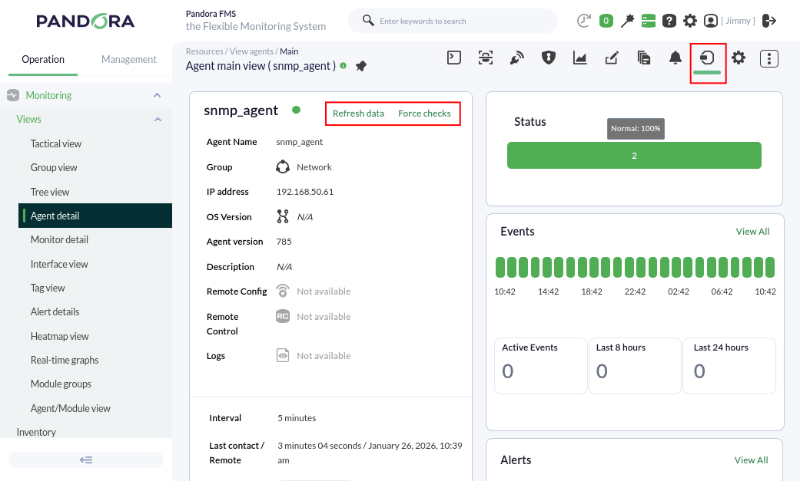
Once the sameagent processis ''Monitoring"created, >go "Views"to > "Agent detail'', you will reach theits main view of(Main the agent you want to configuretab), and clickin ona thefew last tab on the right, which will take you to the editing view of that agent.
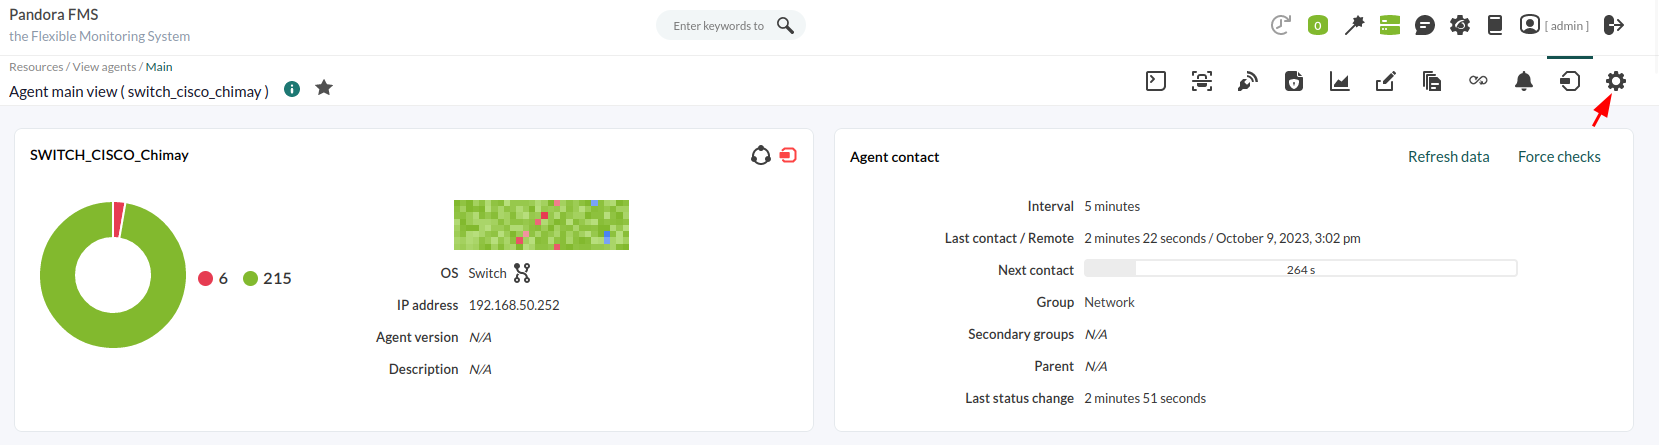
Go to the main view of the agent editing. Heremoments, you will see theif agentthere configurationis "Wizards"a submenu, whereconnection to choosethe device. If necessary, you can force the check and refresh the data (Force checks and Refresh data buttons):
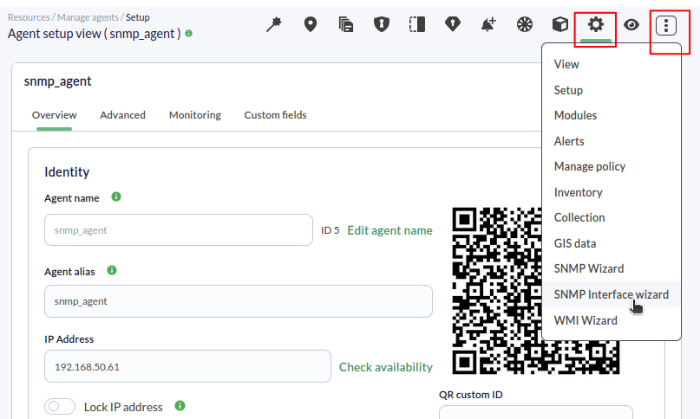
Now we will go to the Manage tab, which allows access via the drop-down menu to the SNMP Interfaceinterface Wizardwizard, asoption you(this mayoption seeis also available in the followingfirst screenshot:
from left to right):
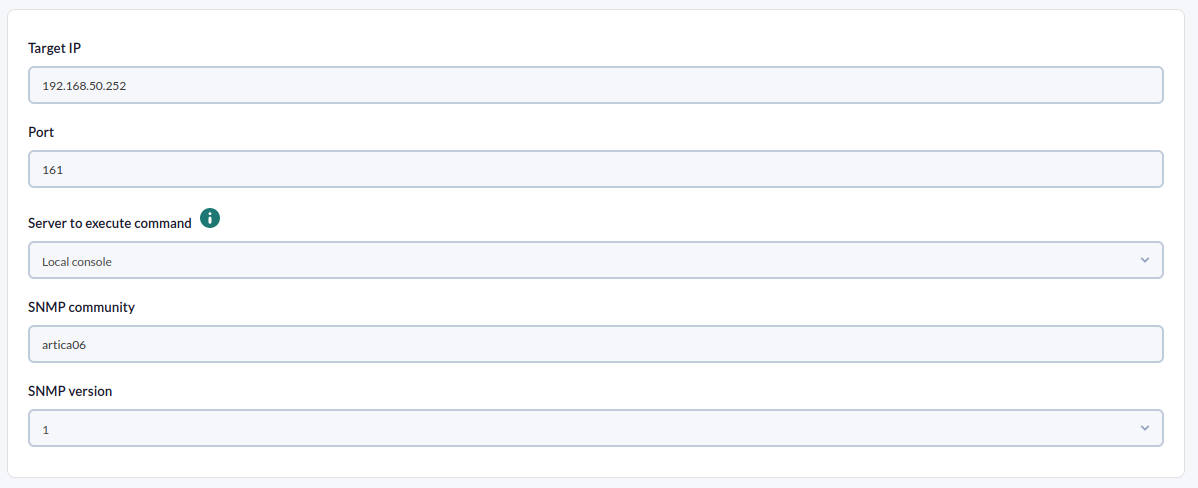
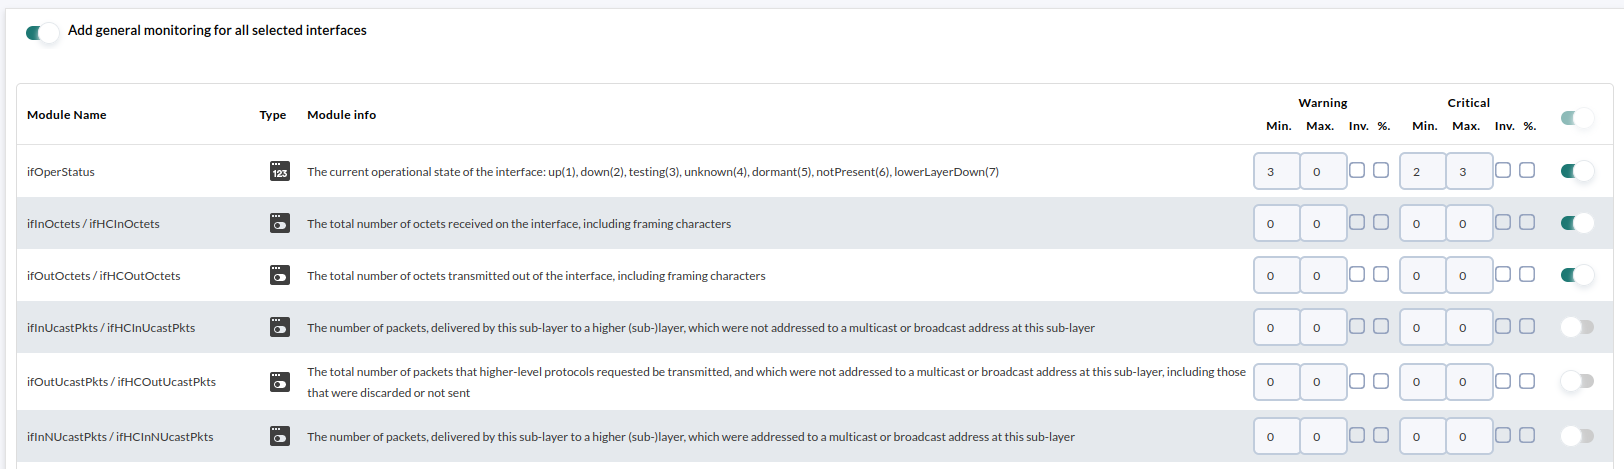
The SNMP wizard will allow to track the agent's interfaces. Provide "SNMP community" and "version" data. If everything works, it will show the interfaces and the data that can be obtained from them.
With
When accessing the SNMP wizard for network interfaces, the following dialog box will appear where the IP address (Target IP field) has already been inserted, brought from the agent's general data, and a simplepreviously stored SNMP credential has been selected (Import from credential store field):
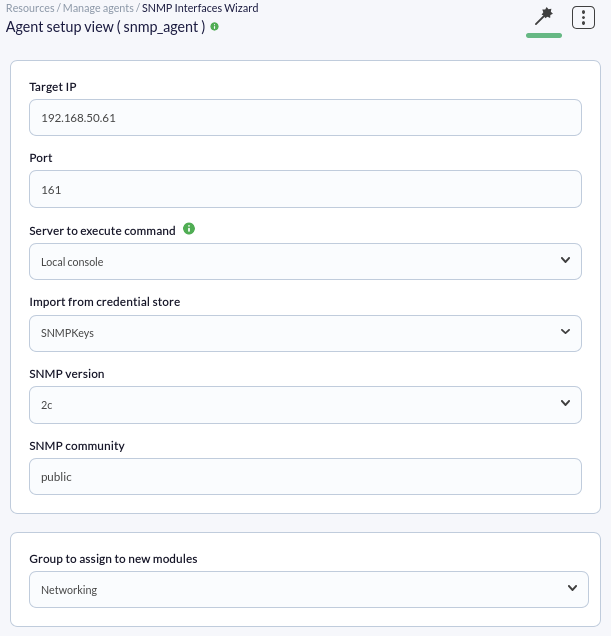
This stored credential also provides the SNMP version and its community. Finally, we select the Networking group to assign the new modules and click youthe SNMP walk button. This may take some time depending on the device's complexity; once the scan is complete, we will look at the box that allows adding general checks to the detected network interfaces.
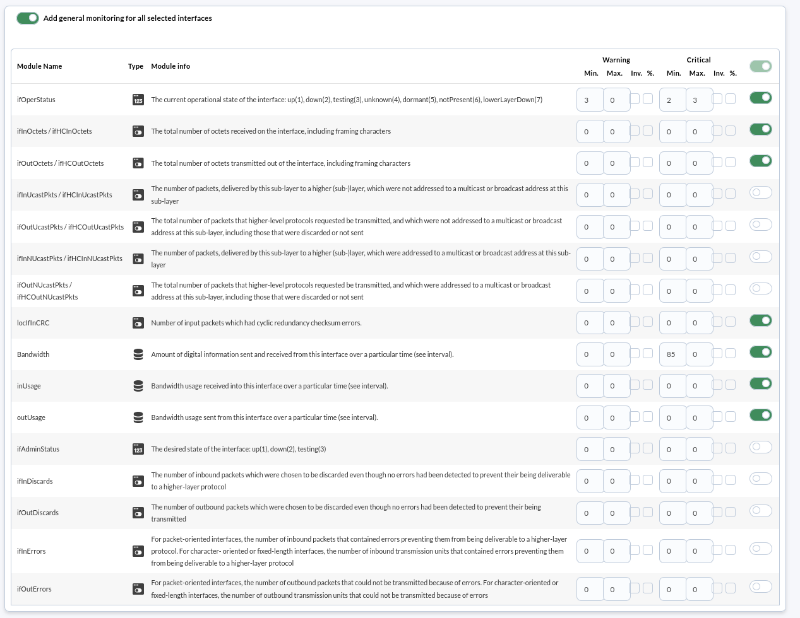
We will leave the values already checked and click the Create modules button, after which a dialog box with a summary of the modules will be ablepresented:
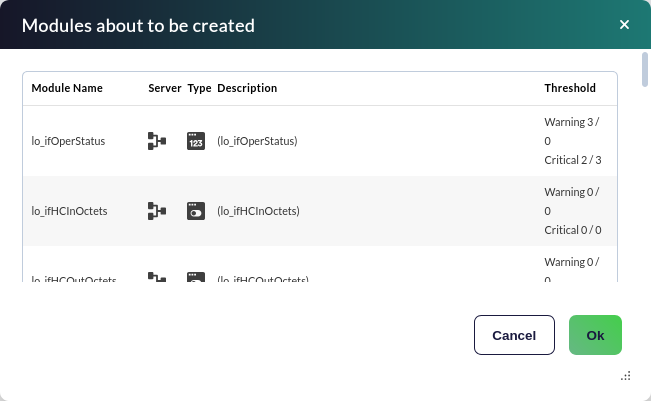
Upon clicking the metricsOk you are interested in from all the switch interfaces and even define thresholds with warning and critical values that will later be useful to work with alerts.
Click on "Create modules" and a screen should inform thatbutton, the modules werewill created.be
in the agent.
Network traffic modules are ''incremental'',of thatthe meansincremental thattype, itsmeaning their value is the difference between the information sample that has just been collected and the previous one. It shows a ''rate''"rate" (in this case in bytes/sec), so it needs some time (aboutbetween 1 or 2 agent intervals) before showingit anything.can display consistent values.
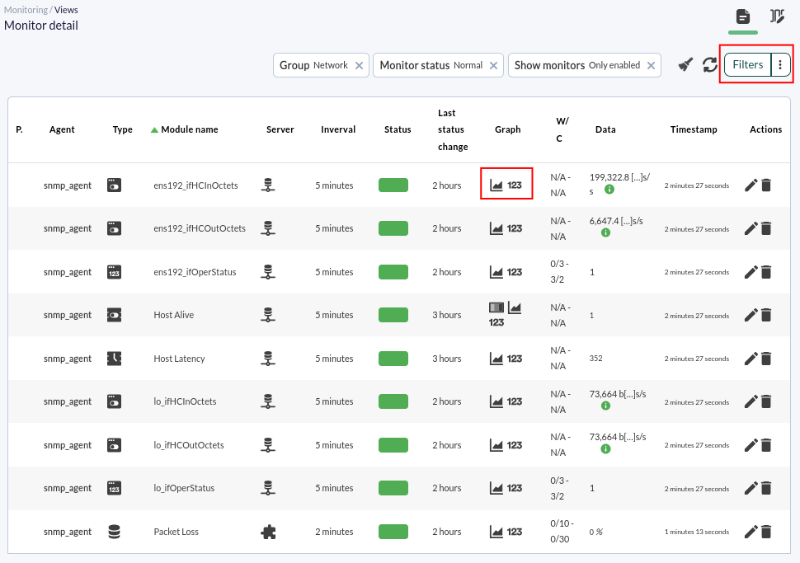
ClickOnce onmonitored thefor "View"a tabsufficient toamount returnof time, go to the agentmenu viewOperation → Monitoring → Views → Monitor detail and waitin Filters search for a minimum of 1the agent interval until you already have data, updating or clicking on the "View" tab.
If you do not want to wait any more or you want to "force" the execution of all the remote agent modules, use the "force remote check" icon. Depending on the server load, it may take between 2 and 15 seconds to run the test:

Module information will be seen this waygroup and the graphsnormal for each metric will show a window with the graph of that monitor and when clicking on the data icon, a table with the data:status:
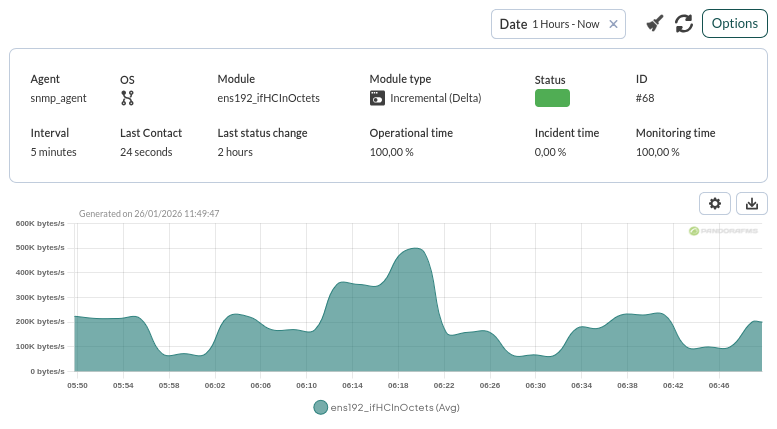
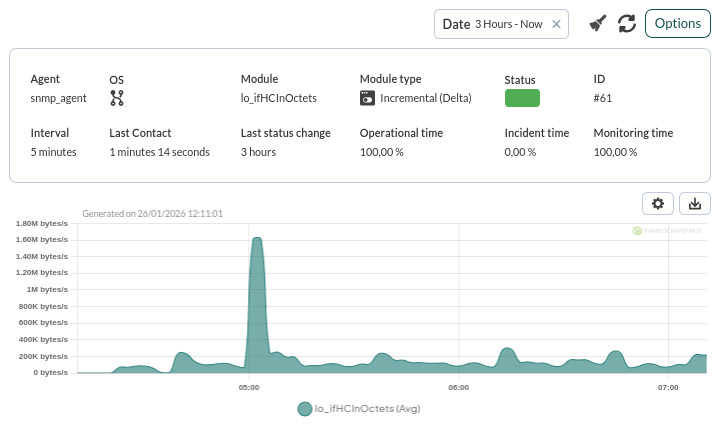
LetLet's uslook seeat a graph of just one of the individual metrics (Gi0/1_ifHCInOctets):metrics:
YouWe maycan also use the "Interfaces"Interface viewinformation (SNMP) view, located below the general agent view, to easilyconveniently see the information of the input/output traffic ofinformation for each interface. To do this, open the "Interface information (SNMP)" box under the agent overview:interface:
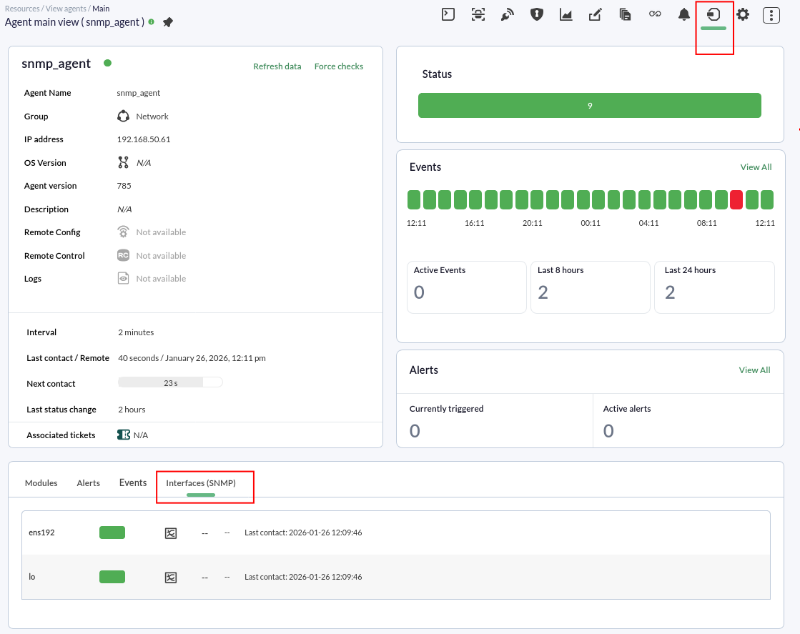
By clicking on the graphicalgraph icon of an interface ( ) you will see more details (in Options you can change the time period):
DidAre you not getachieving the expectedresults results?explained Goin tothis chapter? Access the help or support sections.section.