
16. Dashboard creation
A Dashboard is a Pandora FMS feature that allows each user to build histheir own monitoring page. You may add moreMore than one page,page can be added, and thereon it, you maycan addinclude monitoring maps, graphs and status summaries, shortbrief event lists (with filters), and many other widgets.widgets.
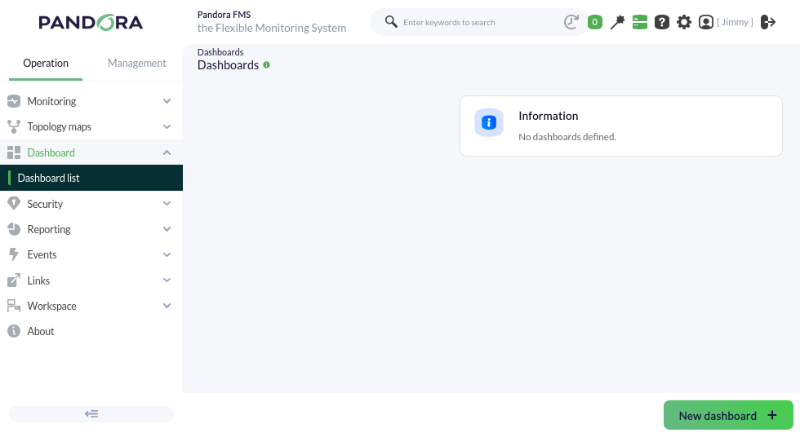
To create yourour own dashboardsdashboards, goit will be necessary to "Reporting"access Operation -> "Dashboards"Reporting -> Dashboards, where youwe maycan select the "New dashboard"dashboard button to create the ones youwe need.
Pandora FMS will show youus a new window wherein youwhich maywe give acan name to yourour new dashboardDashboard and define whetherif it will be a private dashboard,Dashboard, the monitoring group it belongs toto, or whetherif youwe want to defineset it as a favoritefavorite, sothus thatallowing it showsto upappear in the side drop-down menu in the dashboards section.
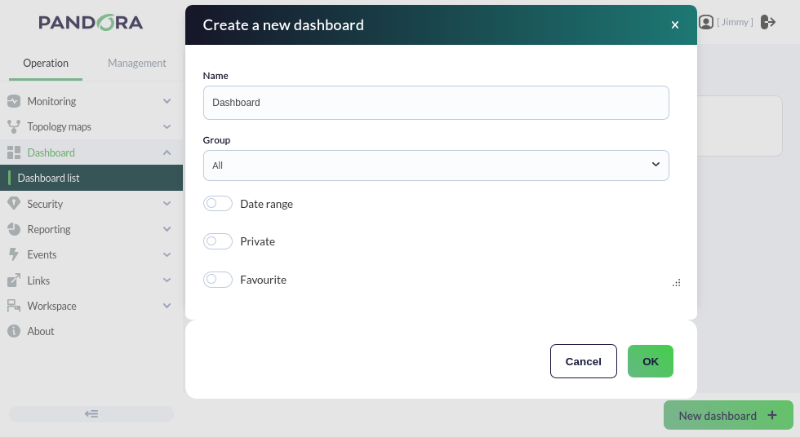
Once these steps are defined, we can directly configure yourour first widget.
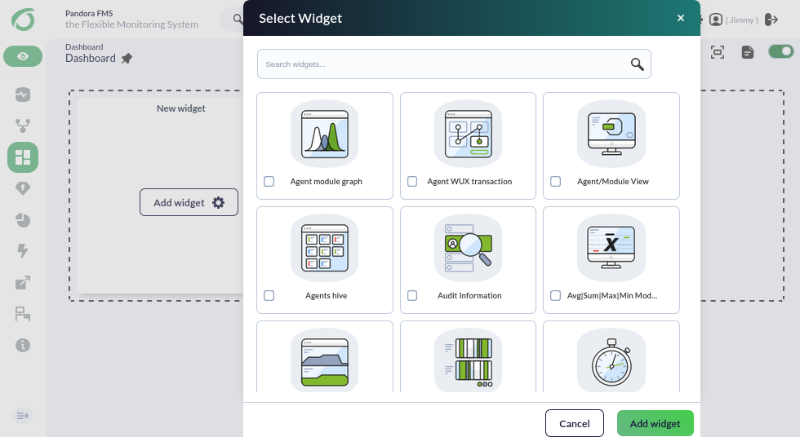
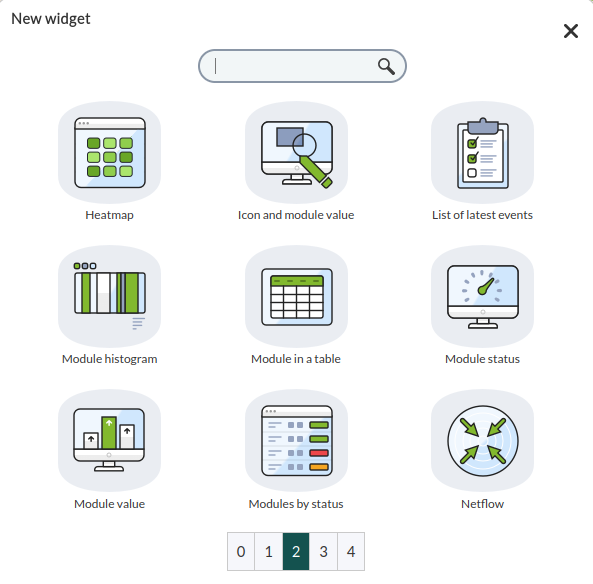
YouWe maywill be allowed to choose between different monitoring aspects of yourour environment's monitoringenvironment to display them on screen. YouWe maycan choose, for example, the list of the lastlatest eventsgenerated generated.events.
This will getprepare yourour widget ready,widget, which youwe will have to configure to define the desired parameters, such as the type of events youwe want it to display,show, the listsize size,of severitythe list, the severity, or the group they belong to.
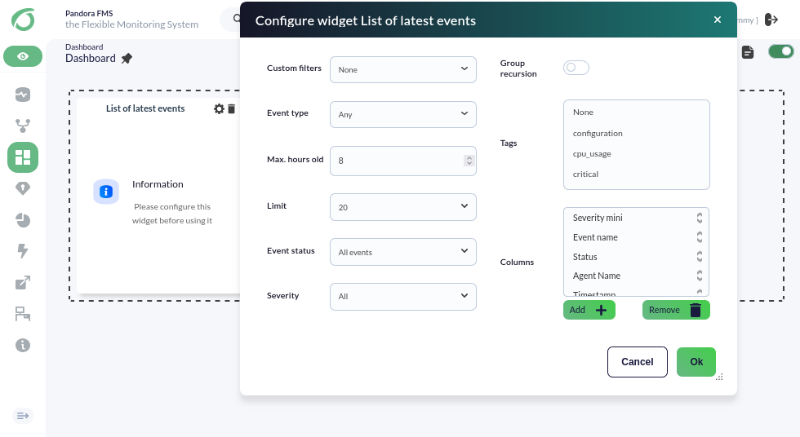
Once selected, yourour widget will start showing the data and youwe maycan startbegin adding as many as youwe want by clickingpressing "the “Add cell (+)"” button in the edit view.
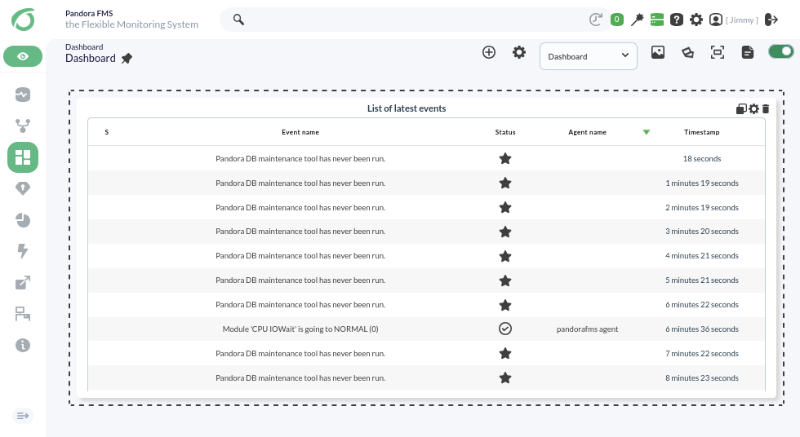
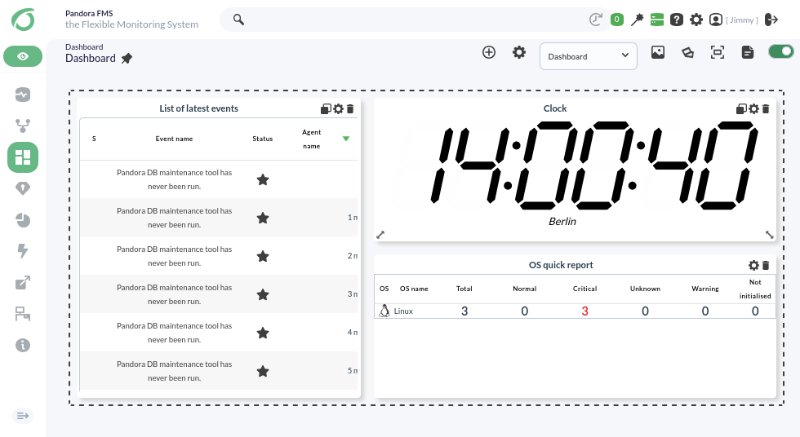
Following this process, you maycan build a dashboard like this within a matter of a few clicks:
DidAre you not getachieving the expectedresults results?explained Goin tothis chapter? Access the help or support sections.section.