Cloudwatch discovery
This document describes the PandoraFMS cloudwatch functionality, consisting of the discovery plugin.
- Introduction
- Pre requisites
- Parameters and configuration options
- Manual execution
- Discovery
- Agents and modules generated by the plugin
Introduction
This plugin allows you to monitor AWS environments using CloudWatch, collecting detailed information on performance metrics and the status of cloud resources. It extracts data from multiple services and regions, including CPU, memory, disk usage, latencies, and other key indicators that can be configured using custom queries. It allows you to track historical and real-time metrics, providing aggregate statistics or individual values according to the defined configuration.
The script automatically manages the connection to AWS using hardcoded credentials, supports the use of proxies and SSL configurations, and executes queries in parallel to optimize performance in environments with multiple metrics and regions. All collected data is transformed into Pandora FMS-compatible modules, automatically generating agents and modules, ready to be sent to the platform via XML, either by Tentacle or by local transfer.
This solution facilitates centralized monitoring of the AWS infrastructure, allowing you to detect anomalies, load spikes, or potential problems before they affect operations, integrating critical metrics directly into Pandora FMS for continuous and complete control of the cloud environment.
Translated with DeepL.com (free version)
Pre requisites
- Connectivity to the AWS API
The plugin is a binary that contains the packaged dependencies, so no dependencies need to be installed in order to use it.
- Permissions
To make requests through the API, the account used for authentication during execution requires certain permissions (these will depend on the queries used and the resources being accessed).
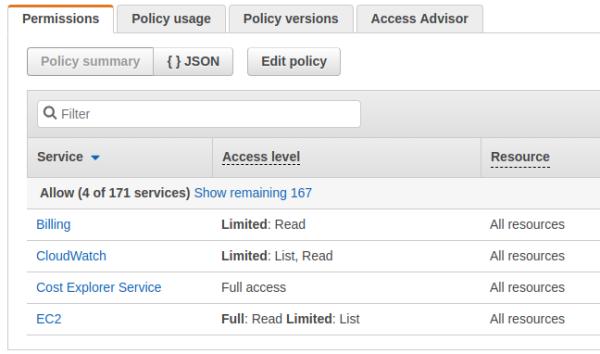
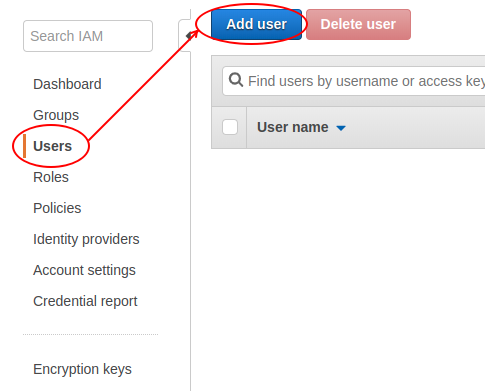
Permission assignment
Create a policy in JSON like the following:
{
   "Version": "2012-10-17",
   "Statement": [
       {
           "Sid": "VisualEditor0",
           "Effect": "Allow",
           "Action": [
  			   "ec2:DescribeInstances",
               "ec2:DescribeVolumes",
               "aws-portal:ViewBilling",
               "cloudwatch:GetMetricStatistics",
               "ec2:DescribeAddresses",
               "ce:GetCostAndUsage",
               "ce:GetTags"
           ],
           "Resource": "*"
       }
   ]
}
The above policy must be assigned to a new user.
To obtain advanced statistics for EC2 instances, detailed monitoring must be enabled for the specific instance. This is done from the instance menu in AWS.
Actions -> Monitoring and troubleshooting -> Manage detailed monitoring -> Enable
Parameters and configuration options
Parámetros
| --creds | Base 64 of the credentials |
Before being converted to base 64, credentials have the following format:
{
  "access_key_id": "KEY",
  "secret_access_key": "PASSWORD"
}| --query_conf | Path to the AWS custom query configuration file |
In the query file, you can specify one or more Metrics Insights queries. These follow the structure documented in the following link: https://docs.aws.amazon.com/AmazonCloudWatch/latest/APIReference/API_GetMetricData.html
The structure for executing one or more Metrics insights queries is as follows:
{
    "time_frame": "< time window in which to collect data, possible options : 5m, 10m, 15m, 30m, 1h>",
    "region_name": "< region in which to execute the query > ",
    "MetricDataQueries": [
        < Metrics insights operations >
    ]
}
These queries must be defined within a list and separated by commas, so the structure of two queries would be as follows:
[
{
    "time_frame": "< Time window for collecting data, possible options : 5m, 10m, 15m, 30m, 1h>",
    "region_name": "< region in which to execute the query > ",
    "MetricDataQueries": [
        < Operaciones de metrics insights >
    ]
}
,
{
    "time_frame": "< ime window for collecting data, possible options : 5m, 10m, 15m, 30m, 1h>",
    "region_name": "< region in which to execute the query > ",
    "MetricDataQueries": [
        < Operaciones de metrics insights >
    ]
}
]
An example of a query configuration would be the following:
[
{
    "time_frame": "5m",
    "region_name": "us-east-1",
    "MetricDataQueries": [
        {
            "Expression": "SELECT AVG(CPUUtilization) FROM SCHEMA("AWS/EC2", InstanceId) WHERE InstanceId = 'i-01e5fbcd406596f84' GROUP BY InstanceId",
            "Id": "q1",
            "Period": 300,
            "Label": "avg_cpu"
        },
        {
            "Id": "q2",
            "Expression": "(100 - q1)",
            "Label": "free space"
        }
    ]
},
{
    "time_frame": "5m",
    "region_name": "us-east-1",
    "MetricDataQueries": [
      {
        "Id": "ebs_write_time",
        "Expression": "SELECT AVG(VolumeTotalWriteTime) FROM SCHEMA("AWS/EBS", VolumeId)",
        "Label": "Average EBS Volume Total Write Time",
        "Period":300,
        "ReturnData": true
      }
    ]
},
{
    "time_frame": "5m",
    "region_name": "us-east-1",
    "MetricDataQueries": [
      {
        "Id": "ec2_cpu",
        "Expression": "SELECT MAX(CPUUtilization) FROM SCHEMA("AWS/EC2", InstanceId) GROUP BY InstanceId ORDER BY MAX() DESC LIMIT 10",
        "Label": "top_10",
        "Period":300,
        "ReturnData": true
      }
    ]
}
]
The ID and label fields for the operations within each query are important for linking these queries to the desired Pandora configuration for the data obtained from this operation. Further down in the “module configuration” section, you will find details on how these fields can be linked.
| --conf | Path to the configuration file |
Configuration file (--conf)
[CONF]
agents_group       = < Group for agents created by the plugin >
agent_name         = < Default agent name >
threads            = < Number of threads used by the plugin >
interval           = < Interval in seconds for agents  >
transfer_mode      = < Transfer mode, tentacle or local >
tentacle_ip        = < IP of the destination machine for the agents created >
tentacle_port      = < Tentacle port, default: 41121 >
tentacle_opts      = < Additional tentacle client options >
use_proxy          = < Enable to use proxy mode >
proxy_url          = < URL of the proxy address to use >
ssl_check          = < Enable to activate SSL check >
Example
[CONF]
agents_group       = Applications
agent_name         = AWS
threads            = 4
interval           = 300
transfer_mode      = tentacle
tentacle_ip        = 127.0.0.1
tentacle_port      = 41121
tentacle_opts      =
use_proxy          = 0
proxy_url          =
ssl_check          = 1
Module configuration
The module configuration must be defined in the conf file seen above, under the variables.
The structure for configuring modules for the data obtained from each operation of each query is as follows:
[< ID - The ID defined in the metrics insights operation that is expected to receive the data should go here >]

name = < Name of the module that will generate the data. The macro __label__ can be used.
If this macro is used, the name of the module will be obtained from the label tag in the operation containing the ID defined above. This is useful for queries that return more than
one piece of data, for example, a query that returns the 10 instances with the highest CPU usage. If in the
operation you define label as “cpu,” the return obtained will be "cpu <instance name 1>,
cpu cpu <instance name 2>, cpu <instance name 3> ... and so on, and
these will be the names of the modules generated >

type = < Module type>

description = < Module description >

value = < Value to be collected from the data obtained in the operation,
possible options: last, average, sum, max, min >

agent = < Agent in which the module will be included; if it does not exist, it will be created; if not defined, the modules
will be placed in the default agent
Example of module configuration, according to the metrics defined above:
[q1]
name = __label__
type = generic_data
description = Monitors CPU utilization
unit =percent
value = average
min_warning = 75
min_critical = 85

[q2]
name = __label__
type = generic_data
description = Monitors CPU free space
unit = percent
value = last
min_warning = 11
max_warning = 20
min_critical = 0
max_critical = 10

[ebs_write_time]
name = __label__
type = generic_data
description = Average EBS Volume Total Write Time
value = last
agent = AWS 2 Cloudwatch

[ec2_cpu]
name = __label__
type = generic_data
description = EC2
value = last
Manual execution
The format for executing the plugin is as follows:
./pandora_aws_cloudwatch \
  --creds "<BASE64_OF_YOUR_CREDENTIALS>" \
  --conf "<PATH_TO_CONFIGURATION_FILE>" \
  --query_conf "<PATH_TO_THE_AWS_QUERY_FILE>"
For example:
./pandora_aws_cloudwatch \
  --creds "ededNFAFNAFNAFNAPOFBIUFASBFOABCOAFNOIA==" \
  --conf "</usr/share/pandora_server/util/plugin/main_modules.conf>" \
  --query_conf "</usr/share/pandora_server/util/plugin/cloudwatch_queries.conf"
The execution will return output in JSON format with information about the execution, and will generate an XML file for each monitored agent that will be sent to the Pandora FMS server using the transfer method specified in the configuration.
For example:
{"summary": {"Total agents": 3, "Total modules": 25}}Discovery
This plugin can be integrated with Pandora FMS Discovery.
To do so, you must load the “.disco” package, which can be downloaded from the Pandora FMS library:
https://pandorafms.com/library/

Once loaded, Amazon environments can be monitored by creating Discovery tasks from the Management > Discovery > Cloud section.
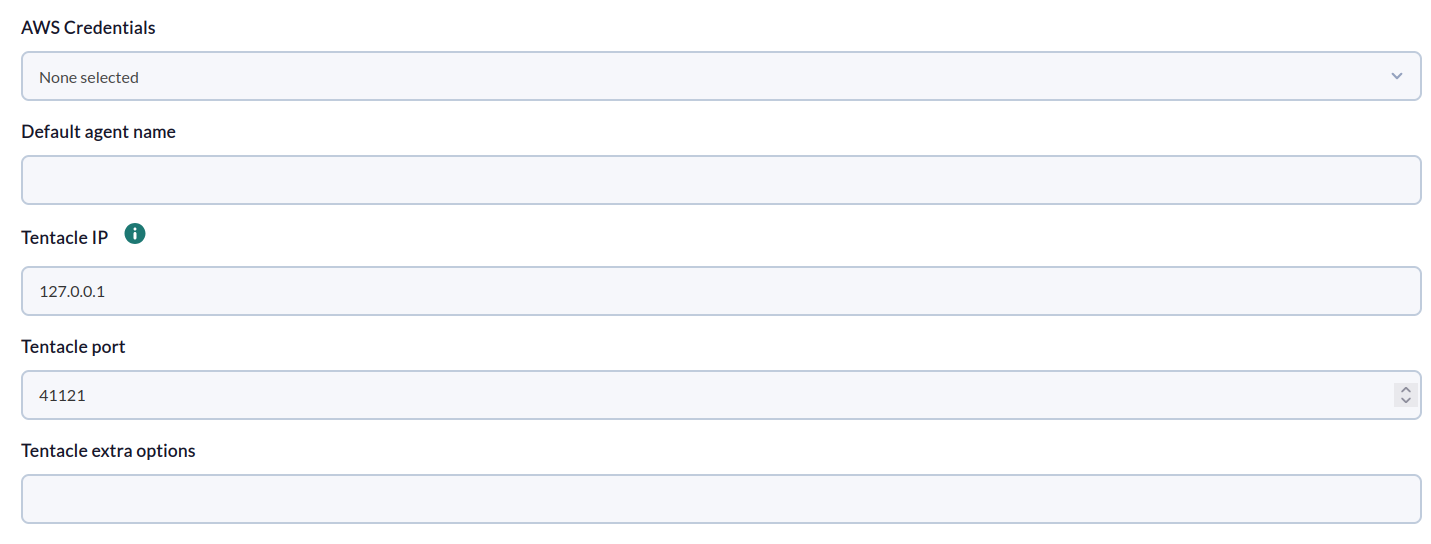
The following minimum data will be requested for each task:
- AWS Credentials: AWS API connection credentials to be used by the task. They must be previously registered in the Pandora FMS credential store.
- Default agent name: Nombre para el agente por defecto (los módulos se crearán aquí cuando no se especifique ningún agente).
- Tentacle IP: IP address of the Tentacle server to which agent data should be sent. Normally, this parameter will not be modified.
- Tentacle port: Port of the Tentacle server to which the data should be sent. Normally, this parameter will not be modified.
- Tentacle extra options: Additional options for sending data using the Tentacle client. Normally, this parameter will not be modified.
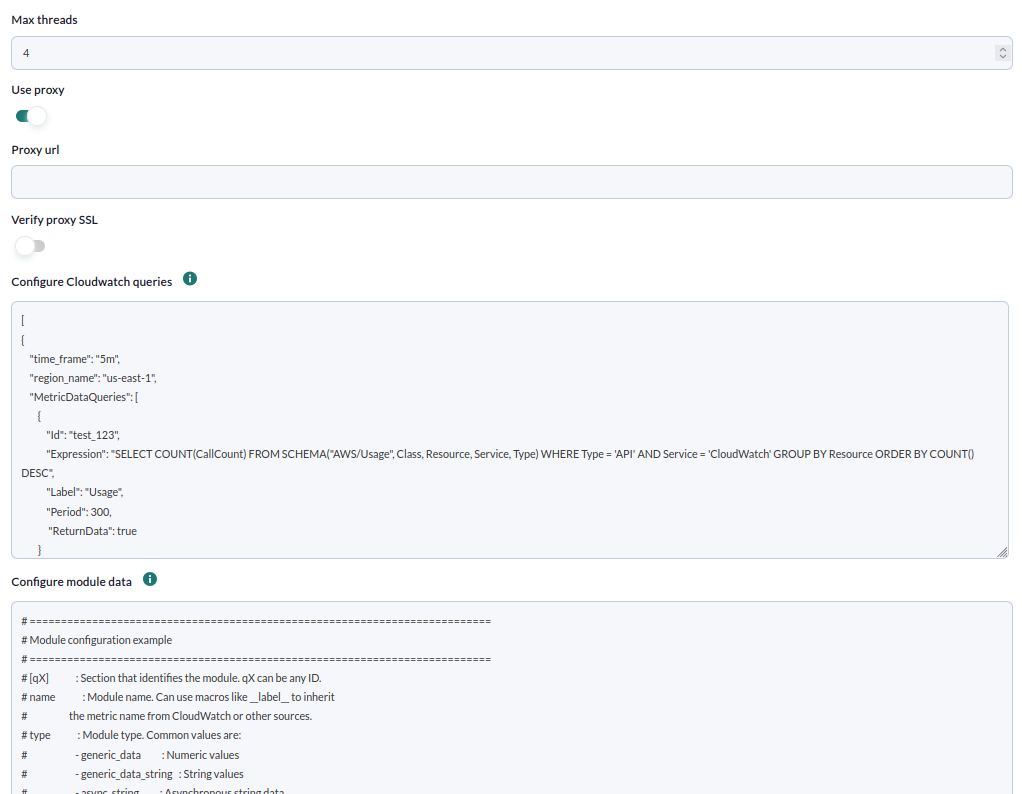
In the following window, the configuration options are as follows:
- Max threads: Number of threads used by the plugin.
- Use proxy: Enable to use proxy mode
- Proxy url: URL of the proxy address to use
- Verify proxy SSL: Check to enable SSL checking
- Configure Cloudwatch queries: Window to configure queries
- Configure module data: Window to configure modules
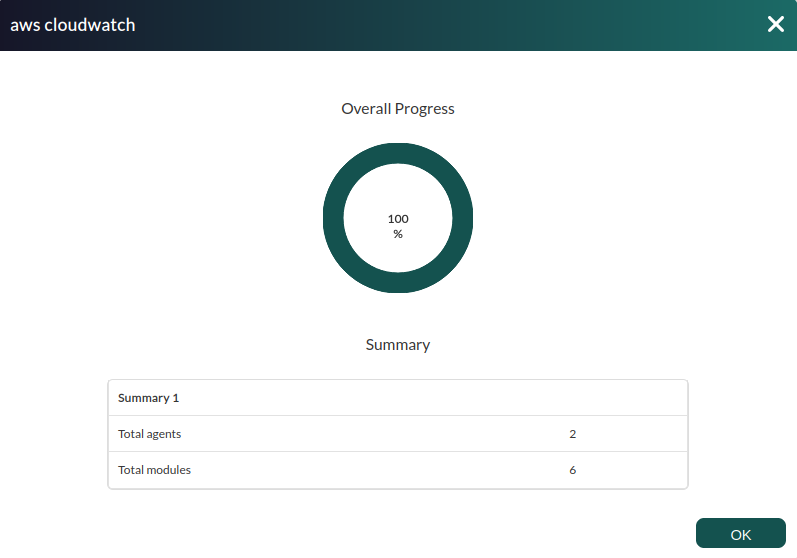
Successfully completed tasks will have an execution summary with the following information:
- Total agents: Total number of agents generated by the task.
- Total modules: Total number of modules generated by the task.
Tasks that are not successfully completed will have an execution summary recording the errors that occurred.
Agents and modules generated by the plugin
The agents and modules generated by the plugin depend entirely on the configuration settings. For example, the following general and metric settings:
Metrics insights configuration
[
{
    "time_frame": "5m",
    "region_name": "us-east-1",
    "MetricDataQueries": [
        {
            "Expression": "SELECT AVG(CPUUtilization) FROM SCHEMA("AWS/EC2", InstanceId) WHERE InstanceId = 'i-01e5fbcd406596f84' GROUP BY InstanceId",
            "Id": "q1",
            "Period": 300,
            "Label": "avg_cpu"
        },
        {
            "Id": "q2",
            "Expression": "(100 - q1)",
            "Label": "free space"
        }
    ]
},
{
    "time_frame": "5m",
    "region_name": "us-east-1",
    "MetricDataQueries": [
      {
        "Id": "ebs_write_time",
        "Expression": "SELECT AVG(VolumeTotalWriteTime) FROM SCHEMA("AWS/EBS", VolumeId)",
        "Label": "Average EBS Volume Total Write Time",
        "Period":300,
        "ReturnData": true
      }
    ]
},
{
    "time_frame": "5m",
    "region_name": "us-east-1",
    "MetricDataQueries": [
      {
        "Id": "ec2_cpu",
        "Expression": "SELECT MAX(CPUUtilization) FROM SCHEMA("AWS/EC2", InstanceId) GROUP BY InstanceId ORDER BY MAX() DESC LIMIT 10",
        "Label": "cpu_usage",
        "Period":300,
        "ReturnData": true
      }
    ]
}
]
General and module settings
[CONF]
agents_group                     = 1
agent_name                       = AWS General
interval                         = 300
threads                          = 3
transfer_mode                    = tentacle
tentacle_ip                      = 172.42.42.101
tentacle_port                    = 41121

[q1]
name = __label__
type = generic_data
description = Monitors CPU utilization
unit =percent
value = average
agent = AWS EC2
min_warning = 75
min_critical = 85

[q2]
name = __label__
type = generic_data
description = Monitors CPU free space
unit = percent
value = last
min_warning = 11
max_warning = 20
min_critical = 0
max_critical = 10

[ebs_write_time]
name = __label__
type = generic_data
description = Average EBS Volume Total Write Time
value = last
agent = AWS 2 Cloudwatch

[ec2_cpu]
name = __label__
type = generic_data
description = Cpu usage
agent = AWS EC2
value = last
It would create the following:
- An agent called AWS EC2 (as defined explicitly in the two modules that execute ec2 queries above).
This agent would contain the following modules:
| One module for each of the 10 instances of the operation with id ec2_cpu, with the following name: cpu_usage <name of each instance> |
| A module for operation q1, with the following name: avg_cpu i-01e5fbcd406596f84 |
| A module for operation q2, with the following name: free cpu i-01e5fbcd406596f84 |
- An agent called AWS general (the default agent)
This agent would contain the following modules:
| A module for the ebs_write_time operation, with the following name: Average EBS Volume Total Write Time |