Hello , I am trying to fill the email alerts with the module graph with the parameter _modulegraph_24_ like this: (Link not available anymore) And when the email arrives, no image is displayed. When checking the connection with the api everything is fine "OK, v7.0NG.720, PC180315" SO: v7.0NG.720 en un Debian GNU/Linux 9.12 (stretch(. In the log nothing is seen, the vmic I understand that it is for windows and netflow to capture network traffic:
In log .error the same:
If someone can help me please, I am investigating and I cannot find anything. Regards, and thank you very much.
"Help please" _modulegraph_ does not work on email alerts.
jaime-casanueva · 21 may 2020, 5:35 · 7 mensajes · 58 visitas
- Inicio del debate
Hello, As I see you are working with Pandora FMS 720 version, it is possible that this is a bug already solved, so the first thing we recommend you is to update Pandora FMS to the last version, the 745. Take into account that you should update the server, console and MR probably, I leave below the link to the wiki where you can see how to do these steps. https://pandorafms.com/docs/index.php?title=Pandora:Documentation\_en:Anexo\_Upgrade Greetings Diego
Thank you very much, I posted it a few days ago in the worst Spanish I see that this is more effective, does anyone know how to migrate the bbdd from version 7.20 to 7.45? I have updated the console and when I open it I get the page fine but with errors in the bbd and it shows everything wrong. If someone knows how to tell me I would appreciate it very much(Link not available anymore)
Hello, Check the Spanish thread, I've updated it just a few minutes before you posted this one. Greetings Diego
Hello, As I see you are working with Pandora FMS 720 version, it is possible that this is a bug already solved, so the first thing we recommend you is to update Pandora FMS to the last version, the 745. Take into account that you should update the server, console and MR probably, I leave below the link to the wiki where you can see how to do these steps. https://pandorafms.com/docs/index.php?title=Pandora:Documentation\_en:Anexo\_Upgrade Greetings Diego
Thank you very much, I posted it a few days ago in the worst Spanish I see that this is more effective, does anyone know how to migrate the bbdd from version 7.20 to 7.45? I have updated the console and when I open it I get the page fine but with errors in the bbd and it shows everything wrong. If someone knows how to tell me I would appreciate it very much(Link not available anymore)
Does _modulegraph_ work for you now? Unfortunately I am having the same problem after upgrading to the 745 version on a CentOS 7. As Diego said the MR's fix the console but the _modulegraph_ on emails are broken for me. Regards, Sam
Hello Sam, Apparently Jaime has no more problems with the macro _modulegraph_ since he updated pandora, I recommend you to check the API and mail configuration you have. In case you don't find a bug, please send us a screenshot with the configuration you have so we can check that there is nothing wrong configured. Greetings Diego
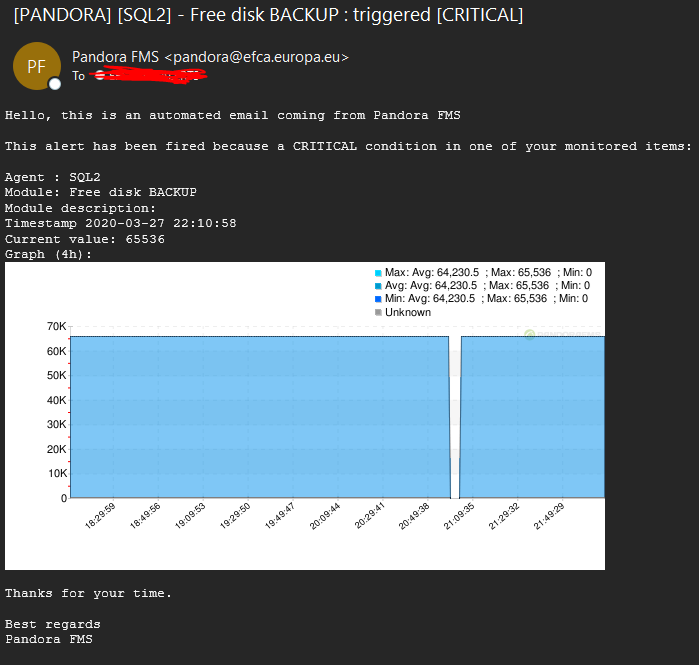
Hello Diego, Thank you for your reply! I have explained my situation in another thread (http://pandorafms.org/forum/thread-15186.html) API configuration: # console_api_url: Api URL (http://localhost/pandora\_console/include/api.php by default) console_api_url http://localhost/pandora\_console/include/api.php # console_api_pass: Api pass # console_api_pass 1234 console_api_pass XXXXXXXXXXXXXX # console_user: Console user name (admin by default) console_user XXXXXXXXXX # console_pass: Console password (pandora by default) console_pass XXXXXXXXXXX curl "http://localhost/pandora\_console/include/api.php op=get&op2=test&apipass=XXXXXXXX&user=XXXXXXXX&pass=XXXXXXXXX" OK,v7.0NG.745,PC200504 Mail configuration: Not sure what you want me to show you here. The alert is received but with the X on the graph
Hello, this is an automated email coming from Pandora FMS This alert has been fired because a CRITICAL condition in one of your monitored items: Agent : _agent_ Module: _module_ Module description: _moduledescription_ Timestamp _timestamp_ Current value: _data_ Graph (4h): _modulegraph_4h_ Thanks for your time. Best regards Pandora FMSLet me just say that this config has been working in the past version and it stopped working after the update. I will also add that I've tried with both user administrators and read-only.
[
](//pandorafms.com/community/media/forum/7427/31428=3572-Capture.PNG)
Thank you for your time, Sam
Entra en tu cuenta para publicar.

