Configuring a HWg-STE Sensor
HWg-STE Temperature Sensor Configuration
Introduction
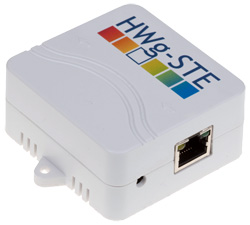
In this configuration quick guide we're going to learn, step by step, how to use Pandora to monitor a HWg-STE Temperature Sensor.
We will assign alerts via eMail and generate a basic report as well.
Installation and configuration
Step #1. Pandora installation
Take a look at the installation manual or begin from a preinstalled Pandora with a virtual image (links).
Step #2. Sensor installation
Let's get started with the HWg-STE sensor:
Manufacturer documentation: http://www.hw-group.com/products/HWg-STE/STE_ip_temperature_sensor_en.html
Sensor manual: http://www.hw-group.com/download/HWg-STE_MAN_en.pdf
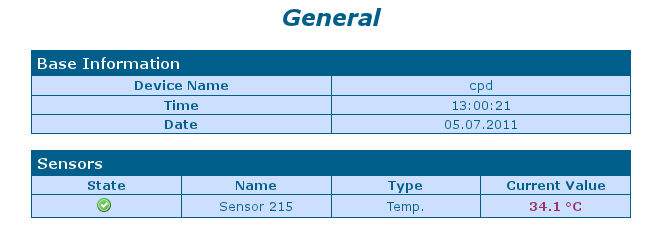
It is really important to take care while configuring the IP address to access the temperature sensor and make sure it is connected. We also need to know its OID. For this purpose, we must access and configure the device via web:
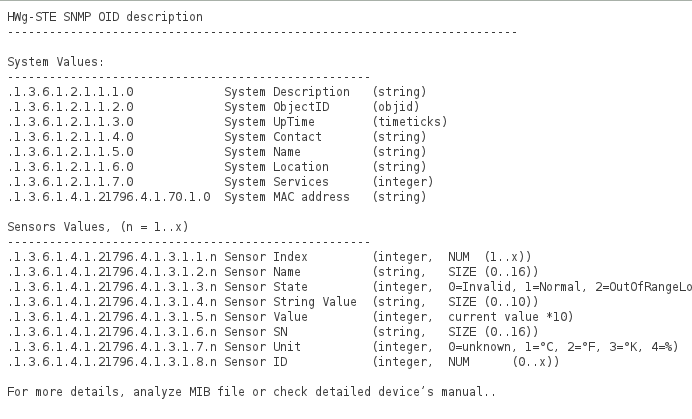
In the screen “System → TXT List of common SNMP OID's” we can check the OID of our sensor:
Since we only have one sensor, the OID will be:
.1.3.6.1.4.1.21796.4.1.3.1.5.1
It is important to note that the device returns the temperature in degrees and without decimal comma in the output. If we want to show the real value, we will have to divide this value by 10. This post-process can be done in Pandora.
And the IP address:
Step #3. Configuring the sensor in Pandora
Let's go to the agent configuration screen. There we are going to create a new agent and fill all the relevant information. This agent must have the same IP address we've just configured in the sensor.:
I have associated it to the Servers group, but it is possible to change it later if I decide to create a Sensors group.
Let's define a SNMP module. Go to the module screen:
Create a module which type is “SNMP Numeric Data Module”.
The SNMP OID field must be filled with the one obtained previously. SNMP community is “public” by default.
I need to open the advanced section, to specify a post-process which can divide the result by 10.
Time to click on the “Create” button:
Right after creating the module, we should see something like this:
If we click in the bulb button… (modules)
The previous look the new module had should have changed, and appear without the red triangle icon, by initialising it:
If we take a look to the agent view… (Magnifying glass)
We will be able to see the data we've gathered from the sensor:
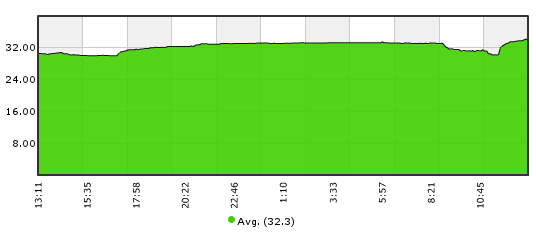
Module is up and running. In a matter of hours we will have enough data to display a graphic like this:
Step #4. Configuring an alert
When temperature reaches a value over 38 degrees, we want an alert to be generated via email. The first thing we have to do is to configure the module, so it gets into critical status when its value gets over 38 degrees.
Let's edit the module… (click on the key, inside the edition view or the agent data view)
We need to modify the ranges so the module gets into critical status over 38ºC:
Now we will have to define an alert action to send an email to a specific email address. Let's go to the menu Administration → Manage alerts → Actions to create a new one.
We are going to define an generic alert action to send an email, so we can use it with any moudule entering into a CRITICAL status:
After creating the action, we only have to define an alert in the agent which contains the sensor module. To achieve this, we need to edit the agent by going to the alerts sections:
Create a new alert, starting from the default template alert “Critical condition”:
OK… the new alert is ready. We should see something like this:
Step #5. Creating a basic report
Finally, once we have completed the previous steps, it is time to create a report which will contain a basic temperature graphic, with the average and maximum values.
Let's go to the menu Administration → Reports → Create report:
Click on the key button so we can add new elements to the report. Choose a “Simple graph” element type.
Following the same procedure, create other two elements with types “AVG (Average value)” and “MAX (Maximum value)” respectively.
Once created, in order to view it, we need to click in the report view button (first to the left). Another choice is to go to the menu Operation → Report and click on the report we've just created.
The report should look like this (once it has enough data, after some hours/days).


 Home
Home


