Cluster Monitoring
Introduction
Version NG 719 or later.
Pandora FMS has a new feature that allows to monitor clusters regardless of the system or the application you use.
The purpose of this system is to ensure fast and easy cluster monitoring, but specially to be user-friendly.
There are two types of clusters:
- Active - Passive: These are those clusters where there is only one node running simultaneously.
- Active - Active :These are those where the application or service provided is balanced between all cluster nodes.
In a cluster, there are several types of elements:
Common Elements
Modules that must remain active in all cluster nodes, essential for clustering to work.
Balanced Elements
These are the modules that will be executed as long as the node is active, they will “balance” from one node to another of the cluster, they will report in one agent or another depending on the machine that executes the application.
Balanced elements are only needed in the case of clusters of the Active - Pasive type.
Planning monitoring
When monitoring a cluster, this must be taken into account:
If it is an active- active cluster
The common modules to be monitored must be present in all cluster agents. Otherwise it will not be possible to select them.
Then it will be necessary to create identical monitors on all cluster agents to monitor the desired resources.
If it is a passive - active cluster
Common modules will follow the same setup as an active - active. But balance module monitoring must be only configured in the active node.
To be able to monitor “the active node”, use conditioned monitoring, where the module will only report when a series of terms are met.
Configuring a new cluster
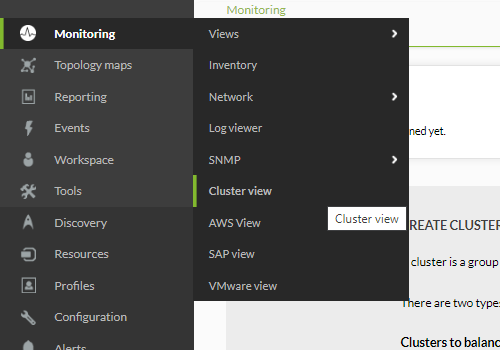
To create a new cluster, go to Monitoring > Cluster view .
If this is the first time you access this screen, you should see a page similar to the next one:
Configuring a new cluster Active-Active
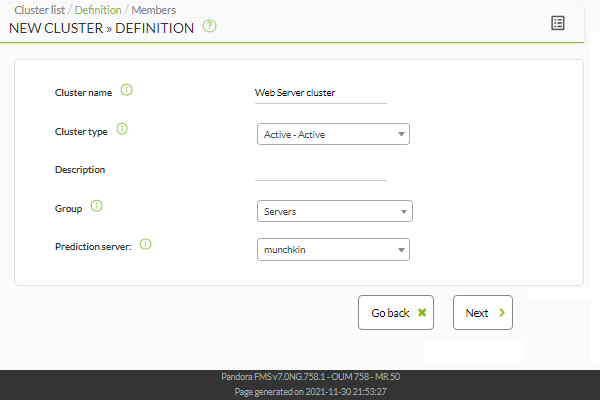
Click Create cluster to start the cluster creation wizard, selecting for this example the “Active - Active” Cluster type option:
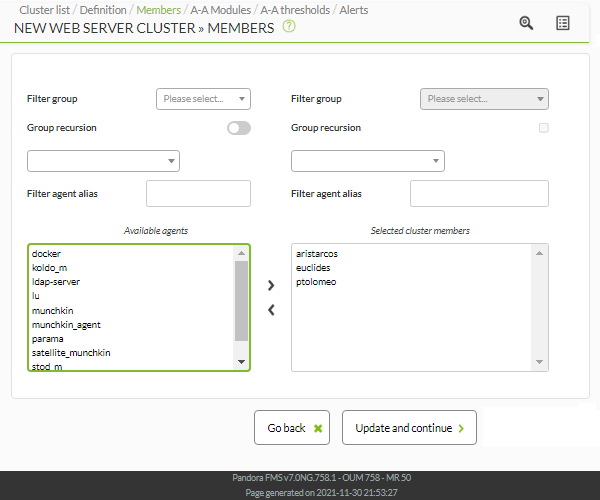
Once you have selected a name, a cluster type and a target group, click Next to access the section on selecting agents.
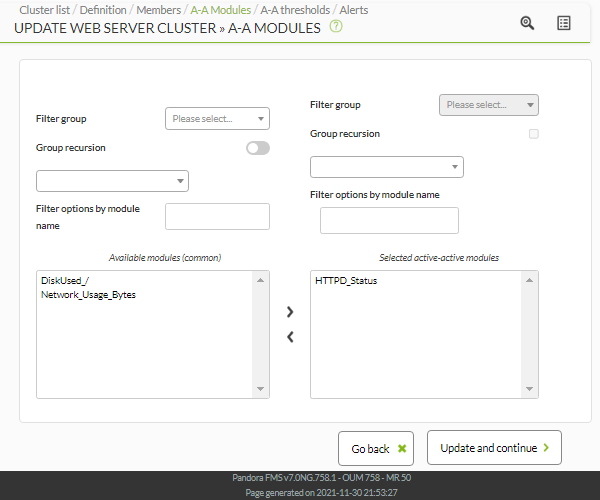
In this step, select all critical modules for the service to monitor from those agents that have been added to the cluster:
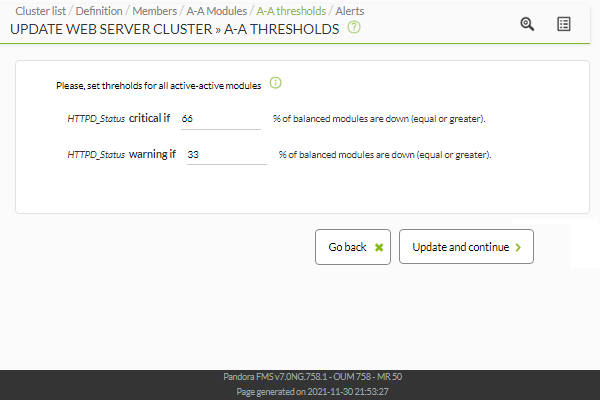
Select a threshold in percentage of nodes (%) to define the cluster states based on common modules (OK/not OK).
After configuring the cluster, add alerts about the different cluster elements so that a certain action is carried out when changing the selected modules to a specific status.
After adding the alrts, click Finish. After module evaluation, you will see the cluster map with the status information.
Active - Active cluster view
If your cluster is Active - Active, you can only see the common elements.
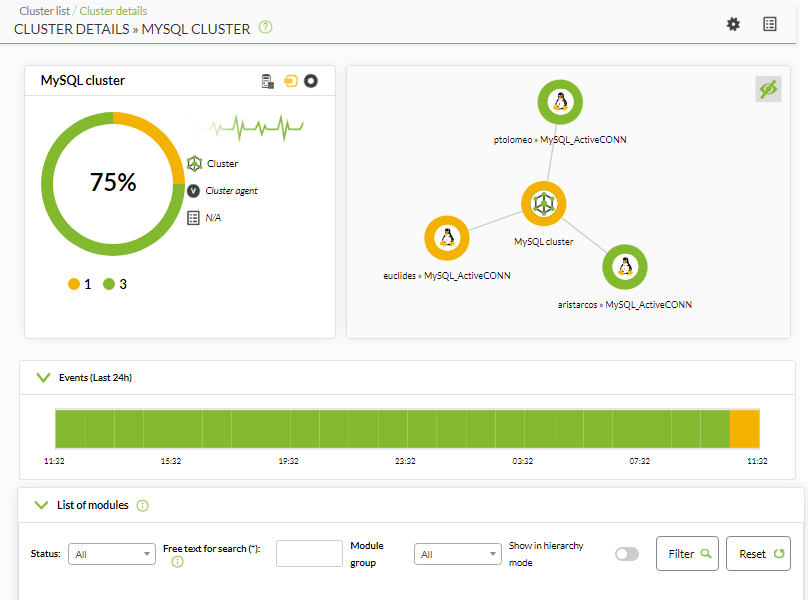
This is the view after following the creation example described in the previous section:
Cluster Map
It represents the agents that make up the cluster and their status.
Status Overview
It shows the health status of the cluster, as well as the list of its elements.
Metrics View
It shows the complete list of metrics registered in the cluster.
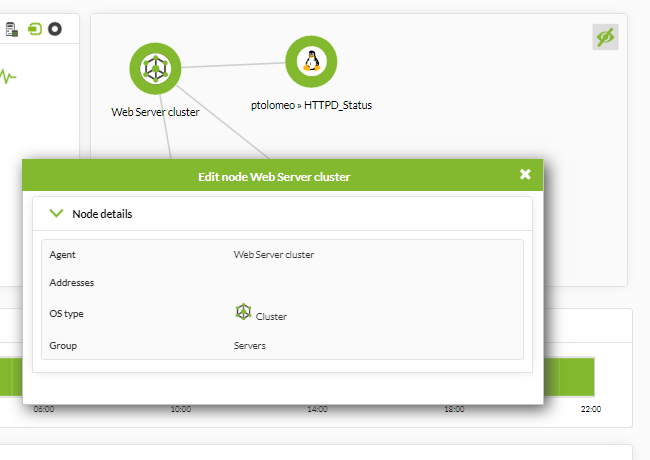
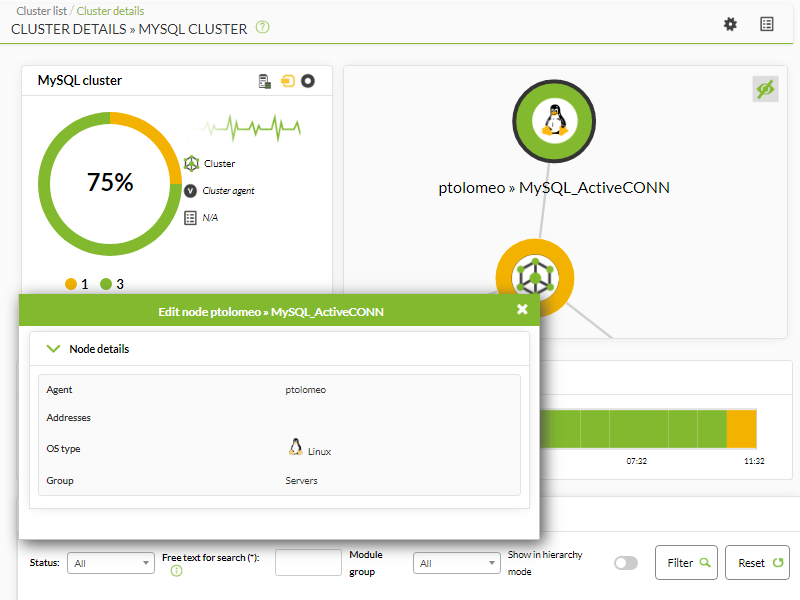
If you click on an item in the cluster map, you may see extra information about that item. Detailed view of cluster status (click on the map icon):
When interpreting data shown in data and status columns, it is important to keep in mind the following considerations:
- TIf there is a cluster module that contains three modules:
- If the three of them are in normal status, the value will be
0. - If there is two of them in normal and one in warning status, you will see
33.3. - If there is one in normal, one in warning and one in critical, you will see
66.7.
- These thresholds indicate module percentage in a state different from normal.
Configuring a new Active-Passive cluster
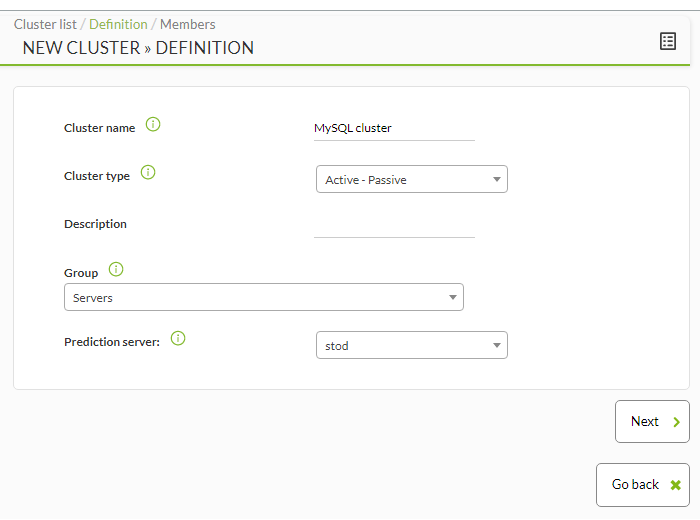
Click New cluster to start the cluster creation wizard, selecting for this example the “Active - Passive” Cluster type option:
Once you have selected a name, a cluster type and a target group, click Next to access the selecting agent section. You may return to the previous step at any point of the process by means of the Go back button.
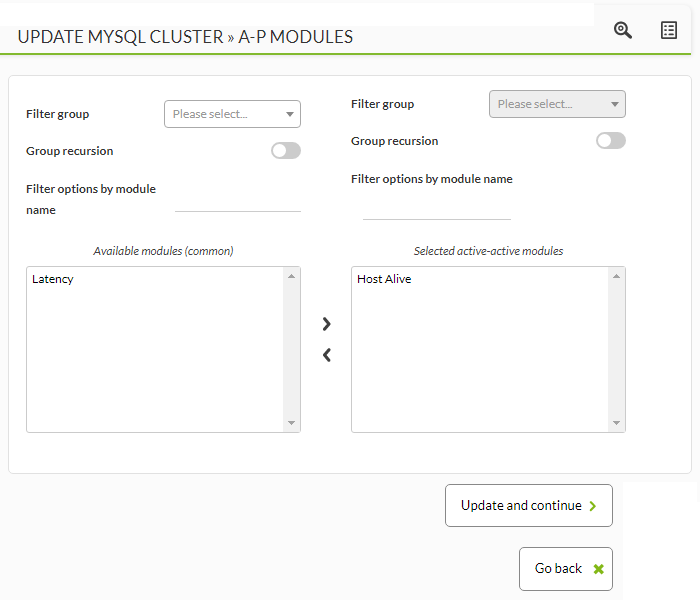
Select in this step all the critical modules for the service that you wish to monitor among the agents that have been added to the cluster:
Then select a node percentage threshold (%) is selected to define the cluster states based on common modules (OK/not OK).
In this step, balanced modules are added (those that are reporting in the active agent). The list shows all the modules from all agents that are part of the cluster.
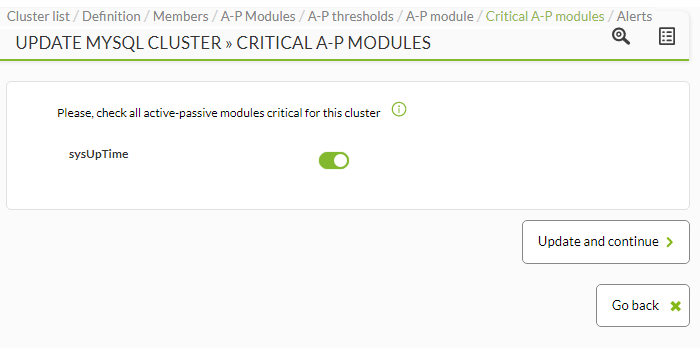
In this last section, the balanced modules critical for the Active - Passive cluster must be selected:
The modules on the passive node are not created automatically, they must be manually configured and then added to the cluster.
After cluster setup, you may add alerts on the different cluster elements, so that a specific action is performed when changing the desired modules to a specific status.
After evaluating the modules you will see the cluster map with the status information.
Active - passive cluster view
Example:
Cluster Map
It represents the agents that make up the cluster and their status.
Metric View
It shows the complete list of metrics registered in the cluster.
If you click on an item in the cluster map, you may see extra information about that item:


 Home
Home

