Events
Introduction
Pandora FMS event system allows to see a real time register of all the events that take place in your monitored systems. The information displayed ranges from any module status change, alerts triggered or retrieved, to system restarts or custom events. By default, in the event view, a screenshot of what is happening at that time will be shown.
Events are the register and a fundamental part of a monitoring system.
Events are classified by their severity:
- 0 Maintenance (White/Grey).
- 1 Informative (Blue).
- 2 Normal (Green).
- 3 Warning (Yellow).
- 4 Critical (Red).
- 5 Minor (Pink).
- 6 Major (Brown).
The following actions can be performed in regard to an event:
- Change its status (validated or in progress).
- Change the owner.
- Delete.
- Show additional information.
- Add a comment.
- Apply custom responses.
General information
Events are managed in Operations → Events → View Events.
The event viewer shows a summary of each event and sometimes other associated data, such as the agent module that generated the event, the group, module-related tags, etc. You may also sort events by identifier, status, name, among other fields.
By clicking on the zoom icon, corresponding to each item, you will get more details.
Users will be able to see only the groups to which they belongs, unless they explicitly belong to group ALL.
The events presented are those of the last eight hours and non-validated ones by default (and can also be customized), in addition to being grouped to avoid redundancy. You may save searches as filters or apply a previously created filter.
Operating with events
Event validation and status. Autovalidation
An event may be in four different status:
- In process.
- New.
- Not validated.
- Validated.
Autovalidation
When events take place due to module status changes, there will usually be two events: the first event is the change from normal to “faulty” state, and the second one is the event going back to normal once the problem is solved. In these cases, events going into a faulty state (critical or warning) are automatically validated when they go back to normal. This is what it is called event autovalidation and it is an extremely useful feature.
Manual validation
When working manually, an event can be validated. That will make the system save the date and the user who validated the event. It is also possible to leave a comment, by clicking on the validate button, the screen is refreshed and the validated event “disappears”.
Note that, in addition, there are more options such as executing customized responses such as pinging the host, assigning a user, among others.
Individual or batch processes
You may validate, check as “in process” or delete events individually by clicking on the corresponding icons, or mass apply them to a selection.
Regarding custom responses, the maximum number of events to which the operation applies is limited to ten.
Event filtering
Important aspects of this feature:
- Filters can be saved to be used again later on.
- The limit for old events (Max. hours old) can be customized.
- Pandora FMS, by default, groups repeated events (Duplicate → Group events), however this preference can be changed:
- All events: Display all events individually.
- Group agents: Group events by agent.
- Group events: The event name, agent ID and module ID are used to identify duplicates.
- Group Extra IDs: Events will be grouped by Extra ID only, sorted by Timestamp.
- You may filter by specific group. If you use the Group recursion option, it will also search in the subgroups of that group. Likewise, if you select Search in secondary groups, the events of agents with assigned secondary groups will be included.These last two options may imply some work impact on PFMS server.
Advanced options
- You may search for events that took place within a certain period of time using the date fields From (date) and To (date).
- In the Free search field you may use a regular expression (for example, to search for
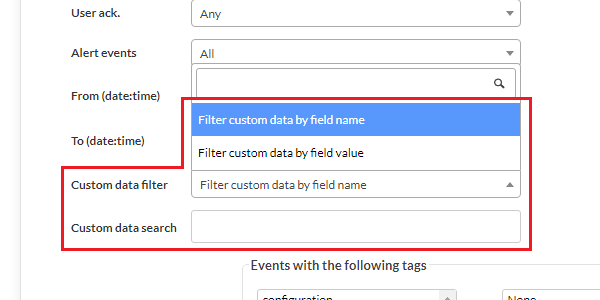
ConnectionsandNetworkenter(Connections|Network)). The search is performed by agent name, event name, extra ID, source, custom data and comments. - You may filter by custom fields using the Custom data filter fields, either by filtering the field name (Filter custom data by field name) or by custom field content (Filter custom data by field value). These fields will be displayed as columns in the event view.
Favorite filters
NG 770 version or later
The event filters that you consider most frequently used can be added to the Events section in the Favorite menu (Operation menu). This is done by clicking on the star icon that will appear when loading a saved filter (Current filter). Clicking it again allows you to uncheck the icon and remove it from the favorites system.

Deleting an Event
Events can be deleted individually (manually) and/or automatically: in the menu Management → Setup → Setup → Setup → Max. days before events are deleted you may specify, in days, the period to be kept.
![]() In the Enterprise version, by activating Enable event history in Management → Setup → Setup → Historical database, you have the option to keep them for the purpose of creating special reports.
In the Enterprise version, by activating Enable event history in Management → Setup → Setup → Historical database, you have the option to keep them for the purpose of creating special reports.
RSS Events
- To access event RSS feed, configure the IP addresses that allow access in the field IP list with API access within Setup.
- You will also need an RSS reader such as Inoreader, Selfoss or your favorite RSS reader.
To see events in a news channel or RSS go to Operation → Events → RSS and subscribe from the news reader of your choice.
Event sound console
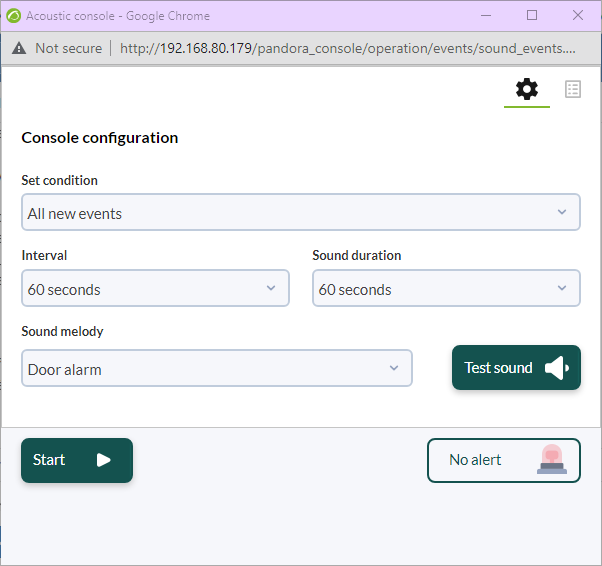
It allows to spread the sound alerts when an event takes place. The tune will be played until you pause the sound event or click OK.
The list of sound events that generate a sound alert by default (and may be customized) is:
- A triggered alert.
- A module going into warning state.
- A module going into critical state.
- A module going into unknown state.
Go to Operation → Events → Acoustic console. This action opens a popup window control for all sound events. You must configure your web browser to allow pop-up windows to open.
Minimizing the Acoustic Console window will cause it not to work as expected.
Sound events are explored every 10 seconds asynchronously, when an event takes place, the window will start blinking in red or vibrating and in addition, depending on the configuration of your browser or operative system, the window will keep the focus and stay over the rest of the open windows.
You will only get sound alerts for events that start right from and while that window is open, that match selected items and that have an alarm set.
Advanced Configuration
To add new tunes, copy said files in WAV format, to the directory:
/var/www/pandora_console/include/sounds/
Exporting Events to a CSV
In order to export the events to a CSV file, click on Operation → Events → View events → Export to CSV File.
Event alerts. Event correlation
For Pandora FMS release 741 onwards, there is event related alert management, a specific wiki section.
Events from the Command Line
Event creation and validation
Pandora FMS external API is used making remote calls (through HTTPS) on the /include/api.php file. This is the method defined in Pandora FMS to integrate third party applications. It basically consists of a call with the parameters formatted to receive a value or a list of values that this application will use to carry out operations.
By using the WEB API, you may interact with Pandora FMS from any remote system, even if you do not have connection to the database with an installed Software agent.
The three main points to activate Pandora FMS API:
- Enable the API access for the IP from wich the command will be executed or use '*' for all IPs.
- Set an API password
- Use a user/password to login, or define a specific user to access it through API.
The password devoted to creating or validating events through Pandora FMS API may be copied from:
/usr/share/pandora_server/util/pandora_revent.pl
When executed in the client device, without parameters, you may see its full syntax.
Options to validate an event:
./pandora_revent.pl -p <path_to_consoleAPI> -u <credentials> -validate_event <options> -id <id_event>
For instruction unknown, critical o warning fields to appear in the details of the generated event, said event must be going_unknown, going_down_critical, or else going_down_warning, accordingly.
Sometimes, maybe for security reasons, it is necessary to count only with the event creation option, so pandora_revent_create.pl can be copied to the client device. It is located at:
/usr/share/pandora_server/util/pandora_revent_create.pl
This tool has similar features to those of pandora_revent.pl.
Custom fields within events
Events with custom fields may be generated by the Pandora FMS CLI, e.g. An event generated by the following command:
perl pandora_manage.pl \
             /etc/pandora/pandora_server.conf \
             --create_event 'Custom event' system Firewalls \
             'localhost' 'module' 0 4 '' 'admin' '' '' '' '' \
             '{"Location": "Office", "Priority": 42}'
Event setup
Through Management → Configuration → Events it is possible to configure:
- Personalized columns.
- Answers to events.
- Filter configuration.
Custom event view
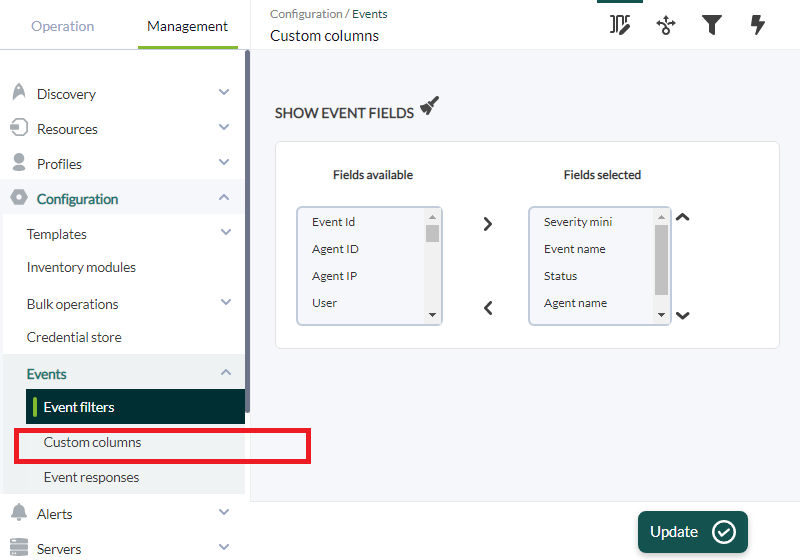
It is possible to customize the fields that the Event View shows by default from the Events → View events, click on Manage events → Custom columns section, where the fields to be shown can be chosen.
The default fields are five, however there are more fields to add:
- Event ID.
- Agent name.
- User.
- Group.
- Event type.
- Module name.
- Alert.
- Severity.
- Comment.
- Tags.
- Source.
- Extra ID.
- Owner.
- ACK Timestamp.
- Instructions.
- Server name.
- Data.
- Module status.
- Module custom ID.
Creating Event Filters
Management → Configuration → Events → Events → Events filters menu.
Allows you to create, delete and edit the filters applied to the event view. After saving you can go to View events and load the appropriate filter.
Event Responses
Introduction
An event response is a customized action that can be executed on an event, such as creating a ticket in Pandora ITSM with the relevant event information. You may get more information about Integria IMS in the Pandora FMS documentation].
Enter a representative name, description, the parameters to be used separated by commas, the command to be used (the latter allow the use of macros), the type and the server that will execute the command. In Parameters you can put as many as you need, separated by commas. When the response is made, a dialog box will appear to fill in each one of them and add it to the event.
Event Responses macros
_agent_address_
Agent address.
_agent_alias_
Agent alias.
_agent_id_
Agent ID.
_agent_name_
Agent name.
_alert_id_
Event related alert ID.
_command_timeout_
Command response time (seconds).
_current_user_
Id of the user who executes the response.
_current_username_
Full name of the user executing the response.
_customdata_json_
Pulls all information from custom data in JSON format.
_customdata_text_
Pulls all information from custom data in text mode (with carrier return).
_customdata_X_
Pulls a particular field from custom data, replacing the X with the field's name.
_event_date_
Date on which the event took place.
_event_extra_id_
Extra event ID.
_event_id_
Event ID.
_event_instruction_
Event instructions.
_event_severity_id_
Event severity ID.
_event_severity_text_
Event severity (translated by Pandora FMS console).
_event_source_
Event source.
_event_status_
Event status (new, validated or event in process).
_event_tags_
Event tags separated by commas.
_event_text_
Full text of the event.
_event_type_
Event type (System, going into Unknown Status…).
_event_utimestamp_
Date on which the event occurred in utimestamp format.
_group_id_
Group ID.
_group_name_
Group name in database.
_group_contact_
Contact information for a group of agents.
_module_address_
Event associated module address.
_module_id_
Event associated module ID.
_module_name_
Event associated module name.
_node_id_
For Metaconsole and Node, returns the node identifier.
_node_name_
For Metaconsole and Node, returns the node name.
_owner_user_
Event owner user.
_owner_username_
Full name of the user who owns the event.


 Home
Home


