
 Home
Home
Volumetric and capacity studies
Capacity study
Introduction
Pandora FMS is a quite complex distributed application that has several key elements, that could be a bottleneck if it is not measured and configured correctly. The main aim of this study is to detail the scalability of Pandora FMS regarding on an specific serial of parameters to know the requirements that it could have if it gets an specific capacity.
Load test were made in a first phase, aimed to a cluster based system, with an unique Pandora server centralized in a DDBB cluster. The load test are also useful to observe the maximum capacity per server. In the current architecture model (v3.0 or later), with “N” independent servers and with one Metaconsole , this scalability tends to be linear, while the scalability based on centralized models would be of the kind shown in the following graph:

Data Storage and Compaction
The fact that Pandora FMS compact data in real time, it's very important related to calculate the size the data will occupy. An initial study was done that related the way that a classic system stored data with the Pandora FMS “asynchronous” way of storing data. This could be seen in the schema that is included in this section.

In a conventional system
For a check, with an average of 20 iterations per day, it gives a total of 5 MB per year in filled space. For 50 checks per agent, this results 250 MB per year.
In a non conventional system, asynchronous like Pandora FMS
For a check, with an average of 0.1 variations per day, it gives a total of 12.3 KB per year in filled space. For 50 checks per agent, this results in 615 KB per year.
Specific Terminology
Next is described a glossary of specific terms for this study, for a better comprehension.
- Fragmentation of the information: the information that Pandora FMS manages could have different performances, it could change constantly (e.g. a CPU percentage meter), or be static ( for example, determine the state of one service). As Pandora FMS exploits this to “compact” the information in the database (DB), it's a critical factor for the performance and the study of the capacity, so the more fragmentation, the more size in the DB and more capacity of process will be necessary to use in order to process the same information.
- Module: is the basic piece of the collected information for its monitoring. In some environments is known as Event, in others as a monitor and in others as a metric..
- Interval: is the amount of time that pass between information collects of one module. It is usually expressed in minutes or seconds. The “average” value is usually 5 minutes.
- Alert: is the notification that Pandora FMS executes when a data is out of the fixed margins or changes its state to
CRITICALorWARNING.
Example of Capacity Study

Definition of the Scope
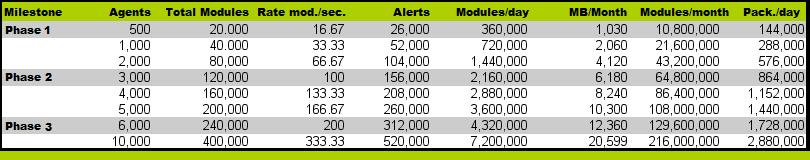
The study has been done thinking about a deployment divided in three main phases:
- Stage 1: Deployment of 500 agents.
- Stage 2: Deployment of 3000 agents.
- Stage 3: Deployment of 6000 agents.
In order to determine exactly Pandora FMS's requisites in deployments of this data volume, you should know very well which kind of monitoring you want to do. For the following study we have taken into account in an specific way the environment characteristics of a fictitious client named “QUASAR TECNOLOGIES” that could be summarized in the following points:
- Monitoring 90% based on software agents.
- Homogeneous systems with a series of features grouped in Technologies/policies.
- Very changeable intervals between the different modules /events to monitor.
- Big amount of asynchronous information (events, log elements).
- Lot of information about processing states with little probability of change.
- Little information on performance regarding the total.
After doing an exhaustive study of all technologies and determine the reach of the implementation (identifying the systems and its monitoring profiles), the following conclusions have been reached:
- There is an average of 40 modules/events per system.
- The average monitoring interval is of 1200 seconds (20 minutes).
- There are modules that report information every 5 minutes and modules that do it once per week.
- From the whole group of total modules (240,000) it has been determined that the possibility of change of each event for each sample is 25%
- It has been determined that the alert rate per module is 1.3 (that is: 1.3 alerts per module/event).
- It is considered (in this case it is an estimation based on our experience) that an alert has 1% chances of being fired.
These conclusions are the basis to prepare the estimation, and are codified in a spreadsheet used to do the study:

With these start up data, and applying the necessary calculations, we can estimate size in database, number of modules per second that are necessary to process and other essential parameters:
Capacity Study
Once you know the basic requirements for the implementation in each phase (modules/second rate), the number of total alerts, the modules per day and megabytes / month, the next step is to do a real stress test on a server quite similar to the production systems (the test could not be done in a system similar to the production ones).
These stress tests will inform about the processing capacity that Pandora FMS has in a server, and what its degradation level with time is. This should be useful for the following goals:
- Through an extrapolation, to find out whether the final volume of the project will be possible with the hardware given to do that.
- To know which are the online storage limits and which should be the breakpoints from which the information moves to the historic database.
- To know the response margins to the process peaks, coming from problems that could appear (service stop, scheduled stops) where the information expecting for being processed would be stored.
- To know the impact in the performance derived of the different quality (change percentage) of the monitoring information.
- To know the impact of the alert process in big volumes.
The tests have been done on a DELL server PowerEdge T100® with 2,4 Ghz Intel Core Duo® Processor and 2 GB RAM. This server, working on an Ubuntu Server 8.04, has given us the base of our study for the tests on High Availability environments. The tests have been done on agent configurations quite similar to that of the QUASAR TECHNOLOGIES project, so the same hardware is not available, but a high availability environment is replicated, similar to the QUASAR TECHNOLOGIES to evaluate the impact on the performance as times goes on and determine other problems (mainly dealing with usability) derived from managing big data volumes.

The obtained results are very positive, so the system, though very overloaded, was able to process a quite interesting information volume (180,000 modules, 6000 agents, 120,000 alerts). The conclusions obtained from this study are these:
1. The “real time” information should be moved to the history database in a maximum period of 15 days, being the best to do it for more than one week data. This guarantees a faster operation.
2. The maneuver margin in the best of cases is nearly the 50 % of the process capacity, higher than expected, taken into account this information volume.
3. The fragmentation rate of the information is vital to determine the performance and the necessary capacity for the environment where you want to deploy the system
Methodology in detail
The previous chapter was a “quick” study based only in modules typer “dataserver”, this section shows a more complete way of doing an analysis of Pandora FMS capacity.
As starting point, in all cases it is assumed the worst-case scenario as long as it can be chosen. If you cannot choose it, it will be the “Common case” philosophy. It will be never considered anything in the “best of cases” since this phylosophy is not valid.
Next step is how to calculate the system capacity, by monitoring type or based on the information source.
Data Server
Based on the achievement of certain goals, as we have seen in the previous point, we suppose that the estimated goal is to see how it works with a load of 100,000 modules, distributed between a total of 3,000 agents, that is, an average of 33 modules per agent.
A task will be created of pandora_xmlstress, executed through cron or manual script, that has 33 modules, distributed with a configuration similar to this one:
- 1 string module.
- 17
generic_procmodules. - 15
generic_datamodules.
The thresholds of the 17 generic_proc modules must be configured this way:
module_begin
module_name Process Status X
module_type generic_proc
module_description Status of my super-important daemon / service / process
module_exec type=RANDOM;variation=1;min=0;max=100
module_end
In the 15 generic_data modules, you should define thresholds. The procedure to follow is the following:
Configure the thresholds of the 15 generic_data modules, so data like this one will be generated:
module_exec type=SCATTER;prob=20;avg=10;min=0;max=100
Then, configure the thresholds for these 15 modules, so they have this pattern:
 0-50 normal
 50-74 warning
 75- critical
Add to the configuration file of your pandora_xml_stress some new tokens, to be able to define the thresholds from the XML generation. Attention: Pandora FMS only “adopts” the definition of thresholds in the creation of the module, but not in the update with new data.
module_min_critical 75
module_min_warning 50
Execute pandora_xml_stress.
It should be left running at least for 48 hours without any kind of interruption and you should monitor (with a Pandora FMS agent) the following parameters:
- Number of queued packages:
find /var/spool/pandora/data_in | wc -l
pandora_serverCPU:
ps aux | grep "/usr/bin/pandora_server" | grep -v grep | awk '{print $3}'
pandora_servertotal memory:
ps aux | grep "/usr/bin/pandora_server" | grep -v grep | awk '{print $4}'
- CPU used by mysqld (check execution syntax, it depends of the MySQL distro)
ps aux | grep "sbin/mysqld" | grep -v grep | awk '{print $3}'
- Pandora FMS DDBB response average time:
/usr/share/pandora_server/util/pandora_database_check.pl /etc/pandora/pandora_server.conf
- Number of monitors in
unknownstate:
echo "select SUM(unknown_count) FROM tagente;" | mysql -u pandora -p<password> -D pandora | tail -1
(where <password> is pandora user password).
The first executions should be useful to tune the server and the MySQL configuration.
Use the script /usr/share/pandora_server/util/pandora_count.sh to count (if are XML files pending to process) the rate of package proccessing. The goal is to make possible that all the packages generated (3000) can be processed in an interval below the 80% of the limit time (5 minutes). This implies that 3,000 packages should be processed in 4 minutes, so:
3000 / (4x60) = 12.5
You should get a processing rate of 12.5 packages minimum to be reasonably sure that Pandora FMS can process this information.
Elements for adjusting:
- Number of threads.
- Number maximum of items in intermediate queue (
max_queue_files). - Of course, all applicable MySQL parameters (very important).
Importance of all of this: One Pandora FMS installation with a GNU/Linux server installed “by default” in a powerful machine, can not exceed 5-6 packages by second, in a powerful machine well “optimized” and “tuned” it could perfectly reach 30-40 packages by second. It also depends a lot of the number of modules within each agent.
Configure the system in order that the DDBB maintenance script at /usr/share/pandora_server/util/pandora_db.pl will be executed every hour instead of every day:
mv /etc/cron.daily/pandora_db /etc/cron.hourly
Leave the system working, with the package generator a minimum of 48 hours. Once this time has passed, evaluate the following points:
- Is the system stable?, Is it down? If there are problems, check the logs and graphs of the metrics obtained (mainly memory).
- Evaluate the tendency of time of the metric “Number of monitors in unknown state”. There should be not tendencies neither important peaks. They should be the exception: If they happen with a regularity of one hour, it is because there are problems with the concurrency of the DB management process.
- Evaluate the metric “Average time of response of the pandora DDBB”. It should not increase with time but remain constant.
- Evaluate the metric “pandora_server CPU”, it should have many peaks, but with a constant tendency, not rising.
- Evaluate the metric “MYSQL server CPU”; it should be constant with many peaks, but with a constant tendency, not rising.
Evaluation of the Alert Impact
If everything was right, now will evaluate the impact of the alert execution performance. Apply one alert to five specific modules of each agent (generic_data type ), for the CRITICAL condition. Something not really important, like creating an event or writting to syslog (to avoid the impact that something with hight latency could have, like for example sending an email message).
Optionally create one event correlation alert to generate one alert for any critical condition of any agent with one of these five modules.
Leave the system operating 12 hours under those criteria and evaluate the impact, following the previous criteria.
Evaluating the dat purging and moving
Supposing the data storage policy was:
- Event deletion from more than 72 hours.
- Moving 7-day-older data to the history.
You should let the system working “by itself” during at least 10 days to evaluate the long term performance. You could see a “peak” 7 days later due to moving data to the history DB. This degradation is important to consider. If you do not have so many time available, it is possible to replicate (with less “realism”) changing the purging interval to 2 days in events and 2 days to move data to history, to evaluate this impact.
ICMP Server(Enterprise)
This is specifically for the ICMP network server. In case of doing the tests for the Open network server, please see the corresponding section of the network server (generic).
Supposing that server is already working and configured, some key parameters for its performance:
block_size X
It defines the number of “pings” that the system will do for any execution. If the majority of pings are going to take the same time, you can increase the number to a considerably high number, i.e: 50 to 70
On the contrary, the module ping park is heterogeneous and they are in very different networks, with different latency times. It is not convenient to set a high number, because the test will take the time that it takes the slower one, so you can use a number quite low, such as 15 to 20.
icmp_threads X
Obviously, the more threads it has, the more checks it will be able execute. If you make an addition of all the threads that Pandora FMS executes, they will not be more than 30 to 40. You should not use more than 10 threads here, thought it depends a lot on the kind of hardware and GNU/Linux version that you are using.
Now “create” a made up number of ping modules to test. It is assumed that you are going to test a total of 3,000 ping modules. To do this, the best option is to choose a system in the network that would be able to support all pings (any GNU/Linux server would do it)
Using the Pandora CSV importer (available in the Enterprise version), create a file with the following format:
(Agent name, IP,os_id,Interval,Group_id)
You may use this shellscript to generate this file (changing the destination IP and the group ID)
A=3000
while [ $A -gt 0 ]
do
    echo "AGENT_$A,192.168.50.1,1,300,10"
    A=`expr $A - 1`
done
Before starting all this process, Pandora FMS server must be running and monitoring, measuring the metrics from the previous point: CPU consumption (pandora and mysql), number of modules in unknown status and other interesting monitors.
Import the CSV to create 3,000 agents. It will take some time. After that go to the first agent (AGENT_3000) and create a PING module there.
Go to the massive operations tool and copy that module to the other 2,999 agents.
Pandora FMS should then start to process those modules. Measure with the same metrics from the previous case and evaluate how it goes. The objective is to leave an operable system for the number of ICMP modules required without any of them reaching the unknown status.
SNMP Server (Enterprise)
This is specifically about the SNMP Enterprise network server. In case of testing for the Open network server, see the section on the (generic) network server.
Assuming that you have the server already working and configured, we are going to explain some key parameters for its working:
block_size X
It defines the number of SNMP requests that the system will do for each execution. You should consider that the server groups them by target IP, so this block is only indicative. It is recommended for it not to be large (30 to 40 maximum). When an item of the block fails, an internal counter makes the Enterprise server retry, and if after n attempts it does not work, then it will pass it to the Open server.
snmp_threads X
Obviously the more threads it has, the more checks it will be able to execute. If you add all the threads Pandora FMS executes, it shoulg not reach the 30-40 range. you should not use more than 10 threads here, although it depends on the type of hardware and the GNU/Linux version you use..
The fastest way to test is through a SNMP device, applying all the interfaces, all the serial “basic” monitoring modules. This is done through the Explorer SNMP application (Agent → Admin mode → SNMP Explorer). Identify the interfaces and apply all the metrics to each interface. In a 24 port switch, this generates 650 modules.
If you generate other agent with other name, but same IP address, you will have other 650 modules. Another option could be to copy all modules to a series of agents that will have all the same IP address, so the copied modules work “attacking” the same switch.
Other option is to use an SNMP emulator, as for example the Jalasoft SNMP Device Simulator.
The objective of this point is to be able to permanently monitor an SNMP module pool during at least 48 hours, monitoring the infrastructure, to make sure that the modules per second monitoring ratio is constant, and there are not time periods where the server produces modules in unknown status. This situation could be occur due to:
- Lack of resources (memory, CPU). It would be possible to see a tendency of these metrics in continual rise, which is a bad signal.
- Occasional problems: Re-start of the daily server (for log rotation), execution of the DDBB scheduled maintenance execution, or other scripts that are executed in the server or in the DDBB server.
- Network problems, due to not related processes (i.e: backup of a server in the network) that affect the speed and availability of the network at any given time.
Plugins, Network (open) and HTTP Server
Here we apply the same concept as above, but in a more simplified way. You should check:
- Number of threads.
- Timeouts (to calculate the incidence in the worst case scenario).
- Check average time.
Scaling with these data a test group and check that the server capacity is constant over time.
Trap Reception
Here, the case is more simple: it is assumed that the system is not going to receive traps constantly, but rather it is about evaluating the response to a trap flood, from which some of them will generate alerts.
To do this, you will only have to do a simple script that generates traps in a controlled way and at hight speed:
#!/bin/bash
TARGET=192.168.1.1
while [ 1 ]
do
   snmptrap -v 1 -c public $TARGET .1.3.6.1.4.1.2789.2005 192.168.5.2 6 666 1233433 .1.3.6.1.4.1.2789.2005.1 s "$RANDOM"
done
Note: stop it with the CTRL+C key after a few seconds, as it will generate hundreds of traps quickly.
Once the environment is set up YOU need to validate the following things:
- Trap injection to a constant rate (just enter the
sleep 1command to the previous script inside the loop while, to generate 1 trap/sec. Leave the system operating 48 hours and evaluate the impact in the server. - Trap Storm. Evaluate the situation before, during and at the recovery if a trap storm takes place.
- Effects of the system on a huge trap table (more than 50 thounsand). This includes the effect of executing the DB maintenance.
Events
In a similar way as with the SNMP, evaluate Pandora FMS system events in two cases:
1. Normal range of event reception. This has been already tested in the data server, so in each status change, an event will be generated.
2. Event generation Storm. To do this, force event generation through CLI. Using the following command (with a created “TestingGroup”):
/usr/share/pandora_server/util/pandora_manage.pl \
  /etc/pandora/pandora_server.conf --create_event "Event test" system TestingGroup
This command, used un a loop as the one used to generate traps, can be used to generate dozens of events per second. It could be parallelized in one script with several instances to get a higher number of insertions. This will be useful to simulate the performance of the system if an event storm happens. That way we could check the system, before, during and after the event storm.
User Concurrency
For this use another server, independent from Pandora FMS, using the WEB monitoring feature. In a user session where you have to do the following tasks in a specific order, and see how long they take.
- Login in the console
- See events.
- Go to the group view.
- Go to the agent detail view.
- Visualize a report (in HTML). This report should contain a pair of graphs and a pair of modules with report type SUM or AVERAGE. The interval of each item should be of one week or five days.
- Display of a combined graph (24 hours).
- Report generation in PDF (another different report).
This test is done with at least three different users. This task could be parallelize to execute it every minute, so as if there are 5 tasks (each one with their user) you would be simulating the navigation of 5 simultaneous users.Once the environment is set up, you should consider this:
- The average speed of each module is relevant when it comes to identifying “bottle necks” relating to other parallel activities, such as the execution of the maintenance script, etc.
- The impact of CPU and memory will be measured in the server for each concurrent session.
- The impact of each user session simulated referred to the average time of the rest of sessions will be measured. This is, you should estimate how many seconds of delay adds each simultaneous extra session.

