Table of Contents
Visualization
This section explains the Command Center options devoted to agent, module and alert data navigation and display of the assigned Instances.
Command Center management
The Command Center home screen comprises three main areas with some features shared with the node interface. The Main section has shortcuts to frequently used features. Some options may be disabled, for example NetFlow, which is configured in the Metasetup.
Metasetup
It is important to take into account the initialization of the working environment by enabling (or disabling) functions and/or options that match the necessary monitoring requirements. To that end, go to Setup → Metasetup → General setup.
Other sections in Metasetup are:
- Password configuration in Passwords setups.
- If you need to contain long-term data, History database.
- Authentication methods, by default in local mode and additionally with Active Directory, LDAP o SAML: section Authentication.
- In Visual setup, the graphical configuration and certain report preferences.
- E-mail and notification configuration.
- Pandora FMS online update options.
Merging tool
A Command Center that was not merged will display the following message System is not centralised, by clicking on the link shown you will be redirected to the Merging tool.
Server management
Through the specific icon in the header or by going to the menu Centralised management → Server management you may quickly check whetherPFMS servers are running and their corresponding states. It is important for everything to be in order and ready to undertake the rest of the steps.
User management
Once you centralize the nodes using the Merge Tool you will have access to a complete list of users and you may modify, add or delete users one by one using the Central Administration → User Administration menu.
Another powerful tool to speed up work in this area is the bulk modification option (menu Central Administration → Bulk Operations → User Operations), where you may select all users - or some of them - and modify several fields at once. For example, the Home screen, language or time zone, among others.
Agent management
Just like user management, for agent management the Command Center has the option of bulk editing the agents registered in the nodes. Use the menu Centralised management → Bulk operations → Agent operations → Edit agents in bulk selecting the desired node, filtering if necessary and selecting the agents to be modified. Then set the values that will be common in each agent field (e.g. the monitoring interval and the group they will belong to) and save the bulk changes.
In the Agent management section you may, one by one, move agents between nodes as well as manage groups or perform provisioning management.
Event management
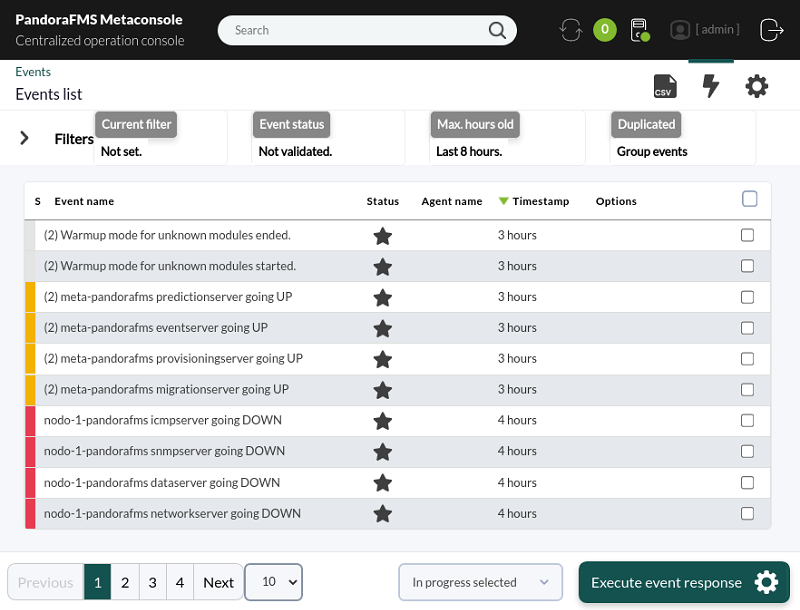
Accessing the Events → Event list menu, you will see the non-validated events of less than 8 hours, both those belonging to the Command Center and to each of its nodes.
In the advanced filter options (menu Filters → Advanced options → Server) you may select one or more nodes, including the Command Center, run the filter query and save it for quick use later on, saving considerable time in event management.
Alert view
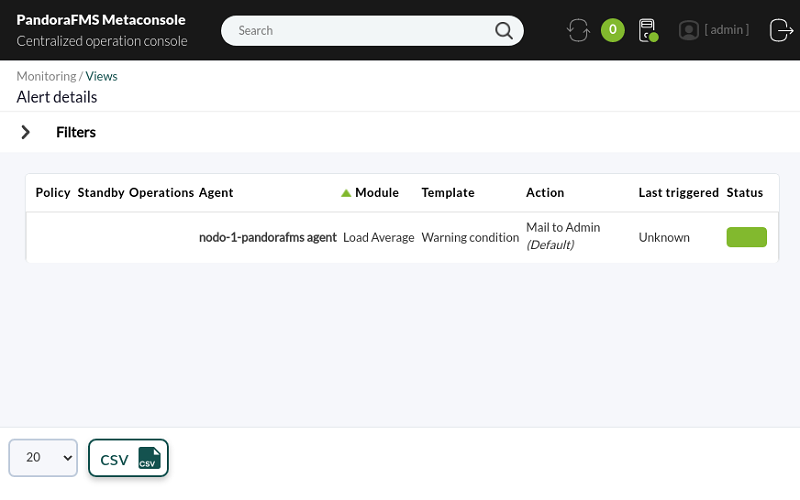
To obtain a complete overview of the list of alerts registered in each node do so through the menu Monitoring → Alert views. The most relevant data, such as the last time an alert was fired, the template used and the agent applied, among other data, are displayed in this view.
Filtering by group or even by keyword will quickly find a given alert and in the Operations column, in the corresponding row of each alert, you will get full details of each alert.
Reports
Reports
The reports themselves in several formats (PDF, CSV, etc.) are saved in the Command Center with the data being obtained according to the selected nodes, this being the big difference with the reports created in each of the nodes.
As with nodes, Command Center reports can be created one by one or in an advanced way through report templates, which are parameterizable components that are applied to a group of agents when requested.
Dashboards
The Dashboards in Command Center work in a very similar way to how they are used in the instances, being the search of the agents transparent and fast by just entering at least two characters of the name, appearing in a drop-down list ordered by name and in brackets the node they belong to.
Once a widget has been added from among the dozens that make up the list, it can be assigned to display name and node or, failing that, any particular description that needs to be displayed.
When saving the creation or editing task, dashboards are saved in the Command Center itself: when they are requested again, connections and queries will be made with the instances to display the latest information.
Visual consoles
With Visual Consoles in the Command Center, you have a full-screen view of a custom-developed overview. You have the advantage of being able to click on its elements and going to the agents and their modules, whether you are logged in as an authorized user or shared a public link. These visual consoles are constantly updated according to the configured time period.
It will be possible to create Visual Consoles to represent services and also link other visual consoles, which is useful to represent countries, cities or geographical areas.

