Table of Contents
Visualization
This section will explain the Command Center options that refer to the navigation/display of the agent data, and the Instance modules and alerts from the Command Center.
Monitoring
Data can be displayed in the following ways:
- Tree view.
- Tactical view.
- Group view.
- Alerts view.
- Monitors view.
- Custom fields view.
- Inventory.
- Wizard.
- Log viewer.
Tree View
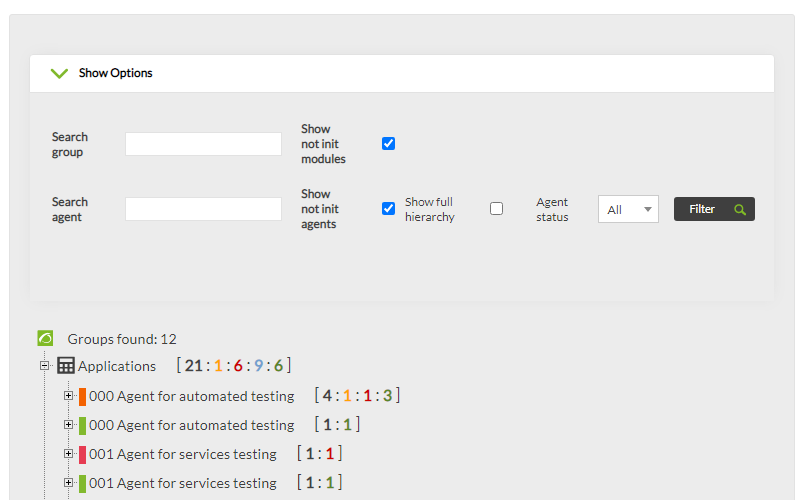
This view allows agent monitors to be displayed in a tree view. You can have access through Monitoring → Tree view.
It is possible to filter by module status (Critical, Normal, Warning and Unknown) and search by agent name or by group. In addition, it is also possible to have the uninitiated agents or modules displayed (Show not init modules and Show not init agents options), as well as the complete hierarchy.
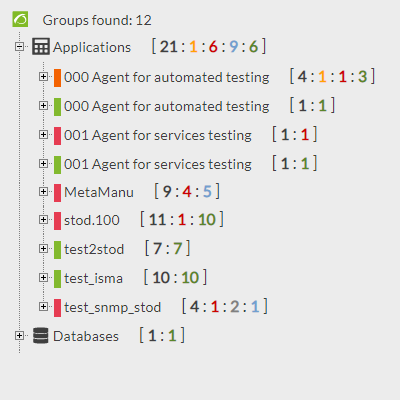
In each level, the counting of the number of items of its branch is shown: total number of elements, Critical (red color), Warning (yellow color), Unknown (gray color), not uninitiated modules (blue) and normal status (green color).
The first level is loaded first. By clicking on the items of each level, the branch with the items it contains will be displayed.
This is a group tree where the agents are displayed, filtered by the group they belong to.
Items shown in the group are restricted by the ACLs permissions and by the the permissions for Tags that the user has
Levels
Groups
This is the first level.
Displaying the branch of one Group, it shows the agents contained in that Group.
The counting next to the group name refers to the number of agents it contains that are in each status.
Only the enabled agents that have at least one module enabled and initiated will be shown.
Agents
If you display the branch of one Agent, the modules that this agent contains will be shown.
The counting next to the name of the Agent refers to the number of Modules it contains that are in each status.
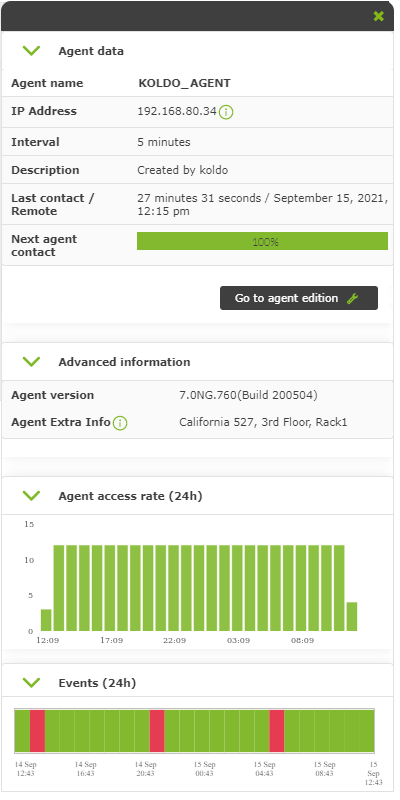
By clicking on the agent name, it will show information about it at the right: Name, IP address, date of last update, operative system and also an event graph and another one showing the accesses of the last 24 hours.
In order for the data related to agent Custom Fields to be displayed in this Command Center information window, activate in nodes the Display up front token explained in this section.
Modules
The module is the last branch of the tree.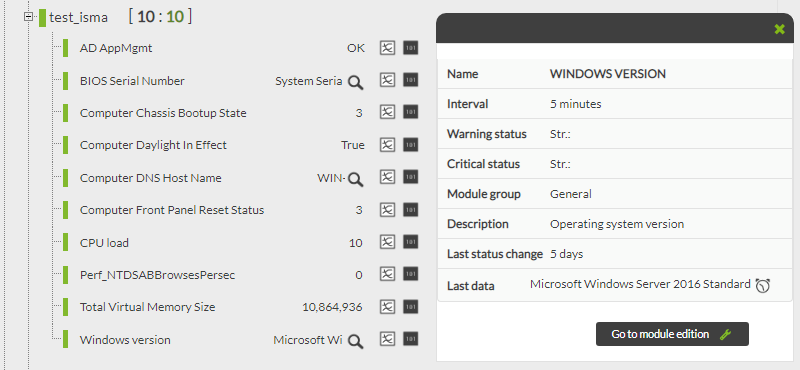
By clicking on the module name, it will show information about it at the right. Next to the name of each module, in this branch several buttons will appear:
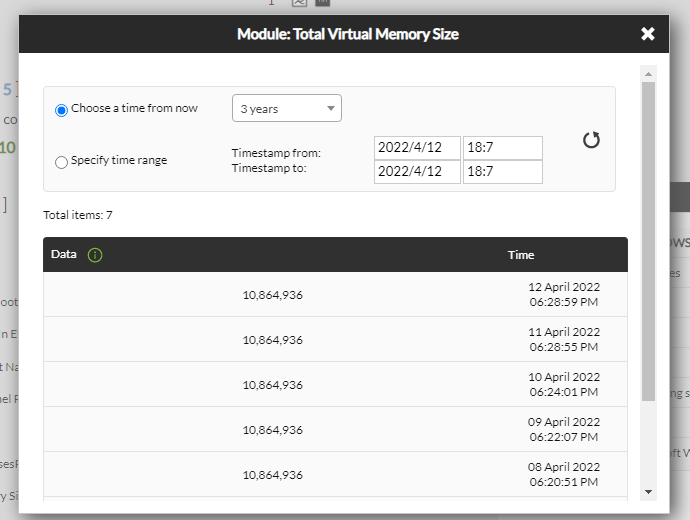
- Module Graph: A pop-up will appear with the module graph.
- If the module contains alerts, it will show an alert icon. By clicking on the icon, it will show information about module alerts at the right side: The templates they belong to and their actions.
- If the module has a magnifying glass icon, it indicates that the text for last data is very long and you will have to click on it to view its entire contents.
- Information In Raw state : You can have access to the module view where the received data are shown in one table.
Tactical View
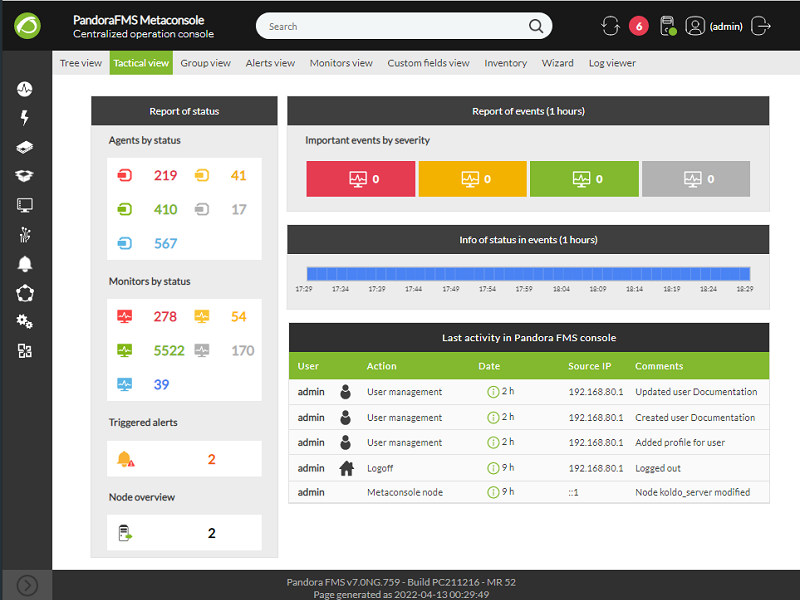
The tactical view of the Command Center is made of:
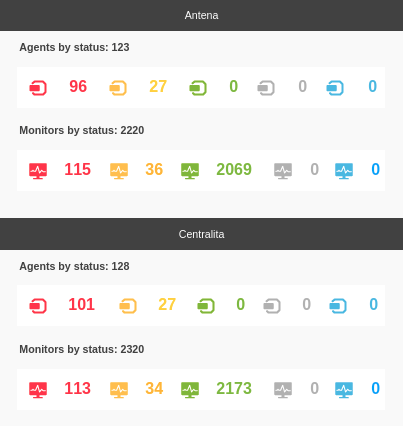
- A table with a summary of the agents and module status.
- A table with the last events.
- A table with the last activity of the instances of Pandora FMS.
Information about Agents and Modules
The status report is displayed in a summary table:
- Agents by status.
- Monitors by status.
- Triggered alerts.
- Node summary.
Except for the node summary, you can click on each numerical value to get more information on each topic.
Last Events
On the one hand, a table with the events of the last hour summed up in their different status is shown (Critical, Warning, Normal y Unknown). On the other hand, the same events of the last hour are shown according to their order of arrival to the Command Center (info of status in events).
This view only has briefing purposes, the events cannot be validated and their information cannot be displayed in detail.
Group View
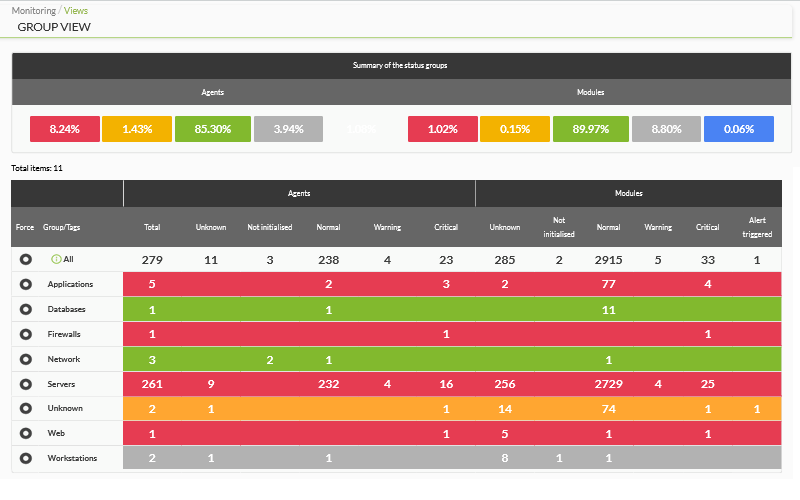
The group view is a table with the groups of each Instance and the following information about each one:
- Group name. In the first place is the All group, if secondary groups are being used it will have an informative icon.
- Agent total number.
- Group status (the worst status from their agents).
- Number of agents in Unknown status.
- Number of agents in No init status.
- Number of agents in Critical status.
- Number of modules in Unknown status.
- Number of modules in No init status.
- Number of modules in Normal status.
- Number of modules in Warning status.
- Number of modules in Critical status.
- Number of alerts fired.
Alert view
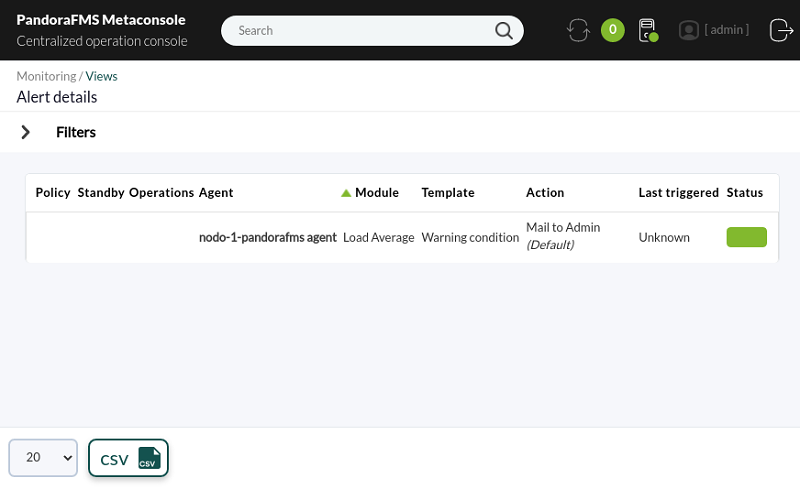
Alert view is a summary table with the alert information on the instances where the agent they belong to is displayed, as well as their module, used template, used action and the last time it was triggered.
Monitor View
The monitor view is a table with information about the Instance monitors.
The modules that are shown are restricted by the ACL permissions and by the permissions by Tags that the user may have.
It could be filtered by:
- Group.
- Module status.
- Module group.
- Module name.
- Tags.
- Free search.
- Type of server.
- Type of data.
All monitors or just active monitors or deactivated monitors can be shown.
In this view, not all instance modules are shown, because it would not be feasible if they were big environments. A configurable number of modules is retrieved from each instance, 100 by default. This parameter is Command Center Items from the Visual Styles Administration Section, which can be modified, taking into account that if the number is very high, it may compromise the performance of the Command Center.
Custom Fields View
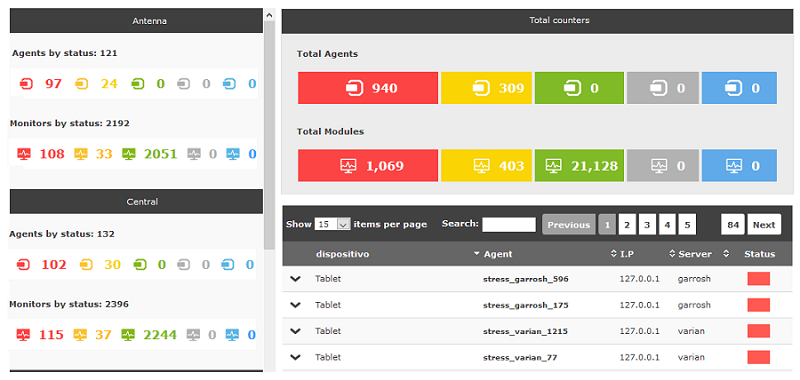
This view shows in a simple way the status of the agents according to their custom fields.
The Custom Fields view consists of:
- Search form.
- Custom filter management.
- Agent and module counting for each value of the selected custom field.
- General agent and module counting.
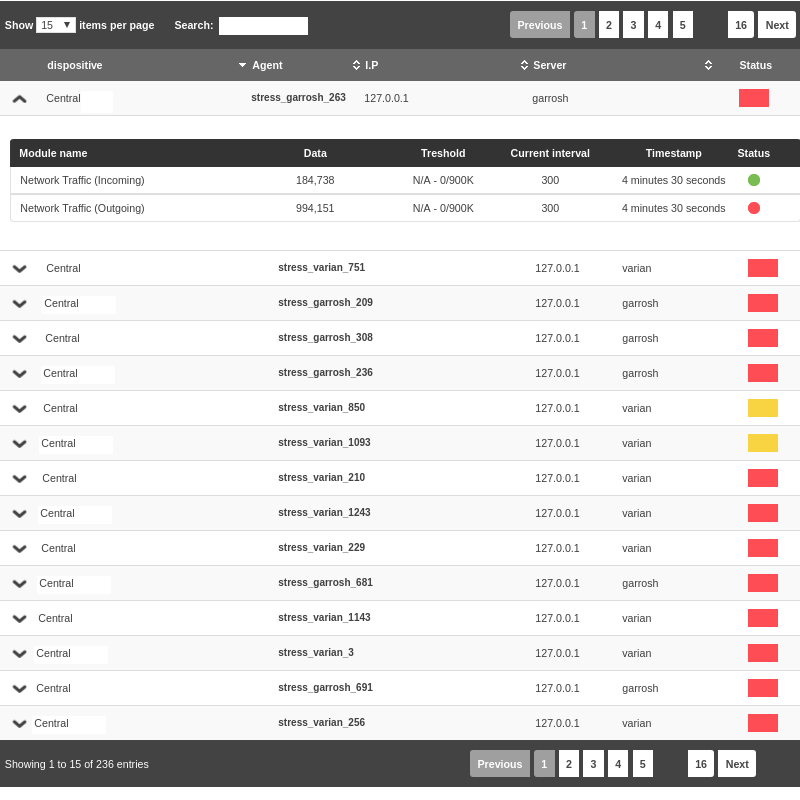
- List of agents filtered by the research.
Search Form:
- Group: This enables filtering by a specific group.
- Custom fields: It is mandatory to select an agent custom field. In order to select that field, it must have been previously created with the Display up front option checked in node in the following section.
- Custom fields data: Value/s of the custom field.
- Status agents: State(s) of the agent.
- Module search: Module name.
- Status module: State(s) of module.
Custom Filter Management:
- Create, update and delete filters: To improve access to the custom field view you can create, save and remove search filters. Choose the search parameters and click on the floppy disk icon to do it. A modal window will appear:
- New Filter: Used for creating new filters. A name that has not been used before must be entered.
- Existent Filter: It is used for updating and deleting filters.
This filter management section will only be visible to administrator users..
- Load filters: Click on the arrow icon and select the desired filter.
- Add filters to a specific user: Assigning filters to users will be done in the user create/edit view. When users access this view, they will do so with the selected filter loaded.
Agent and module counting for each value of the selected custom field:
In this view section, agent and module counting for each data of the selected custom field will be displayed in a simple way.
General agent and module counting:
List of agents:
It shows a list with the following agent information:
- Drop-down list where the following agent data will be shown with the selected custom field:
- Module name.
- Last data.
- Threshold.
- Interval time.
- Last contact time.
- Module status.
- Custom field value.
- Agent name.
- IP address.
- Server.
- Status.
This table is paged and can searches can be performed and sorted out by fields:
- Custom Field.
- Agent.
- IP address.
- Server.
Log viewer
NG 747 version or later.
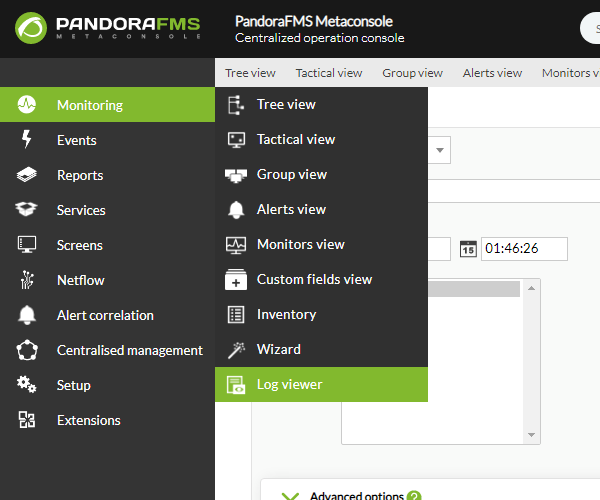
You may find the log viewer in the monitoring section of the top menu. The view will be similar to that of the nodes, but including an extra multiple selector to select the logs collected by specific nodes. In the following link you may see the full description of parameters regarding this view in the node and which are saved in the Command Center.
To have access to this view, first enable it in the general configuration of the Command Center and configure the connection to Elasticsearch server, as it is described in the Log Viewer configuration section.
Then you may access the menu Monitoring → Log viewer, and you may select the filtering (Start date) of the last hour, the last 6 hours, and so on or choose within a date range (Select dates by range):
Events
Pandora FMS uses an event system to show that takes place in the monitored systems. In an event viewer, it is shown when a monitor is down, an alert has been triggered, or when the Pandora FMS system itself has some problem.
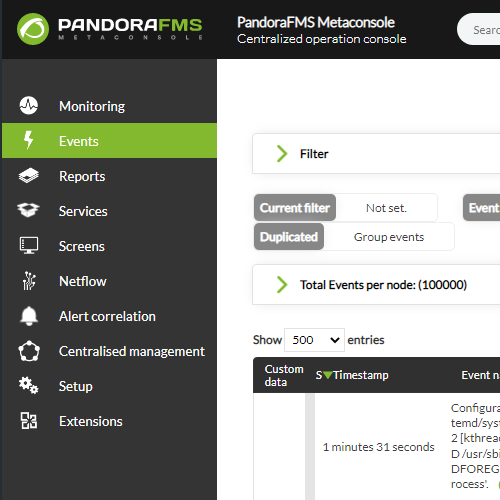
The Command Center has its own event viewer where the events from the associated instances are centralized. It is possible to centralize the events of all instances or just part of them. When the events of one instance are replicated in the Command Center, its management becomes centralized in the Command Center, so its display in the instance will be restricted to only reading.
Instance event replication to the Command Center
In order for the instances to replicate their events to the Command Center, it would be necessary to configure them one by one. To get more information about its configuration go to the section Command Center Setup and configuration in this manual.
Event Management
The event management display view is divided in the view and its configuration.
See Events
Event view
The normal event view, non-validated events of less than 8 hours, is accessed by clicking on the Events icon from the Command Center main page.
Event filter editing and creation works the same way as that of nodes. The event view filter default values are:
The only difference with event filters on nodes is the Server field which allows you to choose the Command Center and/or one or more nodes.
When upgrading to version 767 the previously created filters may be unconfigured in the Server section, if so reconfigure your server preferences for each filter and save again to fix.
Event History
In order to have an event history, activate and configure this option in ►Setup → Metasetup → Performance and then the oldest events from some time ago (configurable) , that have not been validated, will become part of a secondary view automatically: The event history view. This view is similar to the normal event view, and you can have access to it from a tab in the event view.
Event Filter
The event views have a range of filtering options available to meet the user needs.
Filtering options can be created in two different ways. One of them is doing the filtering in the event view itself, and saving the selected filter afterwards by clicking Save filter.
The other way consists of going to ►Manage Events → Filter List → Create new filter and creating the desired possible filters manually. Later, the created filters must be loaded in the event filter options.
Advanced event filter options
Some important fields of the advanced event filter:
- Agent search: It allows you to search only for specific agents, you must enter at least two characters to display the corresponding list.
- Server: It allows you to choose the node(s) and/or Command Center containing the events.
- User ack.: It allows you to select a user and their validations performed.
- Events with the following tags y Events without the following tags: Respectively, they allow you to select the events that have or do not have certain tags.
- Custom data filter: You can filter by custom fields using the fields Custom data filter, either by filtering the field name (Filter custom data by field name) or by custom field content (Filter custom data by field value). These fields will be displayed as columns in the event view.
Event Details
In the event list (normal or from history) it is possible to see the details of one event clicking on the event name or in the 'Show more' icon from the action field.
The fields of one event are shown in a a new window with several tabs.
General
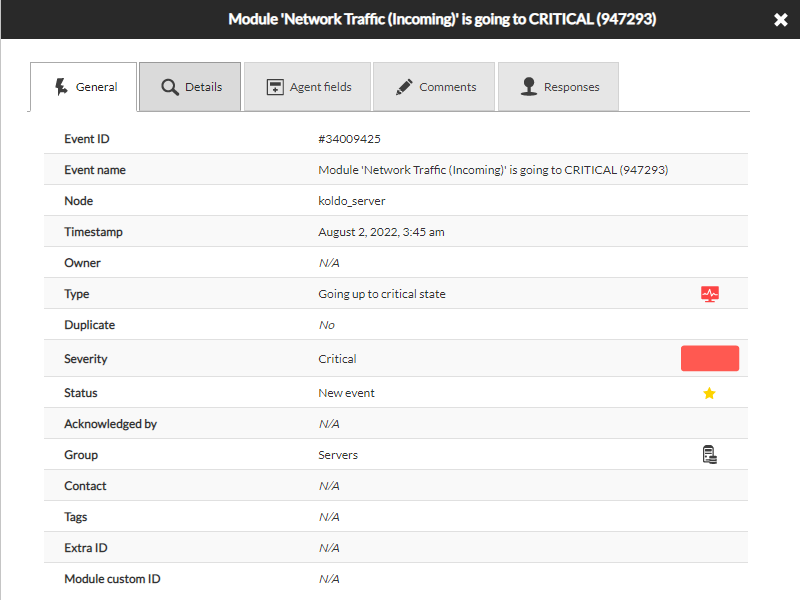
The first tab shows the following fields:
- Event ID: It is an unique identifier for each event.
- Event Name: It is the event name. It includes a description.
- Date and Hour : Date and Time when the event is created in the event console.
- Owner: Name of the user owner of the event
- Type:Type of event. There can be the following types: Ended Alert, Fired Alert, Retrieved Alert, Configuration change, Unknown, Network system recognized by the recon, Error, Monitor in Critical status, Monitor in Warning status, Monitor in Unknown status, Not normal, System and Manual validation of one alert.
- Repeated: It defines whether the event is repeated or not.
- Severity: It shows the severity of the event. There are several levels: Maintenance, Informative, Normal, Minor, Warning, Major and Critical
- Status: It shows the status of the event. There are different status: New, Validated and In process
- Validated by: If the event has been validated, it shows the user who validated it, and the date and when when it happened.
- Group: If the event comes from an agent module, it shows the group the agent belongs to.
- Tags: If the event comes from an agent module, it shows the module tags.
- Extra ID: Extra ID that is assigned to the event to be able to look for it as free text.
Details
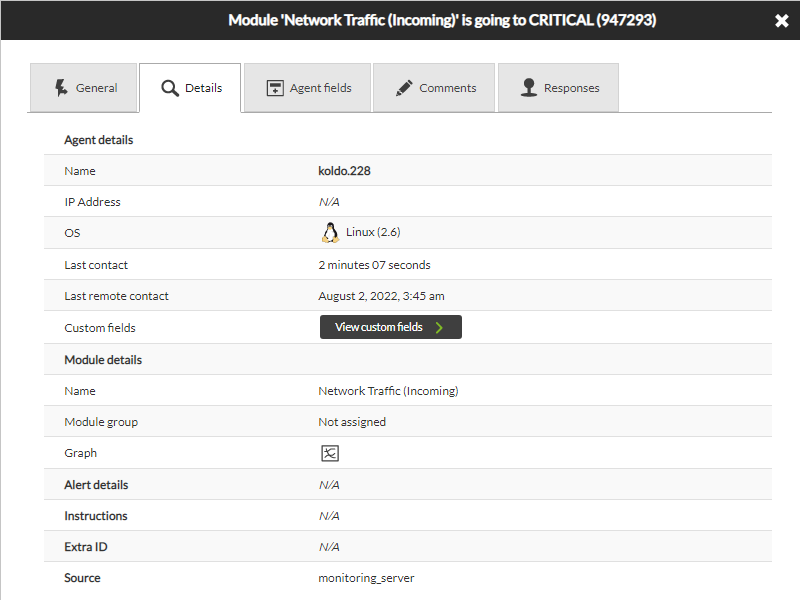
The second tab shows details of the agent and the module that created the event. It is also possible to have access to the module graph.
The last data is the source of the event, which could be a Pandora FMS server or any source when the API is used to create the event.
Agent Fields
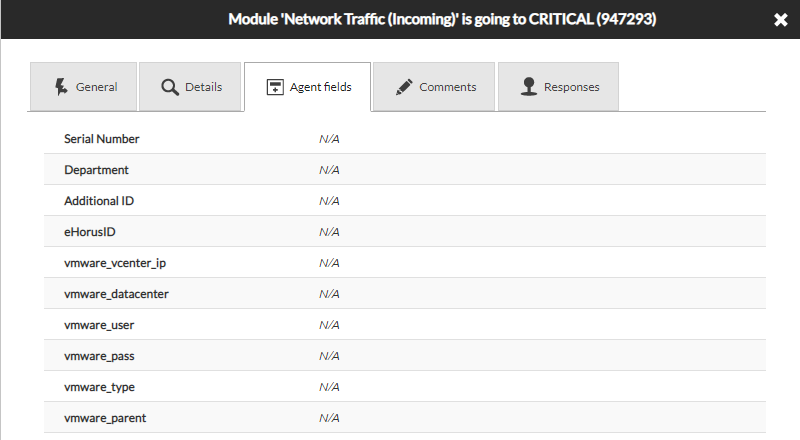
The third flap shows the Agent custom fields.
Comments
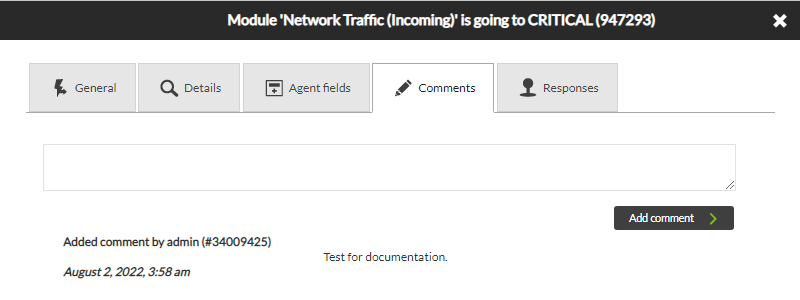
The fourth tab shows the comments that have been added to the event and the modifications resulting from the change of owner or the event validation.
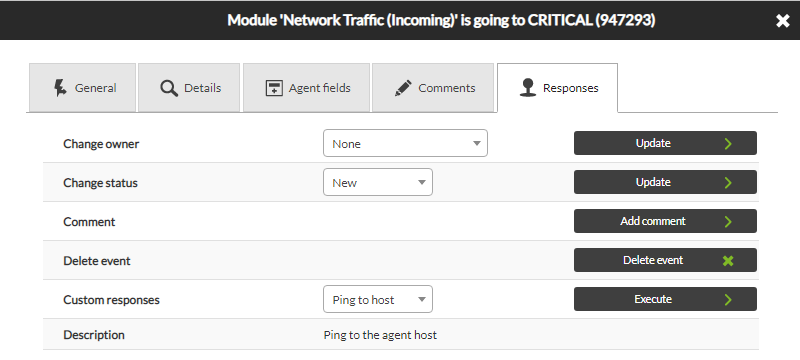
Event Responses
The fifth tab shows actions or responses that could be performed on the event. The actions to be carried out are the following:
- Changing the owner
- Changing the status
- Adding a comment
- Deleting the event
- Executing a custom response: It would be possible to execute all the actions that the user has configured.
Configure Events
Manage Event Filters
Filters on events allow to parametrize the events that you want to see in the event console. With Pandora FMS, it is possible to create predefined filters so that one or several users can use them.
Filters can be edited by clicking on the filter name.
In order to create a new filter, click on the button “create filters”. There, it will show a window where the filter values are configured.
The fields through which filtering is performed are these:
- Group: Combo where you can select the Pandora FMS group.
- Event Type: Combo where you can select the event type.
- Severity: Combo where you can select by event severity.
- Event Status: Combo where you can select by event status.
- Free search: Field that allows text free searching.
- Agent Search: Combo where you can select the source agent of the event.
- Max hour old: Combo where the hours are shown.
- User Ack: Combo where you can select among the users that have validated an event.
- Repeated: Combo where you can choose between being shown the repeated events or all events
Besides the search fields in the Event Control filter menu, there is the Block size for pagination option, where you can select the number of event that will be found in each page when paging.
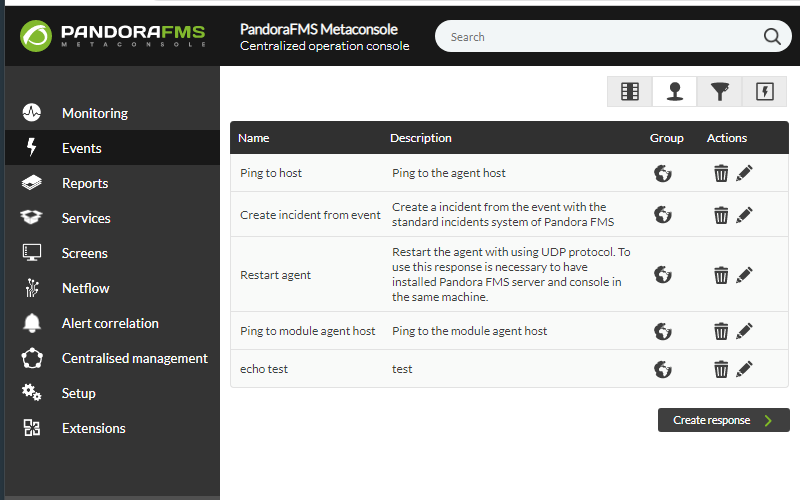
Manage Responses
In events, responses or actions to be taken in some specific event can be configured. For example, sending a ping to the agent IP which generated the event, connecting through SSH with this agent, etc.
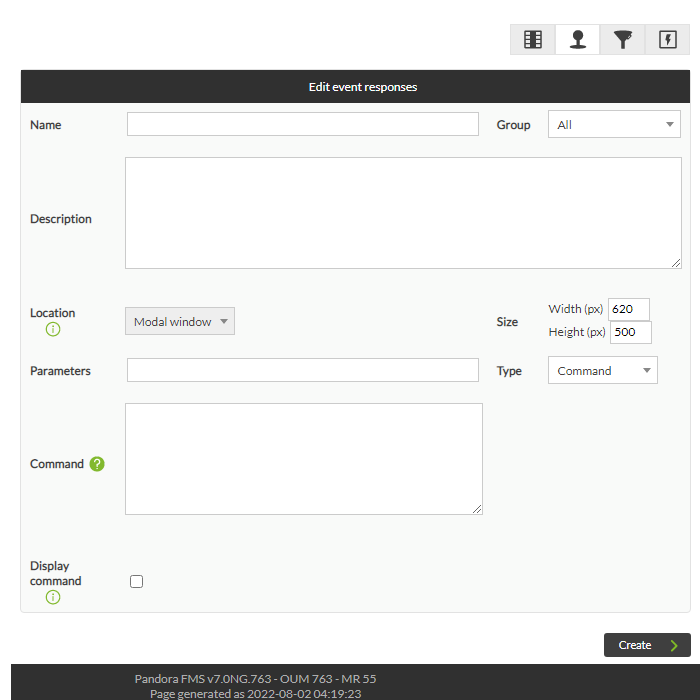
The response configuration allows to configure both a command and a URL.
To this effect, define a list of parameters separated by commas that will be filled in by the user when the response is executed. You can also use both the event's internal macros and those within this list:
_agent_address_: Agent address._agent_id_: Agent ID._alert_id_: Event related alert ID._event_date_: Date on which the event occurred._event_extra_id_: Extra ID._event_id_: Event ID._event_instruction_: Event instructions._event_severity_id_: Event severity ID._event_severity_text_: Event severity (translated by Pandora FMS console)._event_source_: Event source._event_status_: Event status (new, validated or event in process)._event_tags_: Event tags separated by commas._event_text_: Full text of the event._event_type_: Event type (System, going into Unknown Status…)._event_utimestamp_: Date on which the event took place in utimestamp format._group_id_: Group ID._group_name_: Group name in database._module_address_: Event associated module address._module_id_: Event associated module ID._module_name_: Event associated module name._owner_user_: Event owner user._user_id_: User ID._current_user_: Id of the user who triggers the response.- Custom event fields are also available in event response macros. They have
_customdata_*_form, where the asterisk (*) must be replaced by the custom field key you wish to use._customdata_X_: Pulls a particular field from custom data, replacing the X with the field's name._customdata_text_: Pulls all information from custom data in text mode._customdata_json_: Pulls all information from custom data in JSON format.
Customize Fields in the Event View
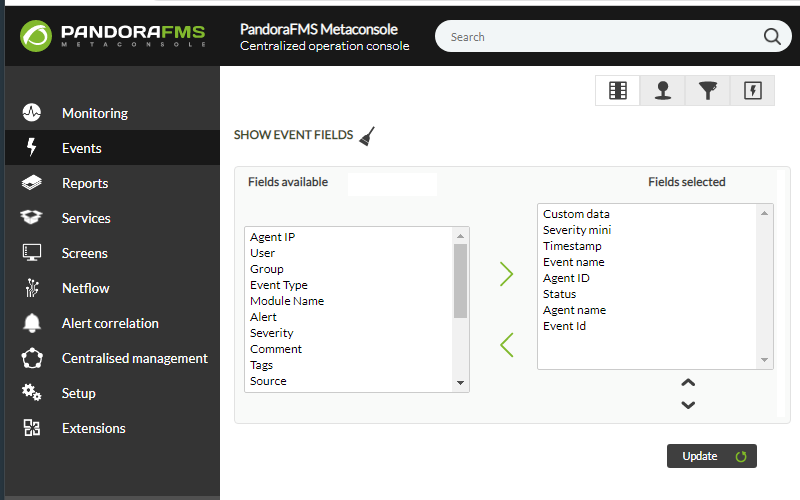
With Pandora FMS, it is possible to add or delete columns in the Event View. Each column is a field for event information, so it is possible to customize that view.
- From this screen, you may add fields to the Event View by moving them from the Fields available box, to the left box, Fields selected, using the horizontal arrow.
- To remove fields from the Event View, move them from the right box to the left box using the horizontal arrow.
- You may also change the order of the fields in the Field selected by selecting them one by one and clicking on the vertical arrows below the list.
- To restore the fields to how they were before the modification, click on the icon
 .
.
Reports
In the Command Center, it is possible to do all kinds of reports on Instance data. The configuration of one report is stored in the Command Center, but when it is displayed, it retrieves data by connecting to the instances.
For the report editor, the source of agents and monitors is visible. However, the user will not know from which Instance they come from.
Reports can be created in two different ways:
- Manually
- With report templates
To find out more visit the Reports section from this documentation.
Command Center service monitoring
As seen in-service monitoring on nodes, a service is an IT resource group sorted out by its features.
With service monitoring in the Command Center, the services present in the nodes can be grouped and all the infrastructure status can be checked at a glance.
They can be added in the Command Center in the following way: - Select the “Reports” → “Services” option
To find out more about creating services and configuring them, visit the Service section in the following link.
Screens
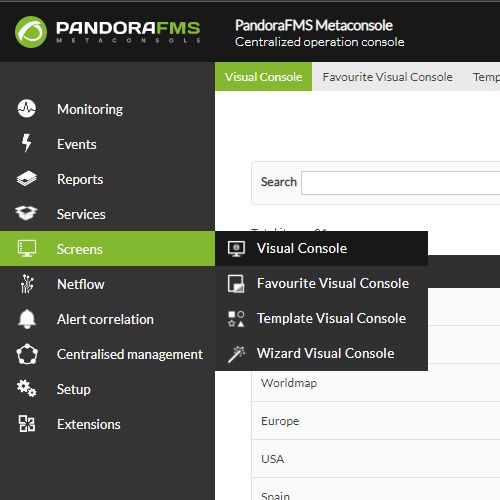
To enable these menus, check the Command Center`s general setup.
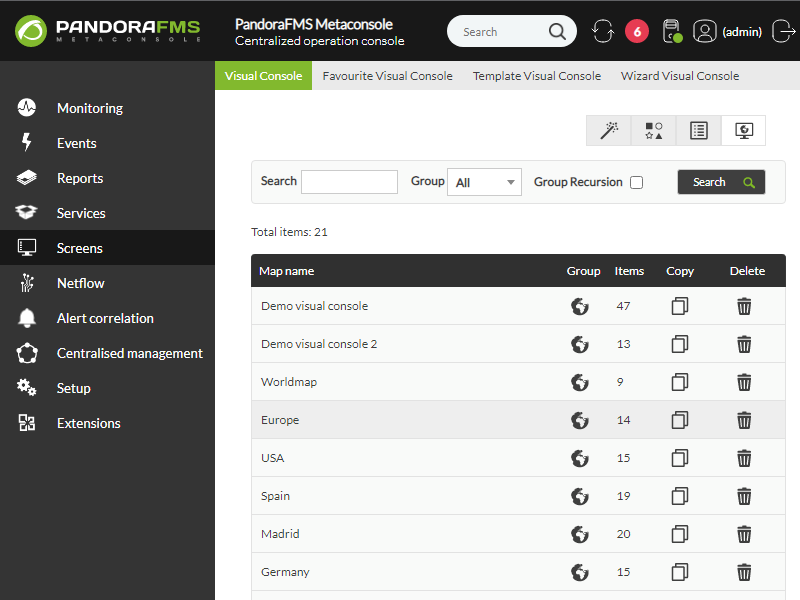
Visual Console
A visual console can be configured in the Command Center, which is a panel consisting of a background and elements placed on it.
Data view and configuration are exactly the same as those of the visual maps in the usual console, but data is retrieved from the Instances in a transparent way for the user.
All this information is in the section of node Visual Maps.
NetFlow
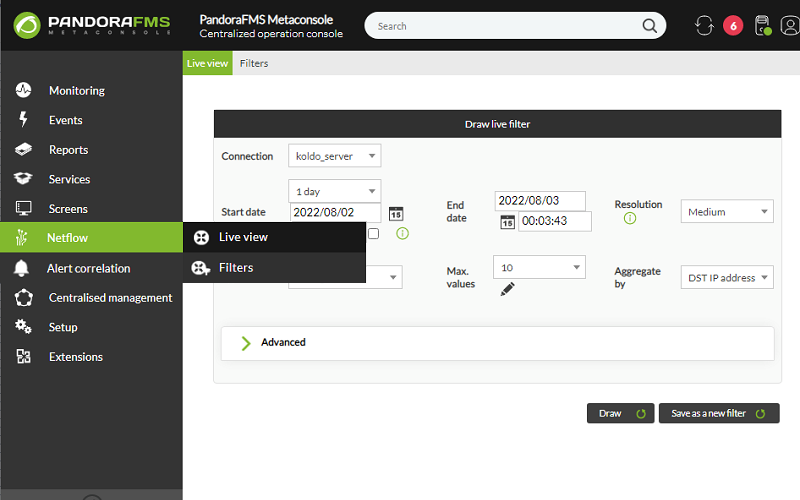
To be able to have this option available in the Command Center, the section view must be activated within the Metasetup general option in the Command Center. At the same time, to be able to carry out a node NetFlow from the Command Center, the node must have NetFlow activated in its setup.
To learn more about how to carry out the live view, the possible NetFlow filters, as well as how to install necessary dependencies, visit the NetFlow section through this link.
Node information flow can only be obtained one at a time. Information from more than one node cannot be obtained simultaneously.


