Wildfly
Plugin to monitor Wildfly (Jboss) and visualize the data in PandoraFMS.
- Introduction
- Compatibility matrix
- Pre requisites
- Parameters
- Manual execution
- Configuration in PandoraFMS
- Agent and modules generated by the plugin
Introduction
The purpose of this plugin is to be able to monitor Jboss/Wildfly, based on metrics related to its consumption, applications, threadpools and datasources.
The plugin connects with the server and performs all the data extraction, which then dumps in Pandora.
Compatibility matrix
| Systems where it works | Rocky linux, Fedora 34 |
| Systems where it works | Any linux system |
Pre requisites
- Connectivity to the environment from which the data is to be received is required.
Parameters
Connectivity parameters
| -i, --host |
IP address |
| -u, --user |
User |
| -p, --password | Password |
Pandora configuration parameters
| --agent_name |
Name of the global agent and prefix for all other agents created. |
| --module_prefix | Prefijo para todos los módulos creados por el plugin |
| --interval | Agent monitoring interval |
| --temporal | Temporal directory PandoraFMS |
| --data_dir |
PandoraFMS Data Directory |
| --group |
PandoraFMS Target Group |
| --transfer_mode |
Data transfer mode, local or tentacle |
| --tentacle_client |
Tentacle client path, by default "tentacle_client". |
| --tentacle_opts |
Additional tentacle options |
| --tentacle_port |
Tentacle Port |
| --tentacle_address |
tentacle IP |
Parameters for enabling/disabling checks
| --scan_deployments | Activate with 1 to enable application scanning, by default enabled. |
| --scan_datasources | Activate with 1 to enable datasources scanning, by default enabled. |
| --scan_threadpools | Activate with 1 to enable threadpools scanning, by default enabled. |
Parámetros extra
| --log |
Command to view the environment log |
Manual execution
The plugin execution format is as follows:
./pandora_jboss  --host < host > --user < user > --password <password> --agent_name < agent name > --module_prefix < prefix >
--scan_deployments < 1 or 0 > --scan_threadpools < 1 or 0 > --scan_datasources < 1 or 0 >
[ --transfer_mode < local o tentacle > ] [ --tentacle_port < tentacle_port > ] [ --tentacle_address < tentacle_address > ] [ --tentacle_client < tentacle client path ] [ --tentacle_opts < tentacle extra options ]
[ -g < group > ] [ --data_dir < data dir > ] [ --temporal < temporary directory path > ] [ --interval < interval agent monitorings in seconds > ] [ --log < 1 or 0 > ]
Configuration in PandoraFMS
To configure the plugin in PandoraFMS, the following steps must be followed:
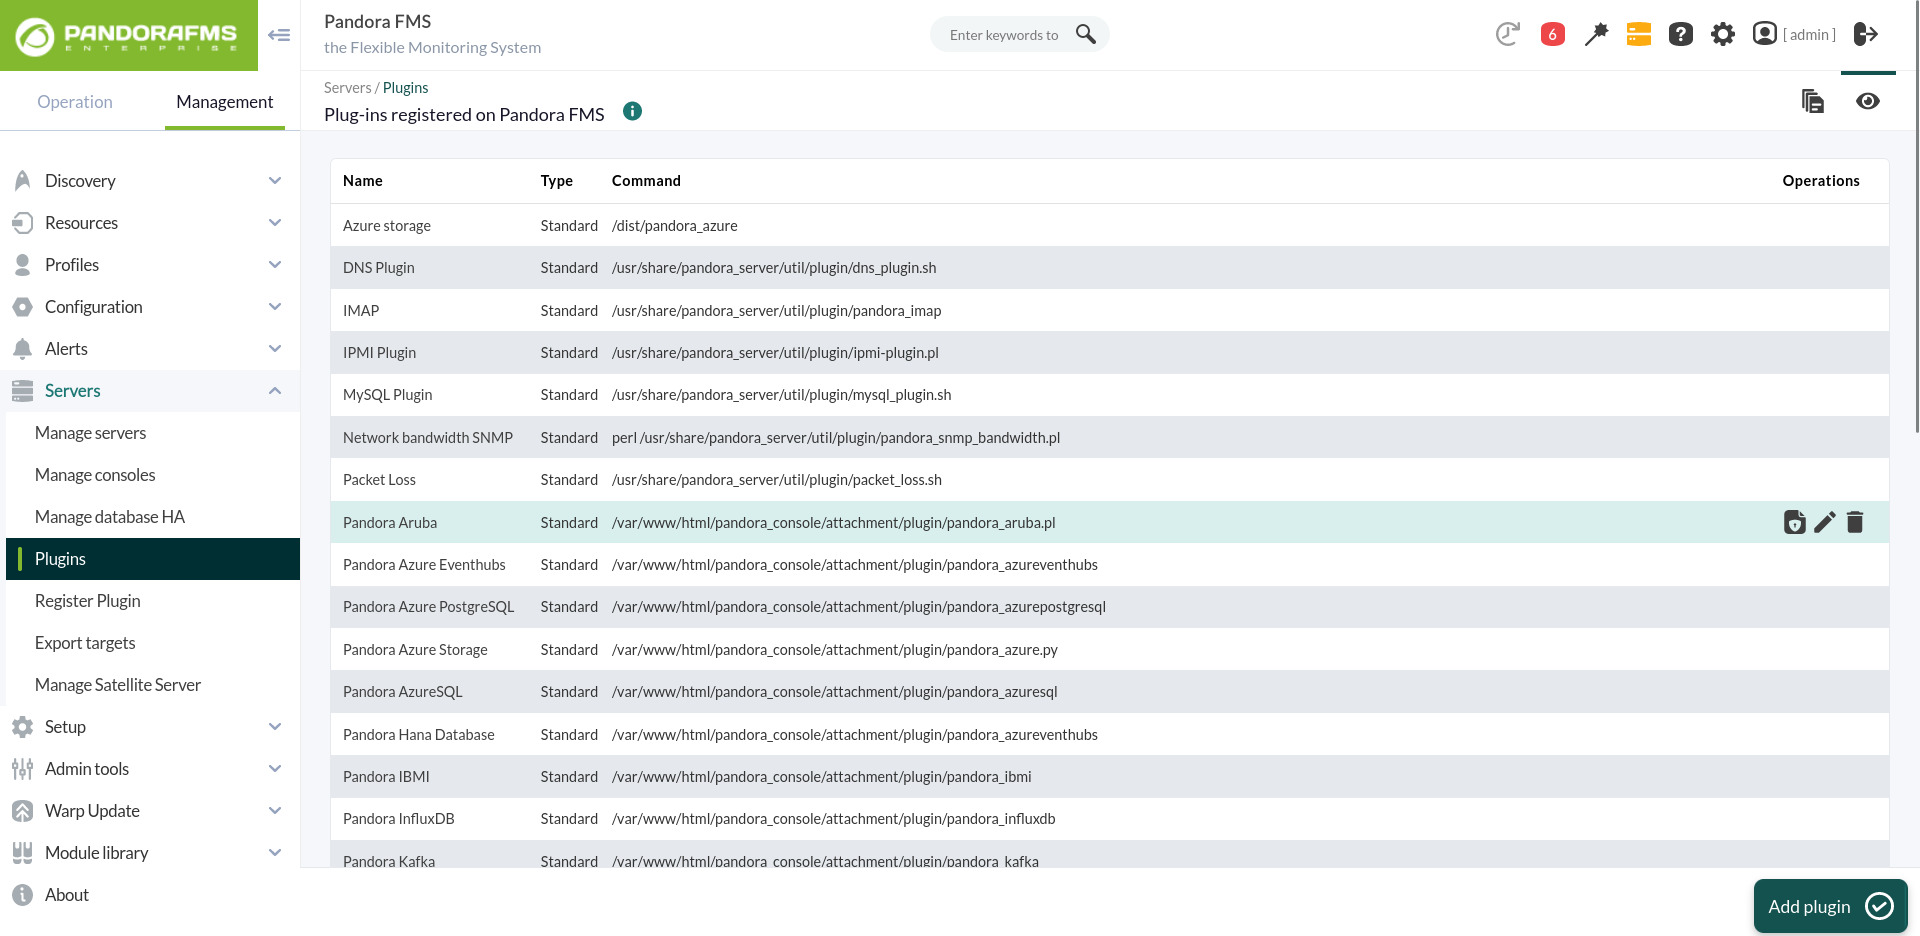
1. Upload the plugin to PandoraFMS, for example in the following path:
/etc/pandora/plugin2.Go to the plugins section and create a new one:
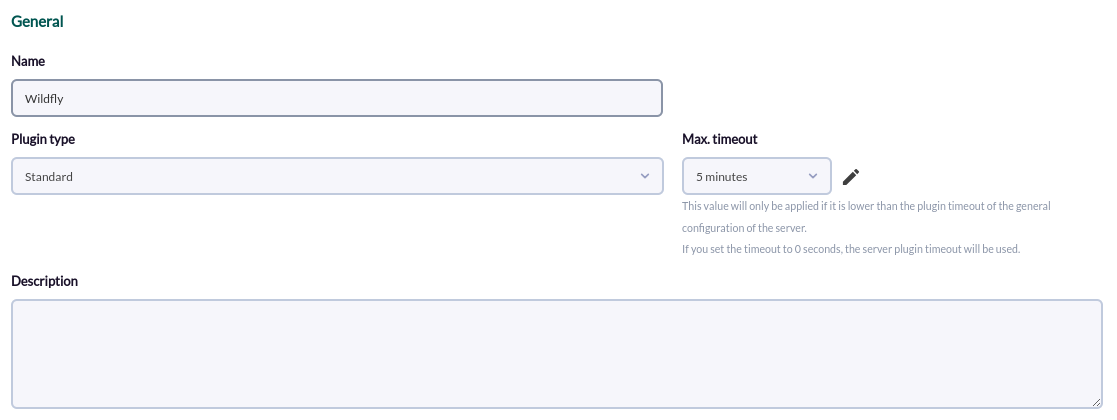
3. Name, description and timeout are added:
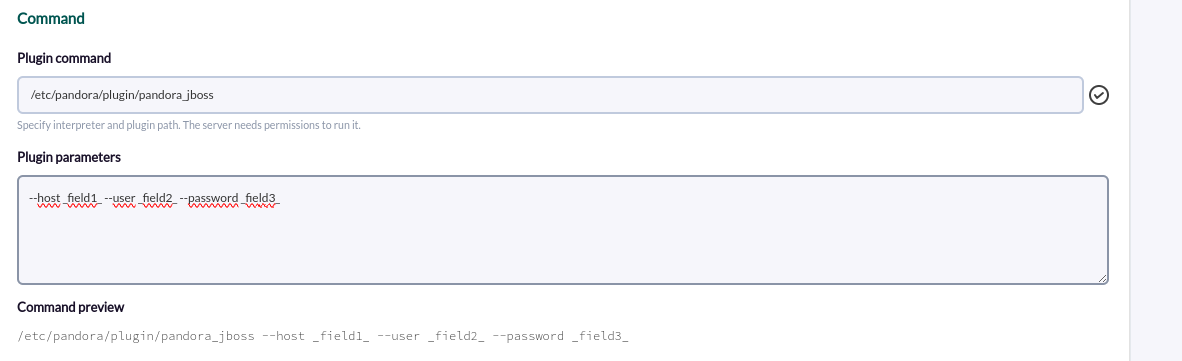
4. The path of the plugin is added to the command and the necessary parameters for its execution.
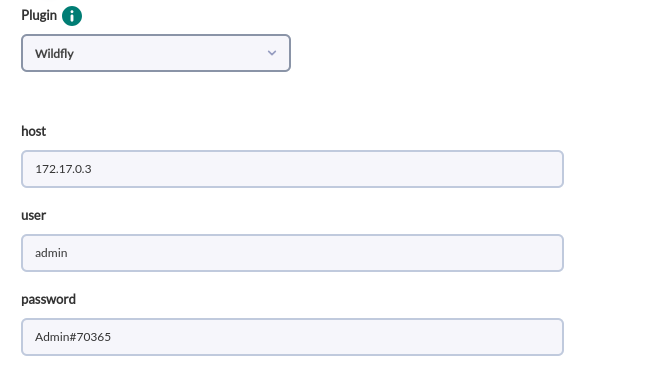
For each parameter a macro must be configured, being the syntax of this macro the following : _fieldx_, where x is the positional number of the parameter, for example in the following image we see the parameters that are mandatory, those of connection, since all the others can be used with the default values.
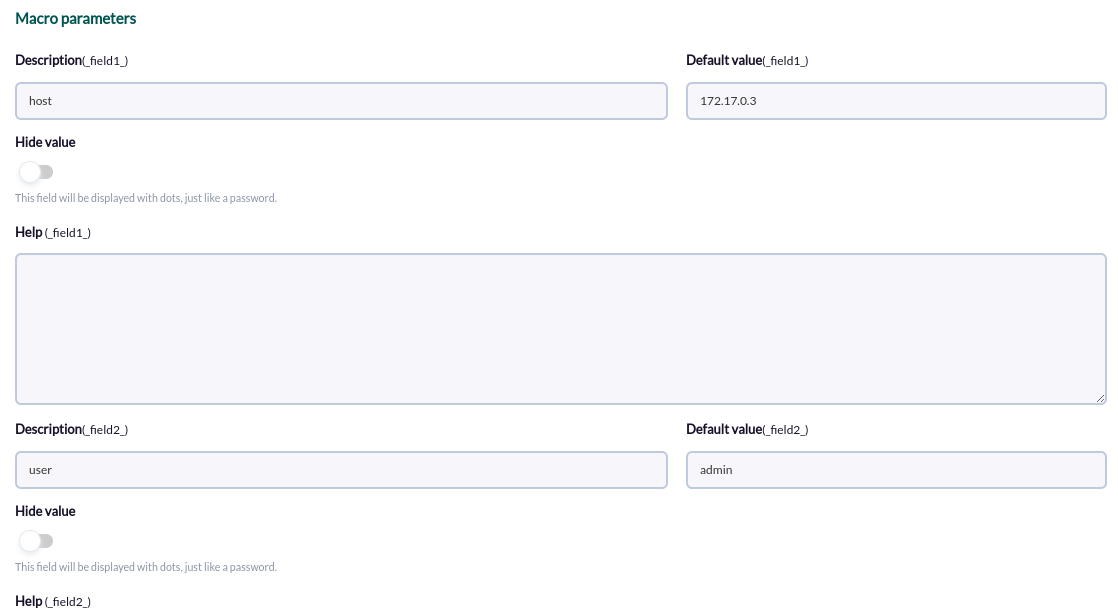
5. The above macros are configured, adding the value of the parameter in each one:
6. Once configured, you should create a module in an agent that executes the plugin. In the modules menu of an agent we create a new plugin type module:
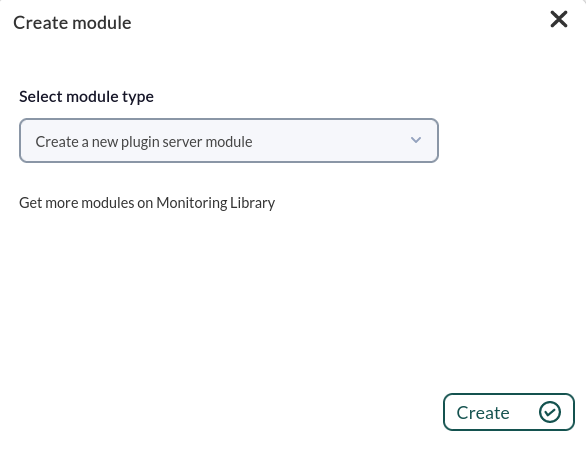
7. In the module configuration menu, we name it, select the plugin configured before and click on "create".
8.The agents will be created in the next execution of the plugin :

Agent and modules generated by the plugin
- The plugin will create a global agent with the following modules:
| <Module prefix>.Datasources |
| <Module prefix>.Datasources count |
| <Module prefix>.Deployments |
| <Module prefix>.Deployments count |
| <Module prefix>.Threadpools |
| <Module prefix>.Threadpools count |
| <Module prefix>.committed.heap-memory-usage |
| <Module prefix>.committed.non-heap-memory-usage |
| <Module prefix>.committed.init.heap-memory-usage |
| <Module prefix>.committed.init.non-heap-memory-usage |
| <Module prefix>.max.heap-memory-usage |
| <Module prefix>.max.non-heap-memory-usage |
| <Module prefix>.used.heap-memory-usage |
| <Module prefix>.used.non-heap-memory-usage |
| <Module prefix>.committed.server.log |
In turn, if monitoring of these is enabled, it will create an agent for each :
- Deployments
| <Module prefix>.context-root |
| <Module prefix>.active-sessions |
| <Module prefix>.expired-sessions |
| <Module prefix>.highest-session-count |
| <Module prefix>.max-active-sessions |
| <Module prefix>.rejected-sessions |
| <Module prefix>.server |
| <Module prefix>.servlet |
| <Module prefix>.session-avg-alive-time |
| <Module prefix>.session-max-alive-time |
| <Module prefix>.sessions-created |
| <Module prefix>.virtual-host |
| <Module prefix>.websocket |
- Threads
| <Module prefix>.<name thread>.active-count |
| <Module prefix>.<name thread>.completed-task-count |
| <Module prefix>.<name thread>.current-thread-count |
| <Module prefix>.<name thread>.keepalive-time |
| <Module prefix>.<name thread>.largest-thread-count |
| <Module prefix>.<name thread>.max-threads |
| <Module prefix>.<name thread>.queue-size |
| <Module prefix>.<name thread>.rejected-count |
| <Module prefix>.<name thread>.task-count |
- Datasources
It will create a boolean module, for each service, that will show whether it is True or False.