VMware
Plugin to monitor VMWare, being able to get data from datacenters, datastores, exsi hosts, virtual machines and switches.
- Introduction
- Compatibility matrix
- Prerrequisites
- Parameters and configuration
- Events monitoring
- Manual execution
- Discovery
- Agents generated by the plugin
Introduction
This document aims to describe the monitoring of datacenters, datastores, exsi hosts and virtual machines with Pandora FMS using the pandora Vmware plugin through discovery.
VMware architecture monitoring
With this system, it is possible to monitor architectures such as the following.
Pandora FMS can monitor VCenter, ESXi servers and the components that virtualize Datastores and Virtual Machines. Pandora FMS is based on the API provided by the pyvm library and one of the official Vmware SDKs for data collection.
The monitoring of a VMware environment can be divided into several important aspects to have a complete view of the performance and health of the environment.
Main aspects of monitoring a VMware environment
Monitoring of virtual machines (VMs)
Virtual machines are the foundation of the VMware virtualization environment. Monitoring VMs is important to gain insight into VM resource usage, availability and performance. Some of the important metrics to monitor are CPU, memory, storage and network usage.
ESXi Monitoring
ESXi is the VMware hypervisor that runs on the physical server and provides the virtualization capability. ESXi monitoring is important to gain insight into resource utilization, host health and performance capability. Some of the important metrics to monitor are CPU, memory, storage, network, and host load utilization.
Datastores Monitoring
Datastores are the storage spaces on the ESXi hypervisor that store VM images and configuration files. Monitoring datastores is important to gain insight into storage usage, storage health, and performance capacity. Some of the important metrics to monitor are space usage, read and write transfer rate, and CPU and memory usage on storage.
Datacenter Monitoring
Datacenters are logical groups of virtualization resources that include ESXi hosts, clusters, networks and storage. Datacenter monitoring is important to gain insight into resource utilization, environment health and performance capacity. Some of the important metrics to monitor are resource availability, CPU, memory, storage and network utilization in the datacenter.
Advanced Statistics
By installing VMware Tools on a virtual machine, you enable the collection of advanced VM statistics. VMware Tools are a set of drivers and services that are installed on a virtual machine to improve its performance and manageability in a VMware virtualization environment.
Advanced VM statistics are detailed metrics that can be collected to monitor and optimize virtual machine performance. Some of the advanced statistics that can be collected include:
Hardware information.
VM hardware information includes details about the virtual machine's processor, memory, storage, and network. These details can be useful for identifying resource bottlenecks and optimizing VM configuration.
Performance information: Performance statistics include detailed metrics about the VM's CPU, memory, disk and network usage. These metrics can be useful for identifying performance bottlenecks and optimizing the VM configuration.
Event information
Event statistics include detailed information about events occurring in the VM, such as starts and stops, reboots, hardware and software errors, and more. This information can be useful for troubleshooting VM problems and improving VM stability and reliability.
To enable advanced VM statistics, VMware Tools must be installed on the virtual machine. Once VMware Tools are installed, you can enable advanced statistics in the VM configuration. To do this, follow the steps below:
Right-click on the virtual machine and select "Edit Settings".
Select "Advanced options" and click "Edit settings".
Select "Enable advanced statistics collection" and click "OK".
Once advanced VM statistics are enabled, you can view and analyze these statistics using VMware monitoring tools such as vCenter Server, vRealize Operations Manager, among others. This will allow you to gain a better understanding of VM performance and health and help you make informed decisions on how to optimize VM configuration to maximize VM performance and efficiency.
Configuring vCenter for monitoring
Discovery Applications VMware makes use of the metrics provided by the vCenter® and ESXi VMware® API. The availability of these metrics depends on the levels configured for statistics collection.
These levels can be changed in the vCenter Server Settings menu and in the Statistics option. For each time option and each level you will get the description of the counters collected by vCenter. The minimum level to monitor with the Pandora FMS plugin is Level 2.
Depending on the vCenter configuration, it is possible that some modules do not report data in Pandora FMS. This could be because:
Some plugin is missing to be installed in the vCenter.
It is necessary to install a VMware® agent (vmware-tools) in the entity.
Simply because the entity is turned off (virtual machine or ESXi).
To solve these problems you should consult the VMware documentation.
Some solutions, such as Hardware Status monitoring, may require advanced configuration of both vCenter and ESX-supporting hosts.
Compatibility matrix
| Environments where it has been tested | Version 6.5.0 |
| Environments where it should work | Any VMWare environment |
| Environments where it has been tested | Rocky linux, Fedora 34 |
| Environments where it should work | Any Linux system |
Prerrequisites
The plugin is a binary that contains the packaged dependencies so it is not necessary to install any dependencies to use it.
The only requirement for the plugin to work is that the lib folder, attached with the plugin, is located in the same path as the binary.
However, for the monitoring of some advanced statistics, it does require the installation of VMware Tools on the machines on which it is required to obtain these statistics.
By default, the vSphere API uses TCP port 443 for communication, so make sure that this port is accessible.
With VMware Tools you can obtain several advanced performance metrics and statistics of the virtual machines
Parameters and configuration
Parameters
| --generate_password | To generate an encrypted password (if this password is to be used later for connection, it must be entered in the configuration option "password" and the option "use_encrypted_password" must also be activated in the configuration file with 1. |
| --as_discovery_plugin | Option to use it in discovery mode. |
Configuration blocks
The configuration file is divided into the following blocks
- Configuration
- Datacenter
- Datastore
- ESX
- VM
- Rename
- Reject
- Header
Each of the blocks is specified in the configuration file by entering its parameters below these blocks, for example :
Configuration
server 192.168.100.105
user pandorafms
pass P@$5w0rd!
datacenter ha-datacenter
Each block and its options are detailed below:
Configuration
Under the configuration block you can specify the following parameters
Global configuration
| server | Name or IP of the server to monitor |
| user | Account user |
| pass | Account password |
| datacenter | Datacenter where the plugin will point to |
| temporal | Path where temporary files will be stored |
| logfile | Path where the log file will be stored |
| entities_list | Path where the entities_list file will be created (more information about this file below) |
| transfer_mode | Execution mode, the two possible options are local or tentacle |
| local_folder | Path of the folder where the XML of the agents will be created for the local transfer mode (transfer_mode = local) |
| pandora_url |
pandora URL (only if required to use the event mode of the plugin) |
| api_pass | pandora api password (only if required to use the plugin event mode) |
| api_user | pandora api user (only if required to use plugin events mode) |
| api_user_pass | Pandora api user password (only if required to use plugin event mode) |
| event_mode | To activate the vCenter event monitoring, it is activated with 1. The events are copied to the Pandora FMS event list and become part of its normal flow (requires connectivity with the Pandora FMS console API). |
| event_pointer_file | Path where the event_pointer_file file will be saved. |
| tentacle_ip | tentacle IP, required if the plugin is executed in transfer_mode tentacle |
| tentacle_port | Tentacle port, default is 41121 |
| tentacle_opts | Additional options for file transfer to the specified Tentacle server |
| virtual_network_monitoring | Enables monitoring of virtual switches with value 1 |
| use_encrypted_password | Enables use of an encrypted password with value 1 |
| threads | Number of threads to be used by the plugin in agent creation |
| interval | Interval in seconds in which the plugin agents are created |
| recon_interval | Interval in seconds after which the temporary entity cache file will be automatically deleted to rescan the VMware® infrastructure. |
| enable_recon_interval | Set recon_interval to 1. |
| group | Group where the agents will be created |
| use_ds_alias_as_name | Triggers the use of datastore agent alias as agent name with value 1 |
| statsinterval | Interval in seconds for statistics taken using the "custom_performance" option |
| flat_datastore_agents | Triggers creation of a single agent for datastores with name "VMWareDatastores" with value 1 |
| use_ds_entity_name | Enables use of Datastore name as agent name with value 1 |
Control parameters of monitorable elements
| monitor_exclusive_agents | Enable the monitoring of specific agents (these are specified in the parameters below) with value 1 |
| exclusive_esx | If monitor_exclusive_agent is enabled, it is used to specify the esxi to monitor. Its value will be an array JSON with the agents to monitor |
| exclusive_datastores | If monitor_exclusive_agent is enabled, it is used to specify the datastores to monitor. Its value will be an array type JSON with the agents to monitor |
| exclusive_vm | If monitor_exclusive_agent is enabled, it is used to specify the vm to monitor. Its value will be an array type JSON with the agents to monitor |
| scan_datastore | Activates datastore scanning with value 1 |
| scan_datacenter | Triggers datacenter scan with value 1 |
| scan_esx | Triggers esx scan with value 1 |
| scan_vm | Triggers virtual machine scan with value 1 |
Datacenter
Module activation or deactivation parameters
The following modules can be enabled or disabled in the configuration file using "enabled" or "disabled".
| ping | Checking ping to the machine that supports vCenter |
| check443 | Checking port 443 on the machine that supports vCenter |
Datastore
Module activation or deactivation parameters
The following modules can be enabled or disabled in the configuration file using "enabled" or "disabled".
| capacity | Maximum capacity of the datastore in bytes |
| freeSpace | Percentage of free space on the datastore |
| overallocation | Percentage of disk overallocation |
| freeSpaceBytes | Amount of free disk space in bytes |
| dsPathStatus | Datastore path status |
ESX
Module activation or deactivation parameters
The following modules can be enabled or disabled in the configuration file using "enabled" or "disabled".
| diskRead | Kb/s disk read rate |
| diskWrite | Rate of Kb/s written from disk |
| kernelReadLatency | Disk read latency in milliseconds |
| kernelWriteLatency | Disk write latency in milliseconds |
| deviceReadLatency | Time it takes for a storage device to respond to a data read request |
| deviceWriteLatency | Time it takes for a storage device to respond to a data write request |
| cpuInfo | General CPU information (creates a module for each ESXi CPU) |
| pciDevice | Number of assigned PCI devices |
| hbaDevice | Number of HBA (Host Bus Adapter) devices assigned to a virtual machine |
| pnicInfo | Information related to the physical network adapters (PNICs) that are configured on the ESXi host |
| vnicInfo | Information about the virtual network interfaces of the host |
| cpuUsagePercent | Percentage of current CPU usage on the host |
| memoryUsagePercent | Percentage of current RAM usage on the host |
| diskRate | Read and write data transfer rate on the host virtual disk |
| maxDiskLatency | Maximum I/O latency time on the virtual disk of the host |
| netUsage | Network data transfer rate on host virtual disk |
| systemHealthInfo | Information about the general health status of the system |
| netReceived | Amount of data received through the host network interface. netTransmitted Amount of transmitted data |
| netTransmitted | Amount of data transmitted over the host network interface |
| netPkgRx | Number of network packets received over the host network interface. netPkgTx Number of network packets received over the host network interface |
| netPkgTx | Number of network packets transmitted over the host network interface |
| pathStatus | Paths state |
VM
Module activation or deactivation parameters
The following modules can be enabled or disabled in the configuration file using "enabled" or "disabled".
| virtualImagePath | Path of the virtual disk image associated with a particular virtual machine |
| toolsRunningStatus | Running status of VMware Tools on a virtual machine |
| host | hosting the virtual machines in a virtualization environment |
| connectionState | Connection status between a virtual machine and its ESXi host in a virtualization environment |
| guestState | State of the virtual machine in terms of its operating system and running applications |
| guestOS | Operating system running on the virtual machine |
| hostName | Name of the physical host on which the virtual machine is running |
| powerState | Displays whether the virtual machine is powered on or off |
| triggeredAlarmState | Displays the status of the alarms triggered in the virtual machine |
| bootTime | Displays the date and time the virtual machine started |
| vcpuAllocation | Number of virtual CPUs allocated to the virtual machine |
| cpuAllocation | Number of CPU resources assigned to the virtual machine |
| consumedOverheadMemory | Amount of memory used by the host to perform tasks related to the virtual machine |
| hostMemoryUsage | Amount of memory used by the host to perform tasks related to the virtual machine |
| maxCpuUsage | Maximum CPU usage in the virtual machine |
| maxMemoryUsage | Maximum memory usage in the virtual machine |
| memoryMBAllocation | Amount of RAM memory allocated to the virtual machine |
| memoryAllocation | Amount of memory allocated to the virtual machine |
| uptimeSeconds | Total time that the virtual machine has been running |
| memoryOverhead | Amount of memory used by the host for monitoring and management tasks of the virtual machine |
| overallCpuDemand | Total number of CPU resources requested by the virtual machine |
| overallCpuUsage | Total amount of CPU resources used by the virtual machine |
| privateMemory | Amount of memory used by the virtual machine for its private processes |
| sharedMemory | Amount of memory shared between the virtual machine and the host |
| diskUsed | Amount of space used on the virtual disk of the virtual machine |
| provisioningUsed | Amount of space used in the virtual machine's provisioning storage |
| macAddress | MAC address assigned to the virtual machine's network interface |
| ipAddress | IP address assigned to the virtual machine's network interface |
| heartbeat | State of the virtual machine's heartbeat |
| cpuReady | Amount of time the virtual machine is waiting for the CPU |
| snapshotCounter | Number of snapshots created for the virtual machine |
| totalReadLatency | Total latency time for reading the virtual disk of the virtual machine |
| totalWriteLatency | Total write latency time of the virtual disk of the virtual machine |
| cpuUsagePercent | Percentage of current CPU usage in the virtual machine |
| memoryUsagePercent | Percentage of current RAM memory usage in the virtual machine |
| diskRate | Data transfer rate of reading and writing data on the virtual disk of the virtual machine |
| maxDiskLatency | Maximum I/O latency time on the virtual disk of the virtual machine |
| netUsage | Network data transfer rate in the virtual machine |
| systemHealthInfo | Information about the overall system health status |
| netReceived | Amount of data received through the virtual machine's network interface |
| netTransmitted | Amount of data transmitted through the virtual machine's network interface |
| netPkgRx | Number of network packets received through the virtual machine's network interface |
| netPkgTx | Number of network packets transmitted over the virtual machine's network interface |
| snapshotCounter | Number of snapshots of the virtual machine |
| snapshotDate | Date of each snapshot |
Rename
The renaming of entities is done through the RENAME token and allows to rename the entities discovered by the plugin. When using this functionality, the agents created in Pandora FMS will appear with the new assigned name. The structure of this section is as follows:
<current name> TO <new name>An example of a configuration in this section could be the following:
 #Rename entities
 Rename
 Debian 11 TO Virtual Machine 1
 RedHat 12 TO Web server
 ESX Workstation TO Host Work Sales
Header
In header you can add a prefix to each agent name, which can be useful for a faster identification of these in pandora. The syntax of each block is :
dc <prefix>
ds <prefix>
esx <prefix>
vm <prefix>
An example may be the following :
dc DC_
ds DS_
esx ESXi_
vm VM_
In this example, all virtual machine agents would have a name with the following structure:
VM_<agent_name>Reject
It is used to discard the monitoring of specific virtual machines or ESX, each entity to disable monitoring must be specified in the configuration file, below this block, in a different line for each entity.
An example can be the following:
Reject
gridNode
Vm_apx
Vm_acr
It is also used to disable the IP scanning of the agents, it is used with this parameter.
| all_ipaddresses | Disables scanning of IP addresses with value 1 |
Example configuration file
Configuration
server 192.168.80.36
datacenter ha-datacenter
user pandora
group Applications
use_encrypted_password 0
interval 300
pass HhVGFJk!H
threads 5
event_mode 0
retry_send 0
virtual_network_monitoring 0
recon_interval 300

monitor_exclusive_agents 0
exclusive_esx []
exclusive_datastores []
exclusive_vm []

scan_datastore 1
scan_datacenter 1
scan_esx 1
scan_vm 1

logfile /tmp/tmp_discovery.taskMD5.log
entities_list /tmp/tmp_discovery.taskMD5.entities
event_pointer_file /tmp/tmp_discovery.taskMD5.events
temporal /tmp
transfer_mode tentacle
tentacle_ip 127.0.0.1
tentacle_port 41121
tentacle_opts
local_folder /var/spool/pandora/data_in
pandora_url http://127.0.0.1/pandora_console/
api_pass pandora
api_user admin
apipandorapass 1234

Rename
venger TO esx_venger
SSD100GB TO disk_store_1

Reject
gridNode
Vm_apx
Vm_acr
About monitoring:
Entity scan
Due to the size of the VMware® infrastructures of the enterprise client, a general scan of all available entities in each run could trigger performance issues.
To avoid this situation, the VMware monitoring plug-in has the entity file ( entities_list)where it stores the list of entities scanned in the first run).
As long as this file exists, monitoring will be limited to the entities indicated in the file.
Monitoring configuration
The following sections of the file configure the modules created for each type of entity. These sections use the Datacenter, Datastore, ESX and VM sections. In these sections you can enable and disable the modules to be monitored. The following example contains a configuration according to the modules that would be created for ESX and virtual machines.
 ...
 #ESX Modules
 ESX
 cpuUsagePercent disabled
 diskRead enabled
 diskWrite enabled

 #VM Modules
 VM
 diskReadLatency disabled
 diskWriteLatency disabled
 diskRate enabled
 ...
Each configuration line is a module. Although in the example above, all modules are created with default values. You can configure the following values: 'Name', 'description' and 'limits' for the 'warning' and 'critical' states. An example of this type of configuration would look like the following:
 ...
 #VM Modules
 VM
 diskReadLatency disabled
 diskWriteLatency disabled
 diskRate name = Disk Rate; desc = Lec Rate/Esc disk; limits_warn = 5 10; limits_crit = 0 4
 ...
The available options for the module configuration are these:
<module> disabled: The module will NOT be created.
<module> enabled: The module WILL be created (with default values)
<module> name = <name>; desc = <description>; limits_warn <lim_warn>; limits_crit <lim_crit>"
Some modules when enabled in the plugin can generate multiple modules within their agents. For those cases when specifying a custom name for the module you can use the string "%s" to be replaced by an identifier of the element in each case. These modules and their identifiers are:
- ESX:
- cpuInfo: Index.
- pciDevice:Device name
- hbaDevice: Device name
- pnicInfo: Device name
- vnicInfo: Index.
- systemHealthInfo: Sensor type and name
- disksState: Device name
- VM:
- diskUsed: Disk name (if any) or index
- macAddress: Index.
- ipAddress: Index.
- snapshotDate: Snapshot name.
Use example
#VM Modules
VM
diskUsed name = Disk %s Used Percentage ; desc = Disk Used %; limits_warn = 80 90; limits_crit = 90 100
The module will be created with the given name and description. The module will define thresholds for 'maximum' and 'minimum' for critical and warning states.
It is also possible to configure text strings for the limits of the Warning and Critical states of the Modules. The configuration would look like the following:
powerState name = Operating Status; desc = Operating Status VM; limits_warn = .*suspended.*; limits_crit = .*poweredOff.*Custom Performance Metrics
It is possible to configure new modules related to Performance Counters for virtual machines and ESX. To configure a new performance module you will need to use the following structure within the ESC or VM blocks of the configuration file:
custom_performance type = mem; metric = swapinRate; module_type = generic_data; name = Swap In Rate; desc = Swap In Rate for host; limits_warn = 0 0; limits_crit = 0 0The parameters to be configured are:
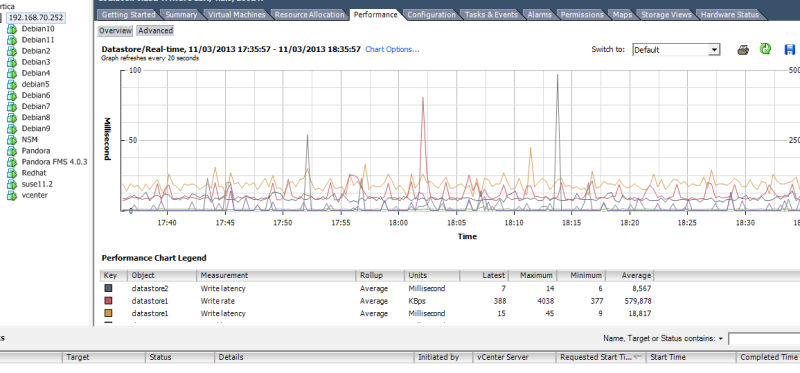
To see the complete list of all metrics according to their type you should click on the Advanced button and then on the Char option button. You will see a list with all the metric types and the respective metrics of each type:
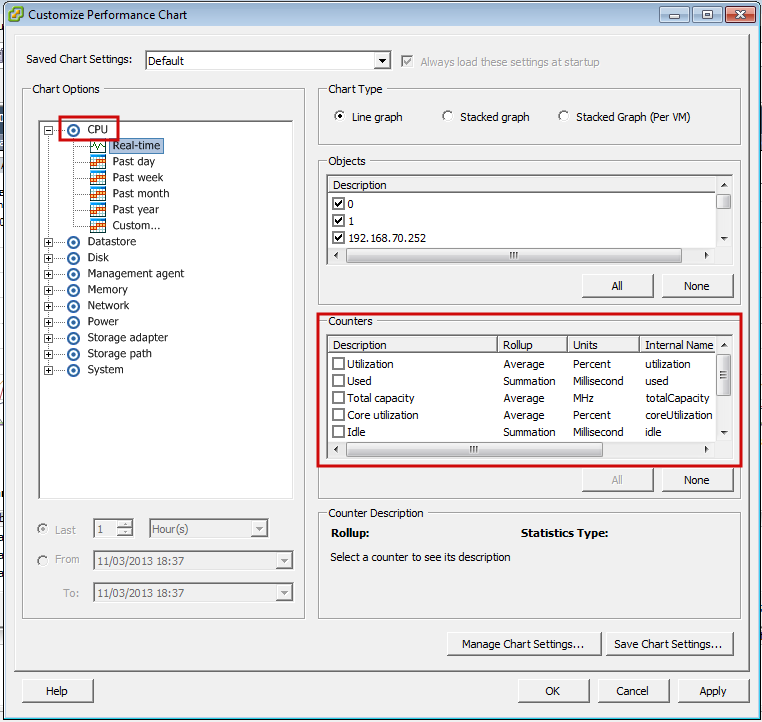
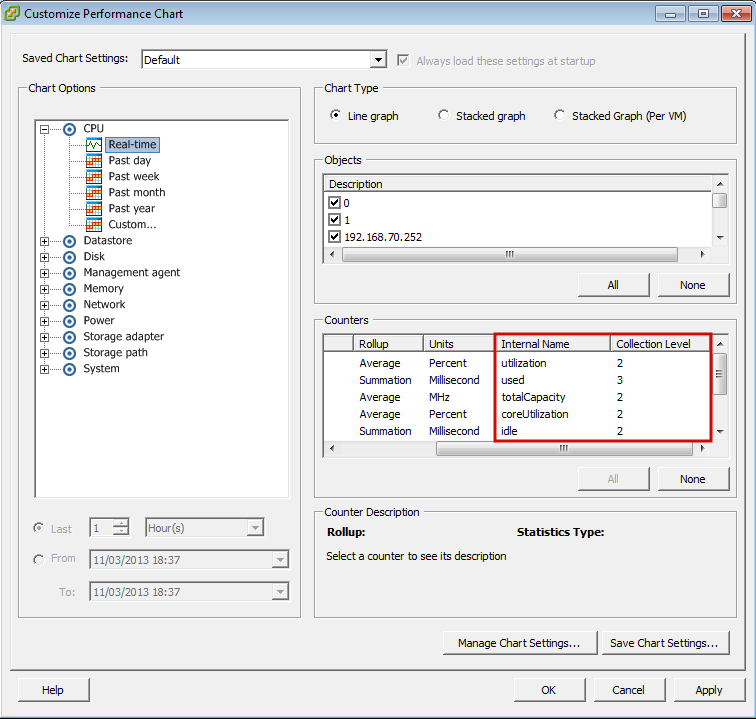
For each type of metric, a series of counters will appear, which are the variables that can be monitored with Pandora FMS. To monitor a variable we need its Internal Name. You should also make sure that the statistics level, configured in the vCenter, allows to show the variable we are looking for, comparing it with the Collection Level field of the metric.
For example, if you need to see the CPU usage of an ESX host, we will look for the cpu type variables for an ESX and from the available ones we will choose utilization. The line you have to add to the configuration file (in this case inside the ESX section) will be the following:
custom_performance type = cpu; metric = utilization; module_type = generic_data; name = CPU Utilization; desc = CPU Utilization for ESX; limits_warn = 0 0; limits_crit = 0 0VMware® virtual architecture management and visualization
Two extensions are distributed together with the VMware® plug-in: VMware Manager® and VMware View®. VMware View® allows you to visualize all components of the VMware® architecture in a convenient way. In addition, with VMware Manager® you will be able to manage virtual machines by stopping, starting, resetting or suspending their activity from the Pandora FMS Console.
Using VMware View
To start using the VMware® architecture viewer go to Monitoring → VMware view.
If you do not have any device to monitor or you have not configured the vCenter® and ESXi VMware® API you will get something similar to the following image:
If the plugin is in operational state you will get this message (click the Show button):
The VMware View® extension will show you a map similar to the one below with the entire VMware® architecture.
The map contains the elements of the VMware® architecture (virtual machines, ESX, DataStores and DataCenters) with different icons that identify them, as well as the status of the Pandora FMS Agents that represent each element. In addition, the relationship between virtual machines, ESX and DataCenter is shown. In this way, at a glance you can see the status of the VMware® architecture in a simple way.
This extension has some options that help to improve the visualization of the architecture by hiding elements, increasing the font size and allowing to zoom in to see the elements in more detail.
Using the above options you can show only the DataCenter and ESX.
VMware View Dashboards
VMware View® provides two additional views in addition to the topology map view of the virtual architecture. The new tabs allow you to switch between the different views of the VMware View®.
The first view is a general dashboard where you can see at a glance the overall status of the virtual architecture in numbers, i.e. how many virtual machines, ESXi hosts or DataStores have problems. You will also be able to see general performance parameters thanks to graphs showing the 5 virtual machines that consume the most memory, CPU, disk and network of the entire virtual architecture.
The second view allows you to see the performance parameters of each ESX host. In this view you can choose an ESX host for which a dashboard will be loaded showing the status of the host and virtual machines, as well as performance metrics related to CPU, memory, disk and network usage of the ESXi host. In addition, this view also provides graphs showing the virtual machines that consume the most resources (CPU, memory, disk and network) on the selected host.
VMware View Options Tab
The VMWare extension is included together with Pandora FMS Console Enterprise. It has a configuration panel to set dashboard and map options:
You will be able to adjust the view thresholds (minimum - maximum) of the dashboard graphs.
You can adjust the default map view settings.
Contains a link to the configuration management system.
Accessible from the VMWare View® options tab:
Using the VMware Manager extension from Agents
To use the VMware® Manager extension you must go to the operation view of an Agent that corresponds to a virtual machine in that architecture. Within this view you will see an icon with the VMware® symbol that corresponds to the extension.
The VMware® Manager extension allows to manage virtual machines from the Pandora FMS Console. The extension shows the current status of the virtual machine with a color code:
Green = On (virtual machine running).
Orange = Suspended (virtual machine whose execution is paused).
Gray = Stopped (virtual machine is not running).
In addition, in a combo box it shows the available statuses and allows you to change the virtual machine status to the selected one by clicking on the Change Status button.
Selecting the Stop status and pressing Change status:
This will cause the virtual machine execution to stop and the VMware Manage extension view will change, thus showing that the virtual machine is now stopped:
If you have configured monitoring using RENAME this utility will not work against renamed targets.
Events monitoring
This functionality makes a copy of the events present in the VMware® vCenter to the Pandora FMS event list.
These events become part of the Pandora FMS normal event flow and are automatically associated to the Agent that represents the vCenter they come from (if the Agent exists at the time the event is created).
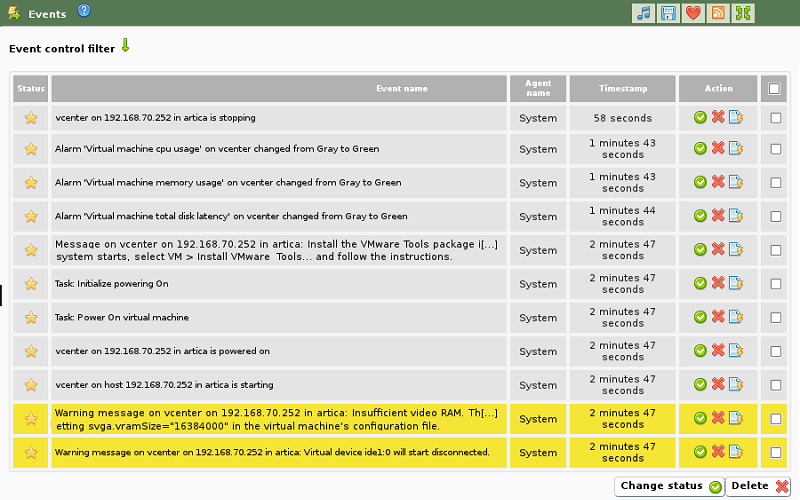
In the event dump process, the information and severity that VMware® indicates in the creation of the event is respected, so that the events with a critical, warning or informative severity level will keep these levels in Pandora FMS. The following image shows an example of the detailed information of an event dumped from VMware to Pandora FMS.
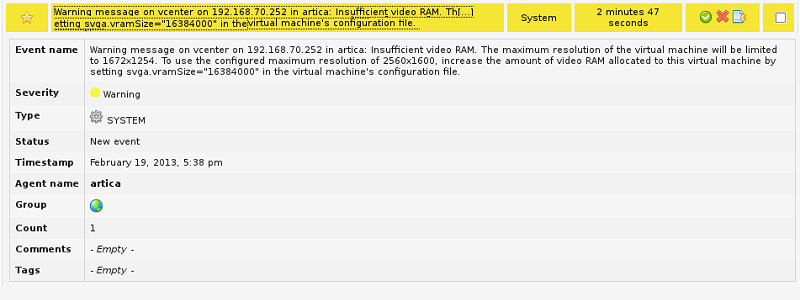
With all the events present in Pandora FMS you will be able to perform all the available actions for event management, such as: creating alerts, configuring filters, opening incidences, etc.
Table of events
This list of events is provided to make easier the task of configuring event alerts in Pandora FMS. To obtain a complete and updated reference of all the possible events, you should consult the documentation that VMware® has about it.
| Event | Severity | Event type |
|---|---|---|
| An account was created on host {host.name} | Informational | System |
| Account {account} was removed on host {host.name} | Informational | System |
| An account was updated on host {host.name} | Informational | System |
| The default password for the root user on the host {host.name} has not been changed | Informational | System |
| Alarm '{alarm.name}' on {entity.name} triggered an action | Informational | System |
| Created alarm '{alarm.name}' on {entity.name} | Informational | System |
| Alarm '{alarm.name}' on {entity.name} sent email to {to} | Informational | System |
| Alarm '{alarm.name}' on {entity.name} cannot send email to {to} | Critical | System |
| Reconfigured alarm '{alarm.name}' on {entity.name} | Informational | System |
| Removed alarm '{alarm.name}' on {entity.name} | Informational | System |
| Alarm '{alarm.name}' on {entity.name} ran script {script} | Informational | System |
| Alarm '{alarm.name}' on {entity.name} did not complete script: {reason.msg} | Critical | System |
| Alarm '{alarm.name}': an SNMP trap for entity {entity.name} was sent | Informational | System |
| Alarm '{alarm.name}' on entity {entity.name} did not send SNMP trap: {reason.msg} | Critical | System |
| Alarm '{alarm.name}' on {entity.name} changed from {from.@enum.ManagedEntity.Status} to {to.@enum.ManagedEntity.Status} | Informational | System |
| All running virtual machines are licensed | Informational | System |
| User cannot logon since the user is already logged on | Informational | System |
| Cannot login {userName}@{ipAddress} | Critical | System |
| The operation performed on host {host.name} in {datacenter.name} was canceled | Informational | System |
| Changed ownership of file name {filename} from {oldOwner} to {newOwner} on {host.name} in {datacenter.name}. | Informational | System |
| Cannot change ownership of file name {filename} from {owner} to {attemptedOwner} on {host.name} in {datacenter.name}. | Critical | System |
| Checked cluster for compliance | Informational | System |
| Created cluster {computeResource.name} in {datacenter.name} | Informational | System |
| Removed cluster {computeResource.name} in datacenter {datacenter.name} | Informational | System |
| Insufficient capacity in cluster {computeResource.name} to satisfy resource configuration in {datacenter.name} | Critical | System |
| Reconfigured cluster {computeResource.name} in datacenter {datacenter.name} | Informational | System |
| Configuration status on cluster {computeResource.name} changed from {oldStatus.@enum.ManagedEntity.Status} to {newStatus.@enum.ManagedEntity.Status} in {datacenter.name} | Informational | System |
| Created new custom field definition {name} | Informational | System |
| Removed field definition {name} | Informational | System |
| Renamed field definition from {name} to {newName} | Informational | System |
| Changed custom field {name} on {entity.name} in {datacenter.name} to {value} | Informational | System |
| Cannot complete customization of VM {vm.name}. See customization log at {logLocation} on the guest OS for details. | Informational | System |
| An error occurred while setting up Linux identity. See log file '{logLocation}' on guest OS for details. | Critical | System |
| An error occurred while setting up network properties of the guest OS. See the log file {logLocation} in the guest OS for details. | Critical | System |
| Started customization of VM {vm.name}. Customization log located at {logLocation} in the guest OS. | Informational | System |
| Customization of VM {vm.name} succeeded. Customization log located at {logLocation} in the guest OS. | Informational | System |
| The version of Sysprep {sysprepVersion} provided for customizing VM {vm.name} does not match the version of guest OS {systemVersion}. See the log file {logLocation} in the guest OS for more information. | Critical | System |
| An error occurred while customizing VM {vm.name}. For details reference the log file {logLocation} in the guest OS. | Critical | System |
| dvPort group {net.name} in {datacenter.name} was added to switch {dvs.name}. | Informational | System |
| dvPort group {net.name} in {datacenter.name} was deleted. | Informational | System |
| Informational | System | |
| dvPort group {net.name} in {datacenter.name} was reconfigured. | Informational | System |
| dvPort group {oldName} in {datacenter.name} was renamed to {newName} | Informational | System |
| HA admission control disabled on cluster {computeResource.name} in {datacenter.name} | Informational | System |
| HA admission control enabled on cluster {computeResource.name} in {datacenter.name} | Informational | System |
| Re-established contact with a primary host in this HA cluster | Informational | System |
| Unable to contact a primary HA agent in cluster {computeResource.name} in {datacenter.name} | Critical | System |
| All hosts in the HA cluster {computeResource.name} in {datacenter.name} were isolated from the network. Check the network configuration for proper network redundancy in the management network. | Critical | System |
| HA disabled on cluster {computeResource.name} in {datacenter.name} | Informational | System |
| HA enabled on cluster {computeResource.name} in {datacenter.name} | Informational | System |
| A possible host failure has been detected by HA on {failedHost.name} in cluster {computeResource.name} in {datacenter.name} | Critical | System |
| Host {isolatedHost.name} has been isolated from cluster {computeResource.name} in {datacenter.name} | Warning | System |
| Created datacenter {datacenter.name} in folder {parent.name} | Informational | System |
| Renamed datacenter from {oldName} to {newName} | Informational | System |
| Datastore {datastore.name} increased in capacity from {oldCapacity} bytes to {newCapacity} bytes in {datacenter.name} | Informational | System |
| Removed unconfigured datastore {datastore.name} | Informational | System |
| Discovered datastore {datastore.name} on {host.name} in {datacenter.name} | Informational | System |
| Multiple datastores named {datastore} detected on host {host.name} in {datacenter.name} | Critical | System |
| <internal> | Informational | System |
| File or directory {sourceFile} copied from {sourceDatastore.name} to {datastore.name} as {targetFile} | Informational | System |
| File or directory {targetFile} deleted from {datastore.name} | Informational | System |
| File or directory {sourceFile} moved from {sourceDatastore.name} to {datastore.name} as {targetFile} | Informational | System |
| Reconfigured Storage I/O Control on datastore {datastore.name} | Informational | System |
| Configured datastore principal {datastorePrincipal} on host {host.name} in {datacenter.name} | Informational | System |
| Removed datastore {datastore.name} from {host.name} in {datacenter.name} | Informational | System |
| Renamed datastore from {oldName} to {newName} in {datacenter.name} | Informational | System |
| Renamed datastore from {oldName} to {newName} in {datacenter.name} | Informational | System |
| Disabled DRS on cluster {computeResource.name} in datacenter {datacenter.name} | Informational | System |
| Enabled DRS on {computeResource.name} with automation level {behavior} in {datacenter.name} | Informational | System |
| DRS put {host.name} into standby mode | Informational | System |
| DRS is putting {host.name} into standby mode | Informational | System |
| DRS cannot move {host.name} out of standby mode | Critical | System |
| DRS moved {host.name} out of standby mode | Informational | System |
| DRS is moving {host.name} out of standby mode | Informational | System |
| DRS invocation not completed | Critical | System |
| DRS has recovered from the failure | Informational | System |
| Unable to apply DRS resource settings on host {host.name} in {datacenter.name}. {reason.msg}. This can significantly reduce the effectiveness of DRS. | Critical | System |
| Resource configuration specification returns to synchronization from previous failure on host '{host.name}' in {datacenter.name} | Informational | System |
| {vm.name} on {host.name} in {datacenter.name} is now compliant with DRS VM-Host affinity rules | Informational | System |
| {vm.name} on {host.name} in {datacenter.name} is violating a DRS VM-Host affinity rule | Informational | System |
| DRS migrated {vm.name} from {sourceHost.name} to {host.name} in cluster {computeResource.name} in {datacenter.name} | Informational | System |
| DRS powered On {vm.name} on {host.name} in {datacenter.name} | Informational | System |
| Virtual machine {macAddress} on host {host.name} has a duplicate IP {duplicateIP} | Informational | System |
| A vNetwork Distributed Switch {dvs.name} was created in {datacenter.name}. | Informational | System |
| vNetwork Distributed Switch {dvs.name} in {datacenter.name} was deleted. | Informational | System |
| vNetwork Distributed Switch event | Informational | System |
| The vNetwork Distributed Switch {dvs.name} configuration on the host was synchronized with that of the vCenter Server. | Informational | System |
| The host {hostJoined.name} joined the vNetwork Distributed Switch {dvs.name} in {datacenter.name}. | Informational | System |
| The host {hostLeft.name} left the vNetwork Distributed Switch {dvs.name} in {datacenter.name}. | Informational | System |
| The host {hostMember.name} changed status on the vNetwork Distributed Switch {dvs.name} in {datacenter.name}. | Informational | System |
| The vNetwork Distributed Switch {dvs.name} configuration on the host differed from that of the vCenter Server. | Warning | System |
| vNetwork Distributed Switch {srcDvs.name} was merged into {dstDvs.name} in {datacenter.name}. | Informational | System |
| dvPort {portKey} was blocked in the vNetwork Distributed Switch {dvs.name} in {datacenter.name}. | Informational | System |
| The port {portKey} was connected in the vNetwork Distributed Switch {dvs.name} in {datacenter.name} | Informational | System |
| New ports were created in the vNetwork Distributed Switch {dvs.name} in {datacenter.name}. | Informational | System |
| Deleted ports in the vNetwork Distributed Switch {dvs.name} in {datacenter.name}. | Informational | System |
| The dvPort {portKey} was disconnected in the vNetwork Distributed Switch {dvs.name} in {datacenter.name}. | Informational | System |
| dvPort {portKey} entered passthrough mode in the vNetwork Distributed Switch {dvs.name} in {datacenter.name}. | Informational | System |
| dvPort {portKey} exited passthrough mode in the vNetwork Distributed Switch {dvs.name} in {datacenter.name}. | Informational | System |
| dvPort {portKey} was moved into the dvPort group {portgroupName} in {datacenter.name}. | Informational | System |
| dvPort {portKey} was moved out of the dvPort group {portgroupName} in {datacenter.name}. | Informational | System |
| The port {portKey} link was down in the vNetwork Distributed Switch {dvs.name} in {datacenter.name} | Informational | System |
| The port {portKey} link was up in the vNetwork Distributed Switch {dvs.name} in {datacenter.name} | Informational | System |
| Reconfigured ports in the vNetwork Distributed Switch {dvs.name} in {datacenter.name}. | Informational | System |
| dvPort {portKey} was unblocked in the vNetwork Distributed Switch {dvs.name} in {datacenter.name}. | Informational | System |
| The vNetwork Distributed Switch {dvs.name} in {datacenter.name} was reconfigured. | Informational | System |
| The vNetwork Distributed Switch {oldName} in {datacenter.name} was renamed to {newName}. | Informational | System |
| An upgrade for the vNetwork Distributed Switch {dvs.name} in datacenter {datacenter.name} is available. | Informational | System |
| An upgrade for the vNetwork Distributed Switch {dvs.name} in datacenter {datacenter.name} is in progress. | Informational | System |
| Cannot complete an upgrade for the vNetwork Distributed Switch {dvs.name} in datacenter {datacenter.name} | Informational | System |
| vNetwork Distributed Switch {dvs.name} in datacenter {datacenter.name} was upgraded. | Informational | System |
| Host {host.name} in {datacenter.name} has entered maintenance mode | Informational | System |
| The host {host.name} is in standby mode | Informational | System |
| Host {host.name} in {datacenter.name} has started to enter maintenance mode | Informational | System |
| The host {host.name} is entering standby mode | Informational | System |
| {message} | Critical | System |
| Host {host.name} in {datacenter.name} has exited maintenance mode | Informational | System |
| The host {host.name} could not exit standby mode | Critical | System |
| The host {host.name} is no longer in standby mode | Informational | System |
| The host {host.name} is exiting standby mode | Informational | System |
| Sufficient resources are available to satisfy HA failover level in cluster {computeResource.name} in {datacenter.name} | Informational | System |
| General event: {message} | Informational | System |
| Error detected on {host.name} in {datacenter.name}: {message} | Critical | System |
| Issue detected on {host.name} in {datacenter.name}: {message} | Informational | System |
| Issue detected on {host.name} in {datacenter.name}: {message} | Warning | System |
| User logged event: {message} | Informational | System |
| Error detected for {vm.name} on {host.name} in {datacenter.name}: {message} | Critical | System |
| Issue detected for {vm.name} on {host.name} in {datacenter.name}: {message} | Informational | System |
| Issue detected for {vm.name} on {host.name} in {datacenter.name}: {message} | Warning | System |
| The vNetwork Distributed Switch corresponding to the proxy switches {switchUuid} on the host {host.name} does not exist in vCenter Server or does not contain this host. | Informational | System |
| A ghost proxy switch {switchUuid} on the host {host.name} was resolved. | Informational | System |
| The message changed: {message} | Informational | System |
| {componentName} status changed from {oldStatus} to {newStatus} | Informational | System |
| Cannot add host {hostname} to datacenter {datacenter.name} | Critical | System |
| Added host {host.name} to datacenter {datacenter.name} | Informational | System |
| Administrator access to the host {host.name} is disabled | Warning | System |
| Administrator access to the host {host.name} has been restored | Warning | System |
| Cannot connect {host.name} in {datacenter.name}: cannot configure management account | Critical | System |
| Cannot connect {host.name} in {datacenter.name}: already managed by {serverName} | Critical | System |
| Cannot connect host {host.name} in {datacenter.name} : server agent is not responding | Critical | System |
| Cannot connect {host.name} in {datacenter.name}: incorrect user name or password | Critical | System |
| Cannot connect {host.name} in {datacenter.name}: incompatible version | Critical | System |
| Cannot connect host {host.name} in {datacenter.name}. Did not install or upgrade vCenter agent service. | Critical | System |
| Cannot connect {host.name} in {datacenter.name}: error connecting to host | Critical | System |
| Cannot connect {host.name} in {datacenter.name}: network error | Critical | System |
| Cannot connect host {host.name} in {datacenter.name}: account has insufficient privileges | Critical | System |
| Cannot connect host {host.name} in {datacenter.name} | Critical | System |
| Cannot connect {host.name} in {datacenter.name}: not enough CPU licenses | Critical | System |
| Cannot connect {host.name} in {datacenter.name}: incorrect host name | Critical | System |
| Cannot connect {host.name} in {datacenter.name}: time-out waiting for host response | Critical | System |
| Host {host.name} checked for compliance. | Informational | System |
| Host {host.name} is in compliance with the attached profile | Informational | System |
| Host configuration changes applied. | Informational | System |
| Connected to {host.name} in {datacenter.name} | Informational | System |
| Host {host.name} in {datacenter.name} is not responding | Critical | System |
| dvPort connected to host {host.name} in {datacenter.name} changed status | Informational | System |
| HA agent disabled on {host.name} in cluster {computeResource.name} in {datacenter.name} | Informational | System |
| HA is being disabled on {host.name} in cluster {computeResource.name} in datacenter {datacenter.name} | Informational | System |
| HA agent enabled on {host.name} in cluster {computeResource.name} in {datacenter.name} | Informational | System |
| Enabling HA agent on {host.name} in cluster {computeResource.name} in {datacenter.name} | Warning | System |
| HA agent on {host.name} in cluster {computeResource.name} in {datacenter.name} has an error {message}: {reason.@enum.HostDasErrorEvent.HostDasErrorReason} | Critical | System |
| HA agent on host {host.name} in cluster {computeResource.name} in {datacenter.name} is configured correctly | Informational | System |
| Disconnected from {host.name} in {datacenter.name}. Reason: {reason.@enum.HostDisconnectedEvent.ReasonCode} | Informational | System |
| Cannot restore some administrator permissions to the host {host.name} | Critical | System |
| Host {host.name} has the following extra networks not used by other hosts for HA communication:{ips}. Consider using HA advanced option das.allowNetwork to control network usage | Critical | System |
| Cannot complete command 'hostname -s' on host {host.name} or returned incorrect name format | Critical | System |
| Maximum ({capacity}) number of hosts allowed for this edition of vCenter Server has been reached | Critical | System |
| The virtual machine inventory file on host {host.name} is damaged or unreadable. | Informational | System |
| IP address of the host {host.name} changed from {oldIP} to {newIP} | Informational | System |
| Configuration of host IP address is inconsistent on host {host.name}: address resolved to {ipAddress} and {ipAddress2} | Critical | System |
| Cannot resolve IP address to short name on host {host.name} | Critical | System |
| Host {host.name} could not reach isolation address: {isolationIp} | Critical | System |
| A host license for {host.name} has expired | Critical | System |
| Host {host.name} does not have the following networks used by other hosts for HA communication:{ips}. Consider using HA advanced option das.allowNetwork to control network usage | Critical | System |
| Host monitoring state in {computeResource.name} in {datacenter.name} changed to {state.@enum.DasConfigInfo.ServiceState} | Informational | System |
| Host {host.name} currently has no available networks for HA Communication. The following networks are currently used by HA: {ips} | Critical | System |
| Host {host.name} has no port groups enabled for HA communication. | Critical | System |
| Host {host.name} currently has no management network redundancy | Critical | System |
| Host {host.name} is not in compliance with the attached profile | Critical | System |
| Host {host.name} is not a cluster member in {datacenter.name} | Critical | System |
| Insufficient capacity in host {computeResource.name} to satisfy resource configuration in {datacenter.name} | Critical | System |
| Primary agent {primaryAgent} was not specified as a short name to host {host.name} | Critical | System |
| Profile is applied on the host {host.name} | Informational | System |
| Cannot reconnect to {host.name} in {datacenter.name} | Critical | System |
| Removed host {host.name} in {datacenter.name} | Informational | System |
| Host names {shortName} and {shortName2} both resolved to the same IP address. Check the host's network configuration and DNS entries | Critical | System |
| Cannot resolve short name {shortName} to IP address on host {host.name} | Critical | System |
| Shut down of {host.name} in {datacenter.name}: {reason} | Informational | System |
| Configuration status on host {computeResource.name} changed from {oldStatus.@enum.ManagedEntity.Status} to {newStatus.@enum.ManagedEntity.Status} in {datacenter.name} | Informational | System |
| Cannot synchronize host {host.name}. {reason.msg} | Critical | System |
| Cannot install or upgrade vCenter agent service on {host.name} in {datacenter.name} | Critical | System |
| The userworld swap is not enabled on the host {host.name} | Warning | System |
| Host {host.name} vNIC {vnic.vnic} was reconfigured to use dvPort {vnic.port.portKey} with port level configuration, which might be different from the dvPort group. | Informational | System |
| WWNs are changed for {host.name} | Warning | System |
| The WWN ({wwn}) of {host.name} conflicts with the currently registered WWN | Critical | System |
| Host {host.name} did not provide the information needed to acquire the correct set of licenses | Critical | System |
| {message} | Informational | System |
| Insufficient resources to satisfy HA failover level on cluster {computeResource.name} in {datacenter.name} | Critical | System |
| The license edition '{feature}' is invalid | Critical | System |
| License {feature.featureName} has expired | Critical | System |
| License inventory is not compliant. Licenses are overused | Critical | System |
| Unable to acquire licenses due to a restriction in the option file on the license server. | Critical | System |
| License server {licenseServer} is available | Informational | System |
| License server {licenseServer} is unavailable | Critical | System |
| Created local datastore {datastore.name} on {host.name} in {datacenter.name} | Informational | System |
| The Local Tech Support Mode for the host {host.name} has been enabled | Informational | System |
| Datastore {datastore} which is configured to back the locker does not exist | Warning | System |
| Locker was reconfigured from {oldDatastore} to {newDatastore} datastore | Informational | System |
| Unable to migrate {vm.name} from {host.name} in {datacenter.name}: {fault.msg} | Critical | System |
| Unable to migrate {vm.name} from {host.name} to {dstHost.name} in {datacenter.name}: {fault.msg} | Critical | System |
| Migration of {vm.name} from {host.name} to {dstHost.name} in {datacenter.name}: {fault.msg} | Warning | System |
| Cannot migrate {vm.name} from {host.name} to {dstHost.name} and resource pool {dstPool.name} in {datacenter.name}: {fault.msg} | Critical | System |
| Migration of {vm.name} from {host.name} to {dstHost.name} and resource pool {dstPool.name} in {datacenter.name}: {fault.msg} | Warning | System |
| Migration of {vm.name} from {host.name} in {datacenter.name}: {fault.msg} | Warning | System |
| Created NAS datastore {datastore.name} on {host.name} in {datacenter.name} | Informational | System |
| Cannot login user {userName}@{ipAddress}: no permission | Critical | System |
| No datastores have been configured on the host {host.name} | Informational | System |
| A required license {feature.featureName} is not reserved | Critical | System |
| Unable to automatically migrate {vm.name} from {host.name} | Informational | System |
| Non-VI workload detected on datastore {datastore.name} | Critical | System |
| Not enough resources to failover {vm.name} in {computeResource.name} in {datacenter.name} | Informational | System |
| The vNetwork Distributed Switch configuration on some hosts differed from that of the vCenter Server. | Warning | System |
| Permission created for {principal} on {entity.name}, role is {role.name}, propagation is {propagate.@enum.auth.Permission.propagate} | Informational | System |
| Permission rule removed for {principal} on {entity.name} | Informational | System |
| Permission changed for {principal} on {entity.name}, role is {role.name}, propagation is {propagate.@enum.auth.Permission.propagate} | Informational | System |
| Profile {profile.name} attached. | Informational | System |
| Profile {profile.name} was changed. | Informational | System |
| Profile is created. | Informational | System |
| Profile {profile.name} detached. | Informational | System |
| Profile {profile.name} reference host changed. | Informational | System |
| Profile was removed. | Informational | System |
| Remote Tech Support Mode (SSH) for the host {host.name} has been enabled | Informational | System |
| Created resource pool {resourcePool.name} in compute-resource {computeResource.name} in {datacenter.name} | Informational | System |
| Removed resource pool {resourcePool.name} on {computeResource.name} in {datacenter.name} | Informational | System |
| Moved resource pool {resourcePool.name} from {oldParent.name} to {newParent.name} on {computeResource.name} in {datacenter.name} | Informational | System |
| Updated configuration for {resourcePool.name} in compute-resource {computeResource.name} in {datacenter.name} | Informational | System |
| Resource usage exceeds configuration for resource pool {resourcePool.name} in compute-resource {computeResource.name} in {datacenter.name} | Critical | System |
| New role {role.name} created | Informational | System |
| Role {role.name} removed | Informational | System |
| Modifed role {role.name} | Informational | System |
| Task {scheduledTask.name} on {entity.name} in {datacenter.name} completed successfully | Informational | System |
| Created task {scheduledTask.name} on {entity.name} in {datacenter.name} | Informational | System |
| Task {scheduledTask.name} on {entity.name} in {datacenter.name} sent email to {to} | Informational | System |
| Task {scheduledTask.name} on {entity.name} in {datacenter.name} cannot send email to {to}: {reason.msg} | Critical | System |
| Task {scheduledTask.name} on {entity.name} in {datacenter.name} cannot be completed: {reason.msg} | Critical | System |
| Reconfigured task {scheduledTask.name} on {entity.name} in {datacenter.name} | Informational | System |
| Removed task {scheduledTask.name} on {entity.name} in {datacenter.name} | Informational | System |
| Running task {scheduledTask.name} on {entity.name} in {datacenter.name} | Informational | System |
| A vCenter Server license has expired | Critical | System |
| vCenter started | Informational | System |
| A session for user '{terminatedUsername}' has stopped | Informational | System |
| Task: {info.descriptionId} | Informational | System |
| Task: {info.descriptionId} time-out | Informational | System |
| Upgrading template {legacyTemplate} | Informational | System |
| Cannot upgrade template {legacyTemplate} due to: {reason.msg} | Informational | System |
| Template {legacyTemplate} upgrade completed | Informational | System |
| The operation performed on {host.name} in {datacenter.name} timed out | Warning | System |
| There are {unlicensed} unlicensed virtual machines on host {host} - there are only {available} licenses available | Informational | System |
| {unlicensed} unlicensed virtual machines found on host {host} | Informational | System |
| The agent on host {host.name} is updated and will soon restart | Informational | System |
| User {userLogin} was added to group {group} | Informational | System |
| User {userName}@{ipAddress} logged in | Informational | System |
| User {userName} logged out | Informational | System |
| Password was changed for account {userLogin} on host {host.name} | Informational | System |
| User {userLogin} removed from group {group} | Informational | System |
| {message} | Informational | System |
| Created VMFS datastore {datastore.name} on {host.name} in {datacenter.name} | Informational | System |
| Expanded VMFS datastore {datastore.name} on {host.name} in {datacenter.name} | Informational | System |
| Extended VMFS datastore {datastore.name} on {host.name} in {datacenter.name} | Informational | System |
| A vMotion license for {host.name} has expired | Critical | System |
| Cannot uninstall vCenter agent from {host.name} in {datacenter.name}. {reason.@enum.fault.AgentInstallFailed.Reason} | Critical | System |
| vCenter agent has been uninstalled from {host.name} in {datacenter.name} | Informational | System |
| Cannot upgrade vCenter agent on {host.name} in {datacenter.name}. {reason.@enum.fault.AgentInstallFailed.Reason} | Critical | System |
| vCenter agent has been upgraded on {host.name} in {datacenter.name} | Informational | System |
| VIM account password was changed on host {host.name} | Informational | System |
| Remote console to {vm.name} on {host.name} in {datacenter.name} has been opened | Informational | System |
| A ticket for {vm.name} of type {ticketType} on {host.name} in {datacenter.name} has been acquired | Informational | System |
| Invalid name for {vm.name} on {host.name} in {datacenter.name}. Renamed from {oldName} to {newName} | Informational | System |
| Cloning {vm.name} on host {host.name} in {datacenter.name} to {destName} on host {destHost.name} | Informational | System |
| Cloning {vm.name} on host {host.name} in {datacenter.name} to {destName} on host {destHost.name} | Informational | System |
| Creating {vm.name} on host {host.name} in {datacenter.name} | Informational | System |
| Deploying {vm.name} on host {host.name} in {datacenter.name} from template {srcTemplate.name} | Informational | System |
| Migrating {vm.name} from {host.name} to {destHost.name} in {datacenter.name} | Informational | System |
| Relocating {vm.name} from {host.name} to {destHost.name} in {datacenter.name} | Informational | System |
| Relocating {vm.name} in {datacenter.name} from {host.name} to {destHost.name} | Informational | System |
| Cannot clone {vm.name}: {reason.msg} | Critical | System |
| Clone of {sourceVm.name} completed | Informational | System |
| Configuration file for {vm.name} on {host.name} in {datacenter.name} cannot be found | Informational | System |
| Virtual machine {vm.name} is connected | Informational | System |
| Created virtual machine {vm.name} on {host.name} in {datacenter.name} | Informational | System |
| dvPort connected to VM {vm.name} on {host.name} in {datacenter.name} changed status | Informational | System |
| {vm.name} on {host.name} in cluster {computeResource.name} in {datacenter.name} reset by HA. Reason: {reason.@enum.VmDasBeingResetEvent.ReasonCode} | Informational | System |
| {vm.name} on {host.name} in cluster {computeResource.name} in {datacenter.name} reset by HA. Reason: {reason.@enum.VmDasBeingResetEvent.ReasonCode}. A screenshot is saved at {screenshotFilePath}. | Informational | System |
| Cannot reset {vm.name} on {host.name} in cluster {computeResource.name} in {datacenter.name} | Warning | System |
| Unable to update HA agents given the state of {vm.name} | Critical | System |
| HA agents have been updated with the current state of the virtual machine | Informational | System |
| Disconnecting all hosts as the date of virtual machine {vm.name} has been rolled back | Critical | System |
| Cannot deploy template: {reason.msg} | Critical | System |
| Template {srcTemplate.name} deployed on host {host.name} | Informational | System |
| {vm.name} on host {host.name} in {datacenter.name} is disconnected | Informational | System |
| Discovered {vm.name} on {host.name} in {datacenter.name} | Informational | System |
| Cannot create virtual disk {disk} | Critical | System |
| Migrating {vm.name} off host {host.name} in {datacenter.name} | Informational | System |
| End a recording session on {vm.name} | Informational | System |
| End a replay session on {vm.name} | Informational | System |
| Cannot migrate {vm.name} from {host.name} to {destHost.name} in {datacenter.name} | Critical | System |
| Cannot complete relayout {vm.name} on {host.name} in {datacenter.name}: {reason.msg} | Critical | System |
| Cannot complete relayout for virtual machine {vm.name} which has disks on a VMFS2 volume. | Critical | System |
| vCenter cannot start the Secondary VM {vm.name}. Reason: {reason.@enum.VmFailedStartingSecondaryEvent.FailureReason} | Critical | System |
| Cannot power Off {vm.name} on {host.name} in {datacenter.name}: {reason.msg} | Critical | System |
| Cannot power On {vm.name} on {host.name} in {datacenter.name}. {reason.msg} | Critical | System |
| Cannot reboot the guest OS for {vm.name} on {host.name} in {datacenter.name}. {reason.msg} | Critical | System |
| Cannot suspend {vm.name} on {host.name} in {datacenter.name}: {reason.msg} | Critical | System |
| {vm.name} cannot shut down the guest OS on {host.name} in {datacenter.name}: {reason.msg} | Critical | System |
| {vm.name} cannot standby the guest OS on {host.name} in {datacenter.name}: {reason.msg} | Critical | System |
| Cannot suspend {vm.name} on {host.name} in {datacenter.name}: {reason.msg} | Critical | System |
| vCenter cannot update the Secondary VM {vm.name} configuration | Critical | System |
| Failover unsuccessful for {vm.name} on {host.name} in cluster {computeResource.name} in {datacenter.name}. Reason: {reason.msg} | Warning | System |
| Fault Tolerance state on {vm.name} changed from {oldState.@enum.VirtualMachine.FaultToleranceState} to {newState.@enum.VirtualMachine.FaultToleranceState} | Informational | System |
| Fault Tolerance protection has been turned off for {vm.name} | Informational | System |
| The Fault Tolerance VM ({vm.name}) has been terminated. {reason.@enum.VmFaultToleranceVmTerminatedEvent.TerminateReason} | Informational | System |
| Guest OS reboot for {vm.name} on {host.name} in {datacenter.name} | Informational | System |
| Guest OS shut down for {vm.name} on {host.name} in {datacenter.name} | Informational | System |
| Guest OS standby for {vm.name} on {host.name} in {datacenter.name} | Informational | System |
| VM monitoring state in {computeResource.name} in {datacenter.name} changed to {state.@enum.DasConfigInfo.VmMonitoringState} | Informational | System |
| Assign a new instance UUID ({instanceUuid}) to {vm.name} | Informational | System |
| The instance UUID of {vm.name} has been changed from ({oldInstanceUuid}) to ({newInstanceUuid}) | Informational | System |
| The instance UUID ({instanceUuid}) of {vm.name} conflicts with the instance UUID assigned to {conflictedVm.name} | Critical | System |
| New MAC address ({mac}) assigned to adapter {adapter} for {vm.name} | Informational | System |
| Changed MAC address from {oldMac} to {newMac} for adapter {adapter} for {vm.name} | Warning | System |
| The MAC address ({mac}) of {vm.name} conflicts with MAC assigned to {conflictedVm.name} | Critical | System |
| Reached maximum Secondary VM (with FT turned On) restart count for {vm.name} on {host.name} in cluster {computeResource.name} in {datacenter.name}. | Warning | System |
| Reached maximum VM restart count for {vm.name} on {host.name} in cluster {computeResource.name} in {datacenter.name}. | Warning | System |
| Error message on {vm.name} on {host.name} in {datacenter.name}: {message} | Critical | System |
| Message on {vm.name} on {host.name} in {datacenter.name}: {message} | Informational | System |
| Warning message on {vm.name} on {host.name} in {datacenter.name}: {message} | Warning | System |
| Migration of virtual machine {vm.name} from {sourceHost.name} to {host.name} completed | Informational | System |
| No compatible host for the Secondary VM {vm.name} | Critical | System |
| Not all networks for {vm.name} are accessible by {destHost.name} | Warning | System |
| {vm.name} does not exist on {host.name} in {datacenter.name} | Warning | System |
| {vm.name} was powered Off on the isolated host {isolatedHost.name} in cluster {computeResource.name} in {datacenter.name} | Informational | System |
| {vm.name} on {host.name} in {datacenter.name} is powered off | Informational | System |
| {vm.name} on {host.name} in {datacenter.name} is powered on | Informational | System |
| Virtual machine {vm.name} powered On with vNICs connected to dvPorts that have a port level configuration, which might be different from the dvPort group configuration. | Informational | System |
| VM ({vm.name}) failed over to {host.name}. {reason.@enum.VirtualMachine.NeedSecondaryReason} | Critical | System |
| Reconfigured {vm.name} on {host.name} in {datacenter.name} | Informational | System |
| Registered {vm.name} on {host.name} in {datacenter.name} | Informational | System |
| Relayout of {vm.name} on {host.name} in {datacenter.name} completed | Informational | System |
| {vm.name} on {host.name} in {datacenter.name} is in the correct format and relayout is not necessary | Informational | System |
| {vm.name} on {host.name} reloaded from new configuration {configPath}. | Informational | System |
| {vm.name} on {host.name} could not be reloaded from {configPath}. | Critical | System |
| Cannot relocate virtual machine '{vm.name}' in {datacenter.name} | Critical | System |
| Completed the relocation of the virtual machine | Informational | System |
| Remote console connected to {vm.name} on host {host.name} | Informational | System |
| Remote console disconnected from {vm.name} on host {host.name} | Informational | System |
| Removed {vm.name} on {host.name} from {datacenter.name} | Informational | System |
| Renamed {vm.name} from {oldName} to {newName} in {datacenter.name} | Warning | System |
| {vm.name} on {host.name} in {datacenter.name} is reset | Informational | System |
| Moved {vm.name} from resource pool {oldParent.name} to {newParent.name} in {datacenter.name} | Informational | System |
| Changed resource allocation for {vm.name} | Informational | System |
| Virtual machine {vm.name} was restarted on {host.name} since {sourceHost.name} failed | Informational | System |
| {vm.name} on {host.name} in {datacenter.name} is resumed | Informational | System |
| A Secondary VM has been added for {vm.name} | Informational | System |
| vCenter disabled Fault Tolerance on VM '{vm.name}' because the Secondary VM could not be powered On. | Critical | System |
| Disabled Secondary VM for {vm.name} | Informational | System |
| Enabled Secondary VM for {vm.name} | Informational | System |
| Started Secondary VM for {vm.name} | Informational | System |
| {vm.name} was shut down on the isolated host {isolatedHost.name} in cluster {computeResource.name} in {datacenter.name}: {shutdownResult.@enum.VmShutdownOnIsolationEvent.Operation} | Informational | System |
| Start a recording session on {vm.name} | Informational | System |
| Start a replay session on {vm.name} | Informational | System |
| {vm.name} on host {host.name} in {datacenter.name} is starting | Informational | System |
| Starting Secondary VM for {vm.name} | Informational | System |
| The static MAC address ({mac}) of {vm.name} conflicts with MAC assigned to {conflictedVm.name} | Critical | System |
| {vm.name} on {host.name} in {datacenter.name} is stopping | Informational | System |
| {vm.name} on {host.name} in {datacenter.name} is suspended | Informational | System |
| {vm.name} on {host.name} in {datacenter.name} is being suspended | Informational | System |
| Starting the Secondary VM {vm.name} timed out within {timeout} ms | Critical | System |
| Unsupported guest OS {guestId} for {vm.name} on {host.name} in {datacenter.name} | Warning | System |
| Virtual hardware upgraded to version {version} | Informational | System |
| Cannot upgrade virtual hardware | Critical | System |
| Upgrading virtual hardware on {vm.name} in {datacenter.name} to version {version} | Informational | System |
| Assigned new BIOS UUID ({uuid}) to {vm.name} on {host.name} in {datacenter.name} | Informational | System |
| Changed BIOS UUID from {oldUuid} to {newUuid} for {vm.name} on {host.name} in {datacenter.name} | Warning | System |
| BIOS ID ({uuid}) of {vm.name} conflicts with that of {conflictedVm.name} | Critical | System |
| New WWNs assigned to {vm.name} | Informational | System |
| WWNs are changed for {vm.name} | Warning | System |
| The WWN ({wwn}) of {vm.name} conflicts with the currently registered WWN | Critical | System |
| {message} | Warning | System |
| Booting from iSCSI failed with an error. See the VMware Knowledge Base for information on configuring iBFT networking. | Warning | System |
| License {licenseKey} added to VirtualCenter | Informational | System |
| License {licenseKey} assigned to asset {entityName} with id {entityId} | Informational | System |
| Failed to download license information from the host {hostname} due to {errorReason.@enum.com.vmware.license.DLFDownloadFailedEvent.DLFDownloadFailedReason} | Warning | System |
| License assignment on the host fails. Reasons: {errorMessage.@enum.com.vmware.license.LicenseAssignError}. | Informational | System |
| Your host license will expire in {remainingDays} days. The host will be disconnected from VC when its license expires. | Warning | System |
| Current license usage ({currentUsage} {costUnitText}) for {edition} exceeded the user-defined threshold ({threshold} {costUnitText}) | Warning | System |
| License {licenseKey} removed from VirtualCenter | Informational | System |
| License unassigned from asset {entityName} with id {entityId} | Informational | System |
| HA completed a failover action in cluster {computeResource.name} in datacenter {datacenter.name} | Informational | System |
| HA initiated a failover action in cluster {computeResource.name} in datacenter {datacenter.name} | Warning | System |
| HA Agent on host {host.name} in cluster {computeResource.name} in datacenter {datacenter.name} is running | Informational | System |
| HA failover host {host.name} in cluster {computeResource.name} in {datacenter.name} has failed | Critical | System |
| All shared datastores failed on the host {hostName} in cluster {computeResource.name} in {datacenter.name} | Critical | System |
| All VM networks failed on the host {hostName} in cluster {computeResource.name} in {datacenter.name} | Critical | System |
| A possible host failure has been detected by HA on host {host.name} in cluster {computeResource.name} in datacenter {datacenter.name} | Critical | System |
| No virtual machine failover will occur until Host Monitoring is enabled in cluster {computeResource.name} in {datacenter.name} | Warning | System |
| HA recovered from a total cluster failure in cluster {computeResource.name} in datacenter {datacenter.name} | Warning | System |
| HA Agent on host {host.name} in cluster {computeResource.name} in datacenter {datacenter.name} is healthy | Informational | System |
| HA agent on {host.name} in cluster {computeResource.name} in {datacenter.name} has an error: {reason.@enum.HostDasErrorEvent.HostDasErrorReason} | Critical | System |
| vCenter Service overall health changed from '{oldState}' to '{newState}' | Informational | System |
| Health of [data.group] changed from [data.oldState] to [data.newState]. | Informational | System |
| Failed to update VM files on datastore {ds.name} using host {hostName} | Critical | System |
| Updated VM files on datastore {ds.name} using host {hostName} | Informational | System |
| Updating VM files on datastore {ds.name} using host {hostName} | Informational | System |
| VMware HA has been disabled in cluster {computeResource.name} of datacenter {datacenter.name}. HA will not restart VM {vm.name} or its Secondary VM after a failure. | Warning | System |
| Network passthrough is active on adapter {deviceLabel} of virtual machine {vm.name} on host {host.name} in {datacenter.name} | Informational | System |
| Network passthrough is inactive on adapter {deviceLabel} of virtual machine {vm.name} on host {host.name} in {datacenter.name} | Informational | System |
| HA VM Component Protection protects virtual machine {vm.name} on {host.name} in cluster {computeResource.name} in datacenter {datacenter.name} as non-FT virtual machine because the FT state is disabled | Informational | System |
| FT Primary VM {vm.name} on host {host.name} in cluster {computeResource.name} in datacenter {datacenter.name} is going to fail over to Secondary VM due to component failure | Informational | System |
| FT virtual machine {vm.name} on host {host.name} in cluster {computeResource.name} in datacenter {datacenter.name} failed to failover to secondary | Critical | System |
| HA VM Component Protection is restarting FT secondary virtual machine {vm.name} on host {host.name} in cluster {computeResource.name} in datacenter {datacenter.name} due to component failure | Informational | System |
| FT Secondary VM {vm.name} on host {host.name} in cluster {computeResource.name} in datacenter {datacenter.name} failed to restart | Critical | System |
| HA VM Component Protection protects virtual machine {vm.name} on host {host.name} in cluster {computeResource.name} in datacenter {datacenter.name} as non-FT virtual machine because it has been in the needSecondary state too long | Informational | System |
| VM Component Protection test ends on host {host.name} in cluster {computeResource.name} in datacenter {datacenter.name} | Informational | System |
| VM Component Protection test starts on host {host.name} in cluster {computeResource.name} in datacenter {datacenter.name} | Informational | System |
| HA VM Component Protection did not take action on virtual machine {vm.name} on host {host.name} in cluster {computeResource.name} in datacenter {datacenter.name} due to the feature configuration setting | Informational | System |
| Virtual machine {vm.name} on host {host.name} in cluster {computeResource.name} in datacenter {datacenter.name} lost access to {datastore} | Critical | System |
| Virtual machine {vm.name} on host {host.name} in cluster {computeResource.name} in datacenter {datacenter.name} lost access to {network} | Critical | System |
| HA VM Component Protection could not power off virtual machine {vm.name} on host {host.name} in cluster {computeResource.name} in datacenter {datacenter.name} successfully after trying {numTimes} times and will keep trying | Critical | System |
| HA VM Component Protection is restarting virtual machine {vm.name} due to component failure on host {host.name} in cluster {computeResource.name} in datacenter {datacenter.name} | Informational | System |
| Virtual machine {vm.name} affected by component failure on host {host.name} in cluster {computeResource.name} in datacenter {datacenter.name} failed to restart | Critical | System |
| HA VM Component Protection could not find a destination host for virtual machine {vm.name} on host {host.name} in cluster {computeResource.name} in datacenter {datacenter.name} after waiting {numSecWait} seconds and will keep trying | Critical | System |
| Application monitoring is not supported on {host.name} in cluster {computeResource.name} in {datacenter.name} | Warning | System |
| Application heartbeat status changed to {status} for {vm.name} on {host.name} in cluster {computeResource.name} in {datacenter.name} | Warning | System |
| Application heartbeat failed for {vm.name} on {host.name} in cluster {computeResource.name} in {datacenter.name} | Warning | System |
| Network connectivity restored on virtual switch {1}, portgroups: {2}. Physical NIC {3} is up. | Informational | System |
| Network connectivity restored on DVPorts: {1}. Physical NIC {2} is up. | Informational | System |
| Uplink redundancy restored on DVPorts: {1}. Physical NIC {2} is up. | Informational | System |
| Uplink redundancy restored on virtual switch {1}, portgroups: {2}. Physical NIC {3} is up. | Informational | System |
| Physical NIC {1} linkstate is up. | Informational | System |
| Connectivity to storage device {1} (Datastores: {2}) restored. Path {3} is active again. | Informational | System |
| Path redundancy to storage device {1} (Datastores: {2}) restored. Path {3} is active again. | Informational | System |
| A corrected memory error occurred in last boot. The following details were reported. Physical Addr: {1}, Physical Addr Mask: {2}, Node: {3}, Card: {4}, Module: {5}, Bank: {6}, Device: {7}, Row: {8}, Column: {9} Error type: {10} | Critical | System |
| A fatal memory error occurred in the last boot. The following details were reported. Physical Addr: {1}, Physical Addr Mask: {2}, Node: {3}, Card: {4}, Module: {5}, Bank: {6}, Device: {7}, Row: {8}, Column: {9} Error type: {10} | Critical | System |
| A recoverable memory error occurred in last boot. The following details were reported. Physical Addr: {1}, Physical Addr Mask: {2}, Node: {3}, Card: {4}, Module: {5}, Bank: {6}, Device: {7}, Row: {8}, Column: {9} Error type: {10} | Critical | System |
| A corrected PCIe error occurred in last boot. The following details were reported. Port Type: {1}, Device: {2}, Bus #: {3}, Function: {4}, Slot: {5}, Device Vendor: {6}, Version: {7}, Command Register: {8}, Status Register: {9}. | Critical | System |
| Platform encounterd a fatal PCIe error in last boot. The following details were reported. Port Type: {1}, Device: {2}, Bus #: {3}, Function: {4}, Slot: {5}, Device Vendor: {6}, Version: {7}, Command Register: {8}, Status Register: {9}. | Critical | System |
| A recoverable PCIe error occurred in last boot. The following details were reported. Port Type: {1}, Device: {2}, Bus #: {3}, Function: {4}, Slot: {5}, Device Vendor: {6}, Version: {7}, Command Register: {8}, Status Register: {9}. | Critical | System |
| An external I/O activity is detected on datastore {1}, this is an unsupported configuration. Consult the Resource Management Guide or follow the Ask VMware link for more information. | Informational | System |
| Lost network connectivity on virtual switch {1}. Physical NIC {2} is down. Affected portgroups:{3}. | Critical | System |
| Lost network connectivity on DVPorts: {1}. Physical NIC {2} is down. | Critical | System |
| Uplink redundancy degraded on DVPorts: {1}. Physical NIC {2} is down. | Warning | System |
| Lost uplink redundancy on DVPorts: {1}. Physical NIC {2} is down. | Warning | System |
| Guest-initiated IPv6 TCP Segmentation Offload (TSO) packets ignored. Manually disable TSO inside the guest operating system in virtual machine {1}, or use a different virtual adapter. | Critical | System |
| The ESX advanced configuration option /Migrate/Vmknic is set to an invalid vmknic: {1}. /Migrate/Vmknic specifies a vmknic that vMotion binds to for improved performance. Update the configuration option with a valid vmknic. Alternatively, if you do not want vMotion to bind to a specific vmknic, remove the invalid vmknic and leave the option blank. | Warning | System |
| Virtual NIC with hardware address {1} failed to connect to distributed virtual port {2} on switch {3}. There are no more ports available on the host proxy switch. | Warning | System |
| Uplink redundancy degraded on virtual switch {1}. Physical NIC {2} is down. Affected portgroups:{3}. | Warning | System |
| Lost uplink redundancy on virtual switch {1}. Physical NIC {2} is down. Affected portgroups:{3}. | Warning | System |
| VMkernel failed to set the MTU value {1} on the uplink {2}. | Warning | System |
| A duplicate IP address was detected for {1} on the interface {2}. The current owner is {3}. | Warning | System |
| Physical NIC {1} linkstate is down. | Informational | System |
| Uplink {1} has recovered from a transient failure due to watchdog timeout | Informational | System |
| The maximum number of supported devices of {1} has been reached. A device from plugin {2} could not be created. | Critical | System |
| Space utilization on thin-provisioned device {1} exceeded configured threshold. Affected datastores (if any): {2}. | Warning | System |
| The maximum number of supported paths of {1} has been reached. Path {2} could not be added. | Critical | System |
| Frequent PowerOn Reset Unit Attentions are occurring on device {1}. This might indicate a storage problem. Affected datastores: {2} | Warning | System |
| Lost connectivity to storage device {1}. Path {2} is down. Affected datastores: {3}. | Critical | System |
| Frequent PowerOn Reset Unit Attentions are occurring on path {1}. This might indicate a storage problem. Affected device: {2}. Affected datastores: {3} | Warning | System |
| Frequent path state changes are occurring for path {1}. This might indicate a storage problem. Affected device: {2}. Affected datastores: {3} | Warning | System |
| Path redundancy to storage device {1} degraded. Path {2} is down. Affected datastores: {3}. | Warning | System |
| Lost path redundancy to storage device {1}. Path {2} is down. Affected datastores: {3}. | Warning | System |
| Successfully restored access to volume {1} ({2}) following connectivity issues. | Informational | System |
| Lost access to volume {1} ({2}) due to connectivity issues. Recovery attempt is in progress and outcome will be reported shortly. | Informational | System |
| Lost connectivity to volume {1} ({2}) and subsequent recovery attempts have failed. | Critical | System |
| No space for journal on volume {1} ({2}). Opening volume in read-only metadata mode with limited write support. | Critical | System |
| At least one corrupt on-disk lock was detected on volume {1} ({2}). Other regions of the volume might be damaged too. | Critical | System |
| Failed to mount to the server {1} mount point {2}. {3} | Critical | System |
| Failed to mount to the server {1} mount point {2}. {3} | Critical | System |
| Lost connection to server {1} mount point {2} mounted as {3} ({4}). | Critical | System |
| Restored connection to server {1} mount point {2} mounted as {3} ({4}). | Informational | System |
| At least one corrupt resource metadata region was detected on volume {1} ({2}). Other regions of the volume might be damaged too. | Critical | System |
| Volume on device {1} locked, possibly because remote host {2} encountered an error during a volume operation and could not recover. | Critical | System |
| License downgrade: {licenseKey} removes the following features: {lostFeatures} | Warning | System |
| Lost network connectivity on virtual switch {1}. Physical NIC {2} is down. Affected portgroups:{3}. | Critical | System |
| Guest-initiated IPv6 TCP Segmentation Offload (TSO) packets ignored. Manually disable TSO inside the guest operating system in virtual machine {1}, or use a different virtual adapter. | Critical | System |
| The ESX advanced config option /Migrate/Vmknic is set to an invalid vmknic: {1}. /Migrate/Vmknic specifies a vmknic that vMotion binds to for improved performance. Please update the config option with a valid vmknic or, if you do not want vMotion to bind to a specific vmknic, remove the invalid vmknic and leave the option blank. | Warning | System |
| Virtual NIC with hardware address {1} failed to connect to distributed virtual port {2} on switch {3}. There are no more ports available on the host proxy switch. | Warning | System |
| Uplink redundancy degraded on virtual switch {1}. Physical NIC {2} is down. {3} uplinks still up. Affected portgroups:{4}. | Warning | System |
| Lost uplink redundancy on virtual switch {1}. Physical NIC {2} is down. Affected portgroups:{3}. | Warning | System |
| Space utilization on thin-provisioned device {1} exceeded configured threshold. | Warning | System |
| Lost connectivity to storage device {1}. Path {2} is down. Affected datastores: {3}. | Critical | System |
| Path redundancy to storage device {1} degraded. Path {2} is down. {3} remaining active paths. Affected datastores: {4}. | Warning | System |
| Lost path redundancy to storage device {1}. Path {2} is down. Affected datastores: {3}. | Warning | System |
| Successfully restored access to volume {1} ({2}) following connectivity issues. | Informational | System |
| Lost access to volume {1} ({2}) due to connectivity issues. Recovery attempt is in progress and outcome will be reported shortly. | Informational | System |
| Lost connectivity to volume {1} ({2}) and subsequent recovery attempts have failed. | Critical | System |
| No space for journal on volume {1} ({2}). Opening volume in read-only metadata mode with limited write support. | Critical | System |
| At least one corrupt on-disk lock was detected on volume {1} ({2}). Other regions of the volume may be damaged too. | Critical | System |
| Lost connection to server {1} mount point {2} mounted as {3} ({4}). | Critical | System |
| Restored connection to server {1} mount point {2} mounted as {3} ({4}). | Informational | System |
| At least one corrupt resource metadata region was detected on volume {1} ({2}). Other regions of the volume might be damaged too. | Critical | System |
| Volume on device {1} locked, possibly because remote host {2} encountered an error during a volume operation and could not recover. | Critical | System |
Manual execution
Manual execution
./pandora_vmware <conf_path>
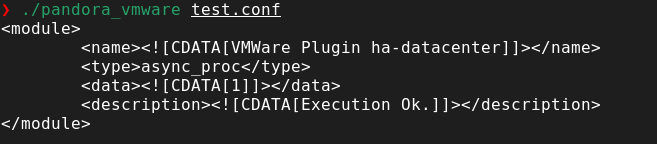
Generate encrypted password
./pandora_vmware <conf_path> --generate_password
Remember that the password must be specified in the "password" section of the configuration file.
Discovery
This plugin can be integrated with Pandora FMS Discovery.
To do so, you must load the ".disco" package that you can download from the Pandora FMS library:
https://pandorafms.com/library/
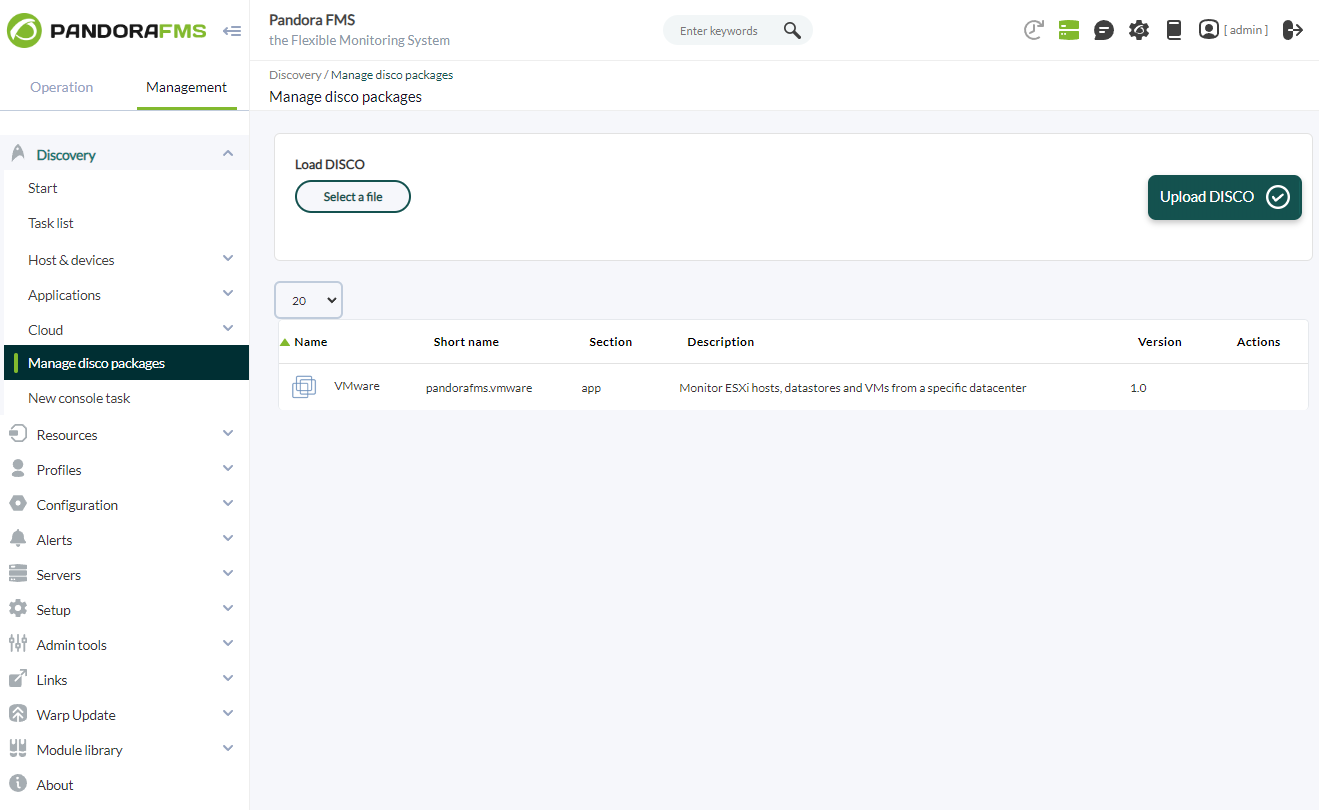
Once loaded, VMware environments can be monitored by creating Discovery tasks from the Management > Discovery > Applications section.
The following minimum data will be requested for each task:
- V-Center IP: IP address of the V-Center to monitor.
- Datacenter name: Name of the datacenter to monitor in the indicated V-Center.
- Datacenter user: V-Center connection user.
- Password: Password of the indicated user.
- Encrypt passwords: If enabled, the indicated password will be encrypted for the executions, thus masking it.
- Tentacle IP: IP of the Tentacle server to which the agents' data will be sent. Normally this parameter will not be modified.
- Tentacle port: Tentacle server port to send the data to. Normally this parameter will not be modified.
- Tentacle extra options: Additional options for sending data through the Tentacle client. Normally this parameter will not be modified.
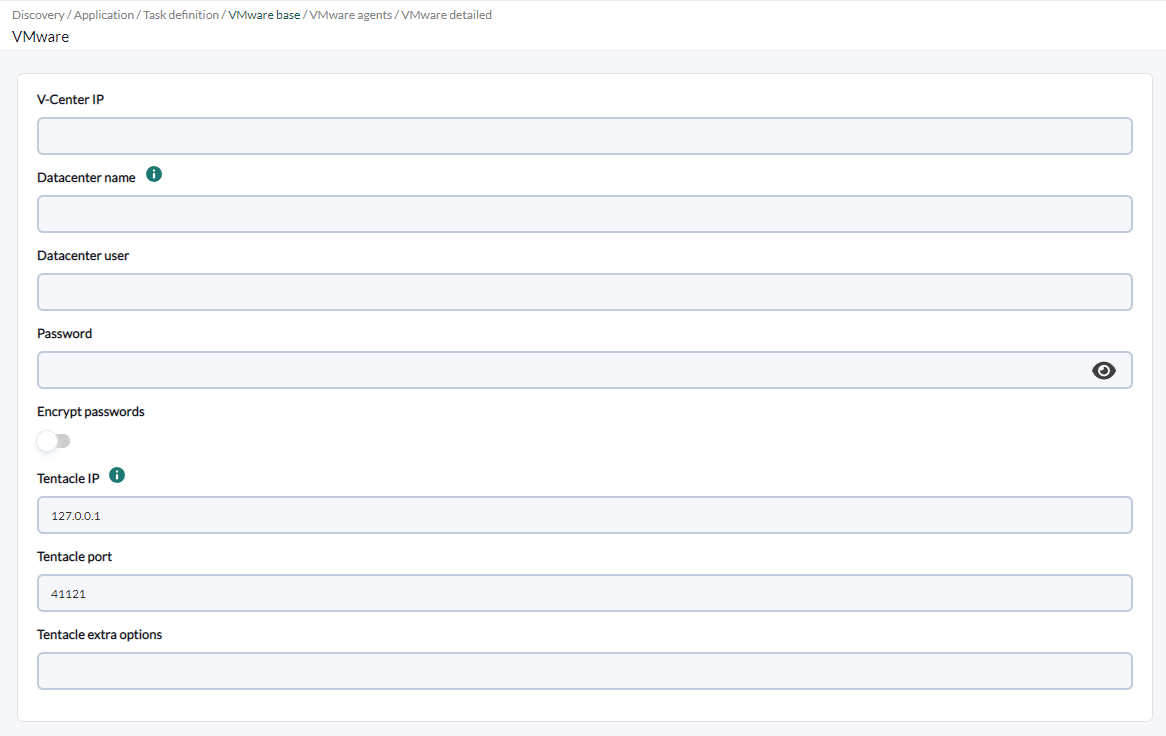
If the connection data provided is correct and the Pandora FMS server is able to connect, you will be able to see a tree with the ESX, datastores and VMs of the environment. In this tree you could, if you want, indicate specific agents to be monitored by the task. If you do not activate the exclusive agent monitoring, the task will by default scan the environment in each execution looking for new agents (this can be adjusted in the next configuration step).
- Monitor exclusive agents: If enabled, the task will monitor exclusively the elements of the selected tree, instead of performing the agent scan it would normally do. This option takes precedence over the scanning options in subsequent steps.
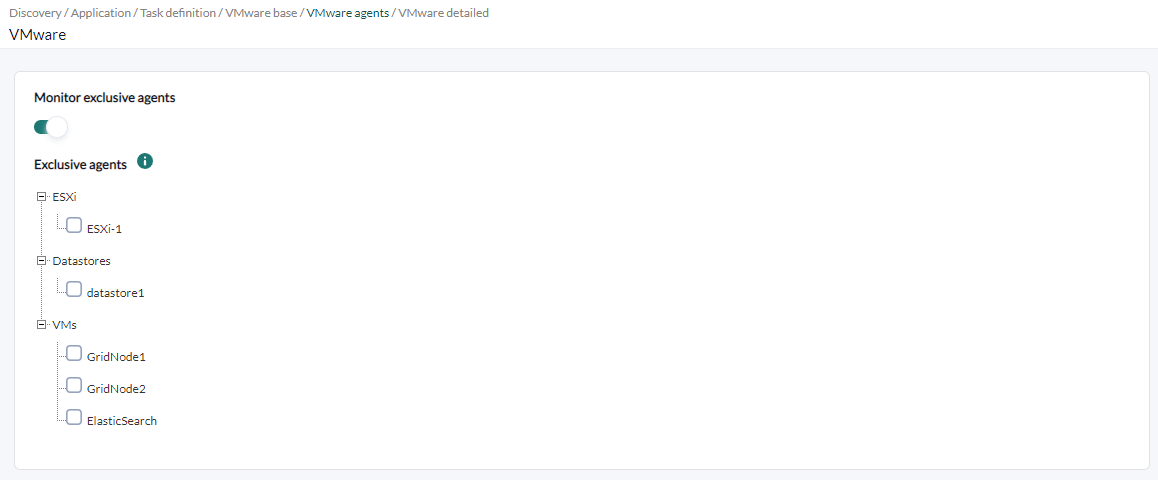
It is also possible to adjust the task configuration to customize the desired monitoring:
- Max threads: To optimize the execution time, multiple threads can be configured to monitor the task agents. Keep in mind that configuring multiple threads may increase the CPU usage of the task.
- Re-scan interval: Search interval for new agents in the VMware environment. This parameter only takes effect if agent-only monitoring is disabled. It should not be confused with the task execution interval.
- Retry send: When enabled, the sending of XML files by Tentacle is reattempted in case of failure.
- Event mode: When it is activated, the V-Center event monitoring is performed. This makes the VMware events to be shown in the Pandora FMS event console, entering in its normal operation flow. It is necessary to configure the console API in the server configuration file for this mode to work.
- Virtual network monitoring:When it is activated, agents will be generated for the virtual switches of the VMware environment.
- Scan datastores: When enabled, agents will be generated for each datastore found in the environment. This parameter only has effect if the exclusive monitoring of agents is disabled.
- Scan datacenters: When enabled, an agent will be generated for the datacenter indicated in the task.
- Scan ESXs: When enabled, agents will be generated for each ESX found in the environment. This parameter only has effect if the exclusive monitoring of agents is disabled.
- Scan VMs: When enabled, agents will be generated for each VM found in the environment. This parameter only has effect if the exclusive monitoring of agents is disabled.
- Extra settings: Optional additional configuration block. Here you can include all the plugin configuration parameters you want, such as the Rename block.
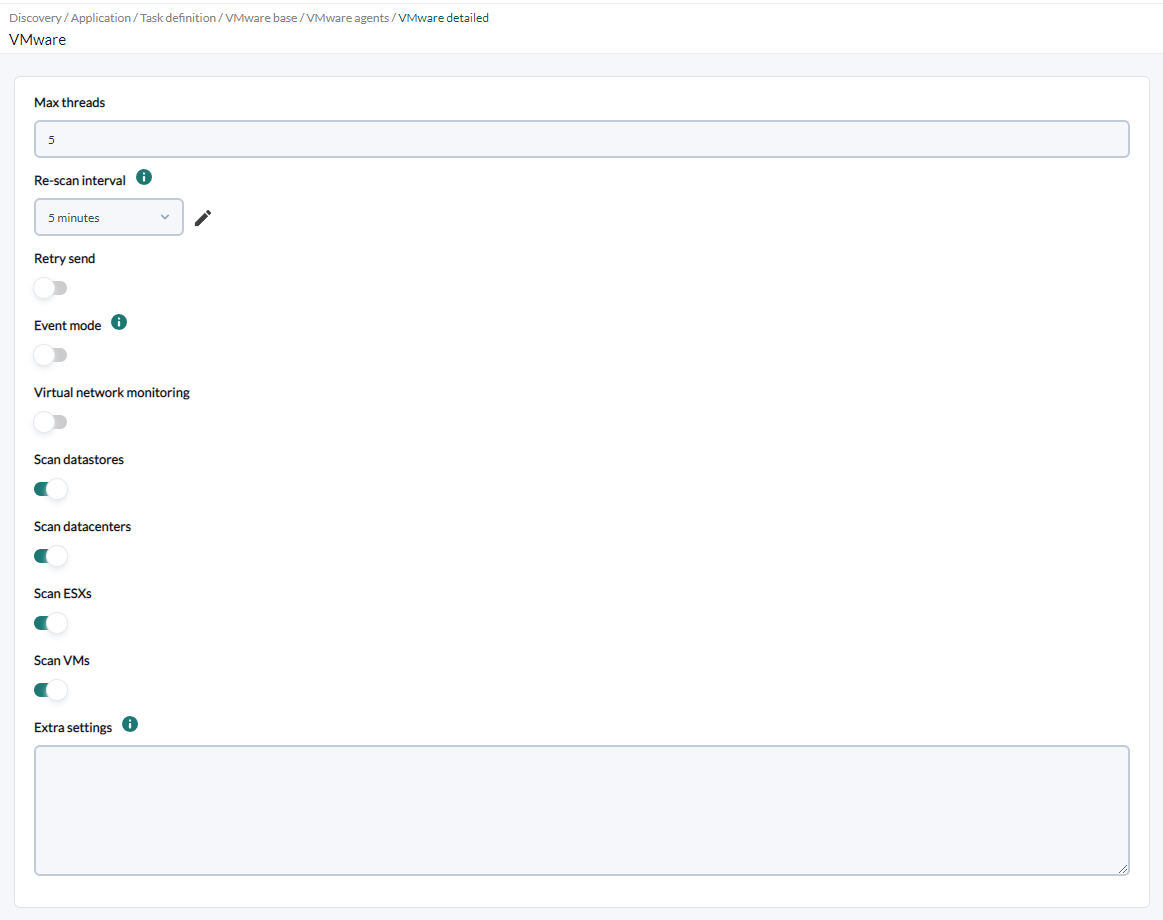
Tasks that are successfully completed will have an execution summary with the following information:
- Datacenter: Name of the datacenter monitored in the execution.
- ESXs: Number of ESXs monitored by the task.
- Datastores: Number of datastores monitored by the task.
- Vms: Number of VMs monitored by the task.
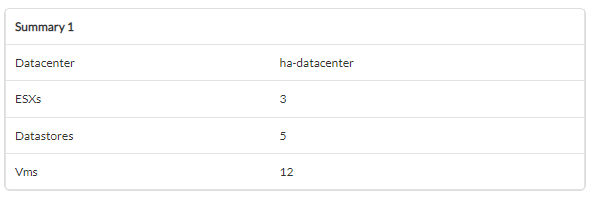
Tasks that are not completed successfully will have an execution summary recording the errors that occurred.
Agents generated by the plugin
The execution of this plugin will create several agents, depending on the configuration that has been implemented in the configuration file. In total the plugin can create the following agent types with the following modules:
Datacenter
An agent will be created for the datacenter specified in the configuration file, with the following modules
| Module | Name | Description | API version | Disponibility |
| Ping | ping | ping to the machine that supports vCenter | All | Anytime |
| Check 443 port | check443 | Check to port 443 of the machine that supports vCenter | All | Anytime |
Datastores
An agent will be created for each datastore to be monitored, according to the specified configuration, with the following modules
| Module | Name | Description | Versión API | Disponibility |
|---|---|---|---|---|
| Capacity | capacity | Maximum Datastore capacity in bytes | All | Anytime |
| Free Space | freeSpace | Percentage of free space in the Datastore | All | Anytime |
| Disk Overallocation | overallocation | Percentage of disk over-allocation | ≥v4.0 | Anytime |
| Free Space Bytes | freeSpaceBytes | Amount of free space in bytes | All | Anytime |
| ESX-DS Paths Status | dsPathStatus | Datastore is accessible for all the configured ESXs | All |
Anytime |
ESX
An agent will be created for each ESXI host to be monitored, according to the specific configuration.
| Module | Name | Description | API version | Disponibility |
|---|---|---|---|---|
| Boot Time | bootTime | Last date on which the host was turned on | All | Anytime |
| CPU Info [x] | cpuInfo | CPU overview (one module is created per ESXi CPU) | All | If connected |
| Memory Size | memorySize | Total amount of host physical memory in Bytes | All | If connected |
| Overall CPU Usage | overallCpuUsage | Sum of all CPUs usage in Mhz | All | If connected |
| Overall Memory Usage | overallMemoryUsage | Overall Memory Usage of VMware Hosts | All | If connected |
| Power State | powerState | Host power status | ≥v2.5 | Anytime |
| SSL Thumbprint | sslThumbprint | Host SSL fingerprint | ≥v4.0 | If configured |
| Uptime | uptime | Host Uptime in seconds | ≥v4.1 | If connected |
| VNIC Info [x] | vnicInfo | Information on host virtual network interfaces | All | If configured and connected |
| Host Alive | hostAlive | Module that is worth 1 if the ESX is connected and 0 otherwise | All | Anytime |
| Connection State | connectionState | Host connection status | All | Anytime |
| Disk Read | diskRead | Kbps rate read from disk | All | Nivel stats ≥2 |
| Disk Write | diskWrite | Disk written Kbps rate | All | Nivel stats ≥2 |
| Disk Read Latency | diskReadLatency | Disk read latency in milliseconds | All | Nivel stats ≥2 |
| Disk Write Latency | diskWriteLatency | Disk write latency in milliseconds | All | Nivel stats ≥2 |
| Data received | netReceived | Kbps rate received from host | All | Nivel stats ≥2 |
| Data transmitted | netTransmitted | Rate of Kbps sent from host | All | Nivel stats ≥2 |
| Packages Received | netPkgRx | Number of packets received in the interval | All | Nivel stats ≥2 |
| Packages Transmitted | netPkgTx | Number of packets sent in the interval | All | Nivel stats ≥2 |
| CPU Usage | cpuUsagePercent | Percentage of CPU usage | All | Nivel stats ≥2 |
| Memory Usage | memoryUsagePercent | Percentage of RAM usage | All | Nivel stats ≥2 |
| Net Usage | netUsage | Network data received and sent from all NICs | All | Nivel stats ≥2 |
| Disk Rate | diskRate | Assaulted I/O rate in KB/sec | All | Nivel stats ≥2 |
| Max. Disk Latency | maxDiskLatency | Maximum latency of all disks | All | Nivel stats ≥2 |
| < Path name > | pathStatus | Path state | All | Nivel stats ≥2 |
| HA Status | haStatus | Host HA status | ≥v5.0 | If configured |
| Sensor* | systemHealthInfo | Status of hardware sensors (one module per sensor) | All | ESXi >= 3.5 |
VM
An agent will be created for each virtual machine to be monitored, according to the specific configuration.
| Módulo | Nombre corto | Descripción | Versión API | Disponibilidad |
|---|---|---|---|---|
| Boot Time | bootTime | Last date on which the virtual machine was powered on | All | If connected |
| Connection State | connectionState | Connection status | All | Anytime |
| Consumed Overhead Memory | consumedOverheadMemory | Amount of memory consumed by the virtual machine in MB | ≥v4.0 | if configured |
| CPU Allocation | cpuAllocation | Information on the resources allocated to the virtual machine's CPU | All | if configured |
| Disk Free [x] | diskFree | Free percentage of the virtual machine's disk (there will be one module for each disk contained in the virtual machine). | All | if configured |
| Guest State | guestState | Operating mode of the host operating system | All | if configured |
| Host Info | host | VMware host information | All | if configured |
| Host Alive | hostAlive | Module that is worth 1 if the virtual machine is running and 0 otherwise | All | Anytime |
| Host Memory Usage | hostMemoryUsage | Memory consumed by the virtual machine in MB | All | if connected |
| Host Name | hostName | Name of associated host | All | if configured |
| IP Address [x] | ipAddress | IP address of the machine (one will be displayed per available network interface) | ≥v4.1 | if configured |
| MAC Address [x] | macAddress | MAC address of the machine (one will be displayed per available network interface) | All | if configured |
| Max CPU Usage | maxCpuUsage | Upper limit of virtual machine CPU utilization | All | If connected |
| Max Memory Usage | maxMemoryUsage | Upper limit of virtual machine RAM memory usage | All | If connected |
| Memory Allocation | memoryAllocation | Limit of memory resources | All | if configured |
| Memory Overhead | memoryOverhead | Amount of memory used by the virtual machine over and above the needs of the host operating system in bytes. | All | if configured |
| Overall CPU Demand | overallCpuDemand | Basic statistics on CPU performance in Mhz | ≥v4.0 | If connected |
| Overall CPU Usage | overallCpuUsage | Basic statistics on CPU utilization in Mhz | All | If connected |
| Power State | powerState | Current virtual machine status | All | Anytime |
| Private Memory | privateMemory | Amount of memory in MB that is given to the virtual machine from the unshared memory | ≥v4.0 | If connected |
| Shared Memory | sharedMemory | Amount of memory in MB given to the virtual machine of the shared memory | ≥v4.0 | If connected |
| Tools Running Status | toolsRunningStatus | Current running status of VMware Tools installed on the guest operating system | ≥v4.0 | if configured |
| Trigger Alarm State | triggeredAlarmState | VMware alarm status | ≥v4.0 | if configured |
| Uptime Seconds | uptimeSeconds | Virtual machine uptime in seconds | ≥v4.1 | If connected |
| Virtual Image Path | virtualImagePath | Virtual machine configuration file path (.vmx) | All | Anytime |
| Disk Read | diskRead | Kbps rate read from disk | All | Nivel stats ≥2 |
| Disk Write | diskWrite | Disk written Kbps rate | All | Nivel stats ≥2 |
| Disk Read Latency | diskReadLatency | Disk read latency in milliseconds | All | Nivel stats ≥2 |
| Disk Write Latency | diskWriteLatency | Disk write latency in milliseconds | All | Nivel stats ≥2 |
| Data received | netReceived | Kbps rate received from host | All | Nivel stats ≥2 |
| Data transmitted | netTransmitted | Rate of Kbps sent from host | All | Nivel stats ≥2 |
| Packages Received | netPkgRx | Number of packets received in the interval | All | Nivel stats ≥2 |
| Packages Transmitted | netPkgTx | Number of packets sent in the interval | All | Nivel stats ≥2 |
| CPU Usage | cpuUsagePercent | Percentage of CPU usage | All | Nivel stats ≥2 |
| Memory Usage | memoryUsagePercent | Percentage of RAM usage | All | Nivel stats ≥2 |
| Net Usage | netUsage | Network data received and sent from all NICs | All | Nivel stats ≥2 |
| Disk Rate | diskRate | Assaulted I/O rate in KB/sec | All | Nivel stats ≥2 |
| Max. Disk Latency | maxDiskLatency | Maximum latency of all disks | All | Nivel stats ≥2 |
| HeartBeat | heartbeat | Number of heartbeats of the virtual machine | All | Nivel stats ≥2 |
| CPU Ready | cpuReady | Percentage of time machine is ready, but not queued to run on the physical CPU | All | Nivel stats ≥2 |
| Number Snapshots | snapshotCounter | Número de snapshots para la máquina virtual (este Módulo puede afectar al rendimiento de la monitorización, por ello se recomienda ejecutarlo con un valor de intervalo alto, por ejemplo cada hora). | All | Nivel stats ≥2 |
| Date Snapshots | snapshotDate | Name and date of snapshots from a virtual machine | All | if configured |
| HA Status | haStatus | HA status for the virtual machine | ≥v5.0 | if configured |
Switches
If switch monitoring is enabled with the "virtual_network_monitoring" option in the configuration file, an agent will be created for each switch with the following modules:
| <nombre_switch>_ifOperStatus | indicates the operational status of a physical or virtual network interface |
| <nombre_switch>_overallStatus | indicates the general status of the switch in terms of availability and health |
| <nombre_switch>_connectedVMs | displays the number of virtual machines that are connected |