SQLServer
This document describes the SQL Server functionality of PandoraFMS discovery.
- Introduction
- Prerrequisites
- Parameters and configuration
- Manual execution
- Discovery
- Agents y modules generated by the plugin
Introduction
This plugin is designed to monitor SQL Server databases by executing queries that extract information crucial for assessing the performance and status of the databases. This information includes metrics such as the number of connections, query counts, and restart status. These data points will be reflected in PandoraFMS through modules that provide statistical value within an agent representing each database.
It's important to note that this plugin is specifically developed for use with Pandora FMS Discovery. Unlike other plugins, it doesn't generate agents through XML; instead, all the discovered information is returned in the JSON output of the plugin.
Prerrequisites
This plugin establishes remote connections to the databases it monitors, so it's essential to ensure connectivity between the Pandora FMS server and these databases.
In turn the following permissions are required for the user that is used to connect.
VIEW SERVER STATE:
To execute the SELECT @@VERSION query.
To query sys.dm_os_sys_info (server uptime).
To query sys.dm_exec_requests (active requests on the server).
To query @@MAX_CONNECTIONS (maximum connections allowed).
To run sp_who 'ACTIVE' (active sessions on the server).
SELECT:
To execute custom queries on specific database tables or views.
Parameters and configuration
Parameters
| --conf | Path to the configuration file. |
| --target_databases | Path to the configuration file containing database targets. |
| --target_agents | Path to the configuration file containing agent targets. |
| --custom_queries | Path to the configuration file containing custom queries. |
The configuration file (--conf)
agents_group_id= The ID of the group where agents will be created.
interval= The monitoring interval for agents in seconds.
user= The connection user.
password= The password for the user.
threads= The number of threads used for agent creation.
modules_prefix= The prefix for module names.
execute_custom_queries= Activate with 1 to enable the use of custom queries.
analyze_connections= Activate with 1 to enable connection monitoring.
engine_uptime= Activate with 1 to enable runtime monitoring.
query_stats= Activate with 1 to enable query statistics monitoring.

monitor_long_queries = Activate with 1 to enable query statistics long queries.
monitor_latch_requests = Activate with 1 to enable query statistics latch requests.
monitor_full_scans = Activate with 1 to enable query statistics full scans.
count_databases = Activate with 1 to enable databases count.
retrieve_memory_statistics = Activate with 1 to enable memory statistics.
retrieve_locks_statistics = Activate with 1 to enable locks statistics.
check_engine_performance = Activate with 1 to enable engine performance.
retrieve_buffer_statistics = Activate with 1 to enable buffer statistics.
retrieve_users_information = Activate with 1 to enable user information.
retrieve_cluster_state = Activate with 1 to retrieve cluster state.
retrieve_logs_statistics = Activate with 1 to enable logs statistics.
monitor_active_users = Activate with 1 to enable active users.
retrieve_transactions_statistics = Activate with 1 to transaction statistics.
monitor_filegroups_space = Activate with 1 to enable file groups space.
monitor_user_reserved_space = Activate with 1 to enable user reserved space.

monitor_backups = Activate with 1 to enable to monitor backups.
agent_per_database     = Activate with 1 to enable agents creation.
db_agent_prefix        = prefix to the databases
scan_databases         = Activate with 1 to monitor databases
Example
agents_group_id = 10
interval = 300
user = sa
password = HHgD85V@
threads = 1
modules_prefix =
execute_custom_queries = 1
analyze_connections = 1
engine_uptime = 1
query_stats = 1
monitor_long_queries = 1
monitor_latch_requests = 1
monitor_full_scans = 1
count_databases = 1
retrieve_memory_statistics = 1
retrieve_locks_statistics = 1
check_engine_performance = 1
retrieve_buffer_statistics = 1
retrieve_users_information = 1
retrieve_cluster_state = 1
retrieve_logs_statistics = 1
monitor_active_users = 1
retrieve_transactions_statistics = 1
monitor_filegroups_space = 1
monitor_user_reserved_space = 1

monitor_backups = 1
agent_per_database     = 1
db_agent_prefix        = PANDORA-
scan_databases         = 1
The file content for "--target_databases" should consist of a list of target databases, with each database separated by commas or lines. The format for each database can be any of the following:
ip
ip:puerto
ip\instancia
Example
172.17.0.4:1433\DEVENV
172.17.0.2:1433\PRODENV
The file content for "--target_agents"
should consist of a list of agent names, with each agent separated by commas or lines. These agent names will be used to associate the information from each target database with the corresponding specified agent name, instead of letting the plugin generate agent names automatically.
The position of each agent name in the list should match the position of the target database in its own list. In other words, the name for the first target database should be the first name in this list, considering that blank lines are ignored. This ensures that the information is correctly associated with the desired agents.
Example
agente1,,agente3
agente4
agente5,agente6,agente7,,agente9
Custom queries (--custom_queries)
should be specified as modules that you want to monitor. These modules should follow a specific structure, which is as follows:
check_begin: Module opening tag.
name: Module name.
description: Module description.
operation: Type of operation.
datatype: Module data type.
min_warning: Minimum warning threshold configuration.
max_warning: Maximum warning threshold configuration.
str_warning: Warning string configuration.
warning_inverse: Activate inverse interval with 1 for warning threshold.
min_critical: Minimum critical threshold configuration.
max_critical: Maximum critical threshold configuration.
str_critical: Critical string configuration.
critical_inverse: Activate inverse interval with 1 for critical threshold.
module_interval: This interval is calculated as a multiplier of the agent's interval.
target: Custom query.
target_databases: Database agents for which the module will be created.
check_end: Module closing tag.
Example
check_begin
name Select 1
description Number of invalid objects
operation value
datatype generic_data
min_warning 5
target SELECT 1;
target_databases all
check_end

check_begin
name NumeroConexiones
description Number of connections
operation value
datatype generic_data
min_warning 10
target SELECT COUNT(*) AS NumeroConexiones FROM sys.dm_exec_sessions WHERE is_user_process = 1;
target_databases pandora
check_end

check_begin
name lista_table_size.MB
description table size in MB
operation full
datatype generic_data
target SELECT SUM(reserved_page_count) * 8 / 1024.0 AS TamañoMB FROM sys.dm_db_partition_stats WHERE object_id = OBJECT_ID('lista');
target_databases pandora
check_end
Manual execution
The plugin execution format is as follows:
./pandora_mssql \
--conf < ruta al fichero de configuración > \
--target_databases < ruta al fichero de configuración que contiene las bases de datos objetivo > \
[ --target_agents < ruta al fichero de configuración de agentes > ] \
[ --custom_queries < ruta al fichero de configuración que contiene las consultas personalizas > ]
For example:
./pandora_mssql \
--conf /usr/share/pandora_server/util/plugin/mssql.conf \
--target_databases /usr/share/pandora_server/util/plugin/targets.conf \
--target_agents /usr/share/pandora_server/util/plugin/target_agents.conf \
--custom_queries /usr/share/pandora_server/util/plugin/custom_queries.conf
Discovery
This plugin can be integrated with Pandora FMS Discovery. To do this, you should load the ".disco" package, which you can download from the Pandora FMS library.
https://pandorafms.com/library/
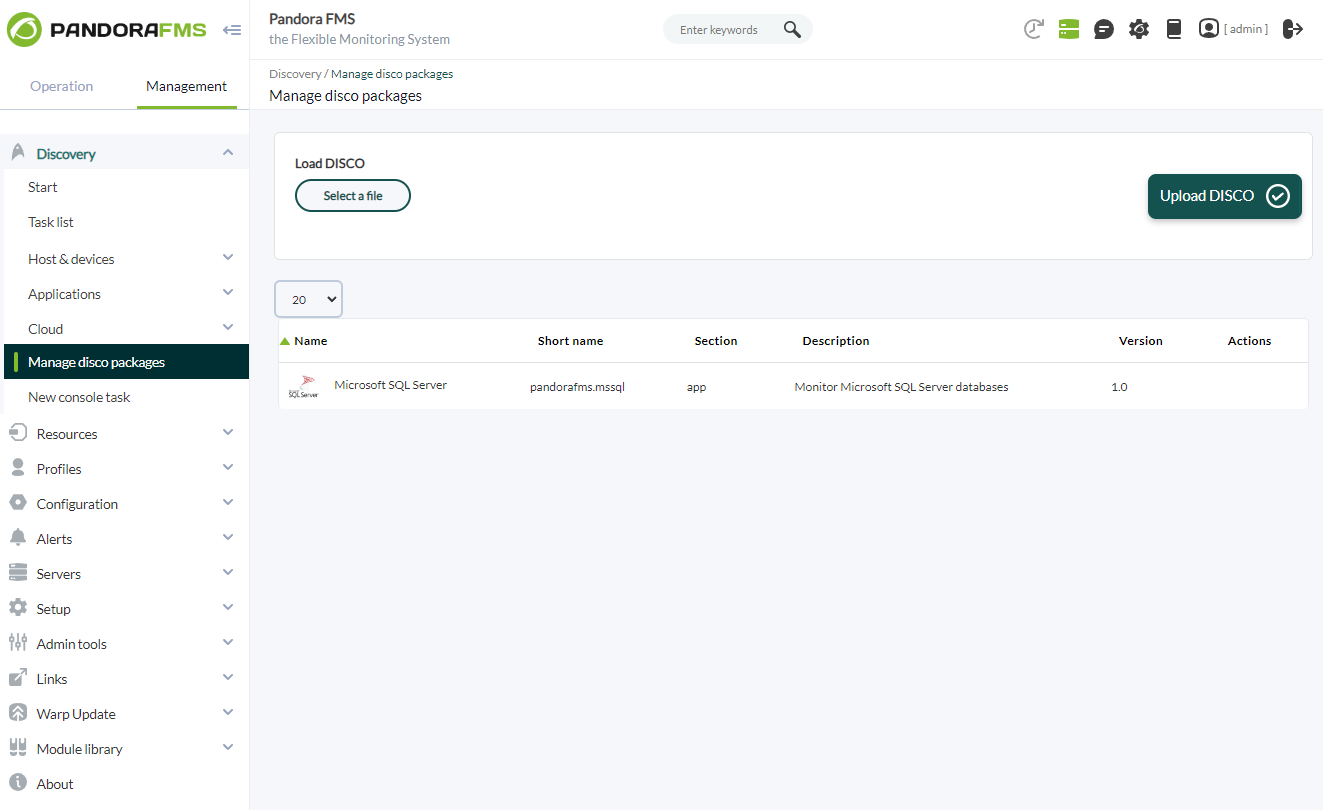
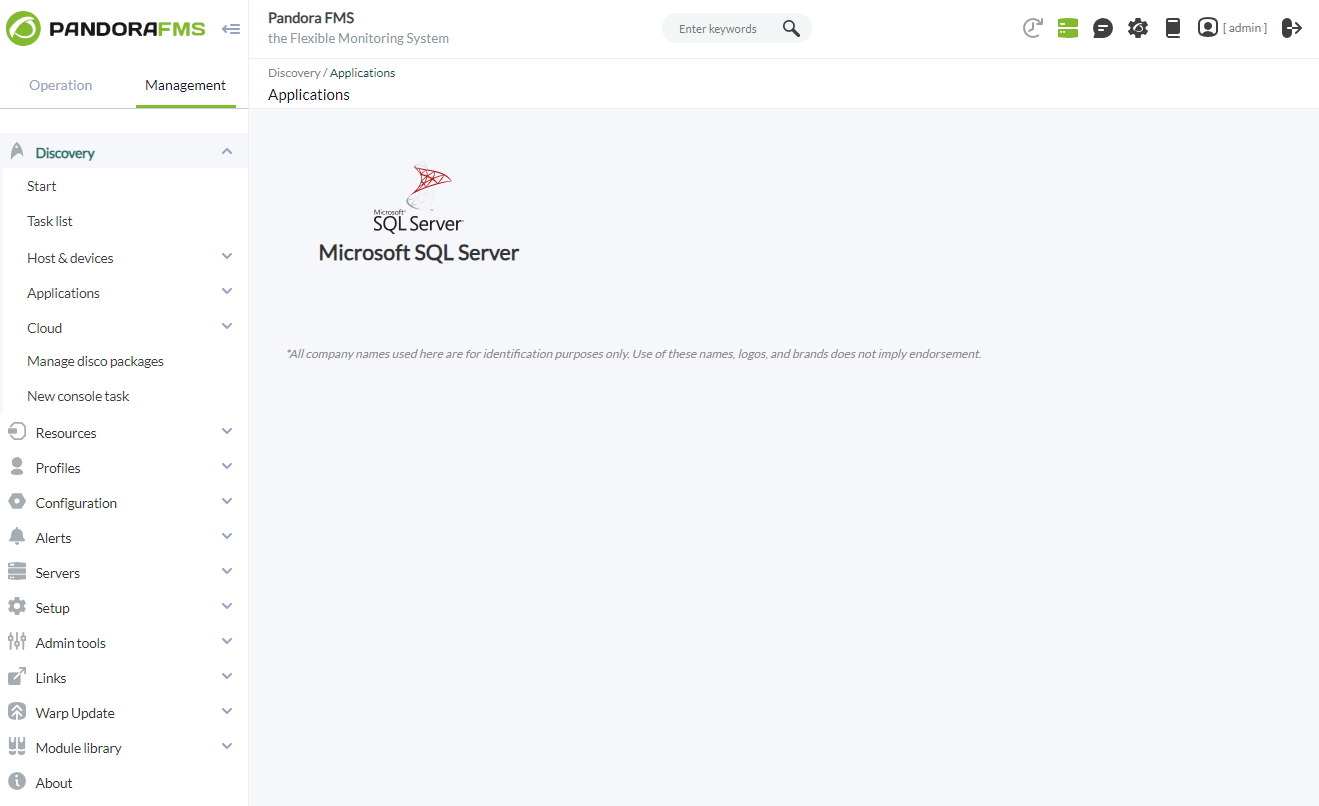
Once loaded, you can monitor Microsoft SQL Server environments by creating Discovery tasks from the Management > Discovery > Applications section.
For each task, the following minimum information will be requested:
- Microsoft SQL Server target string: A list of Microsoft SQL Server targets to be monitored by the task. It will be a comma-separated or newline-separated list. Each target database can be defined in the format IP:PORT\INSTANCE, IP:PORT, IP\INSTANCE, or IP.
- User: The connection user for the target databases.
- Password: The password for the specified user.

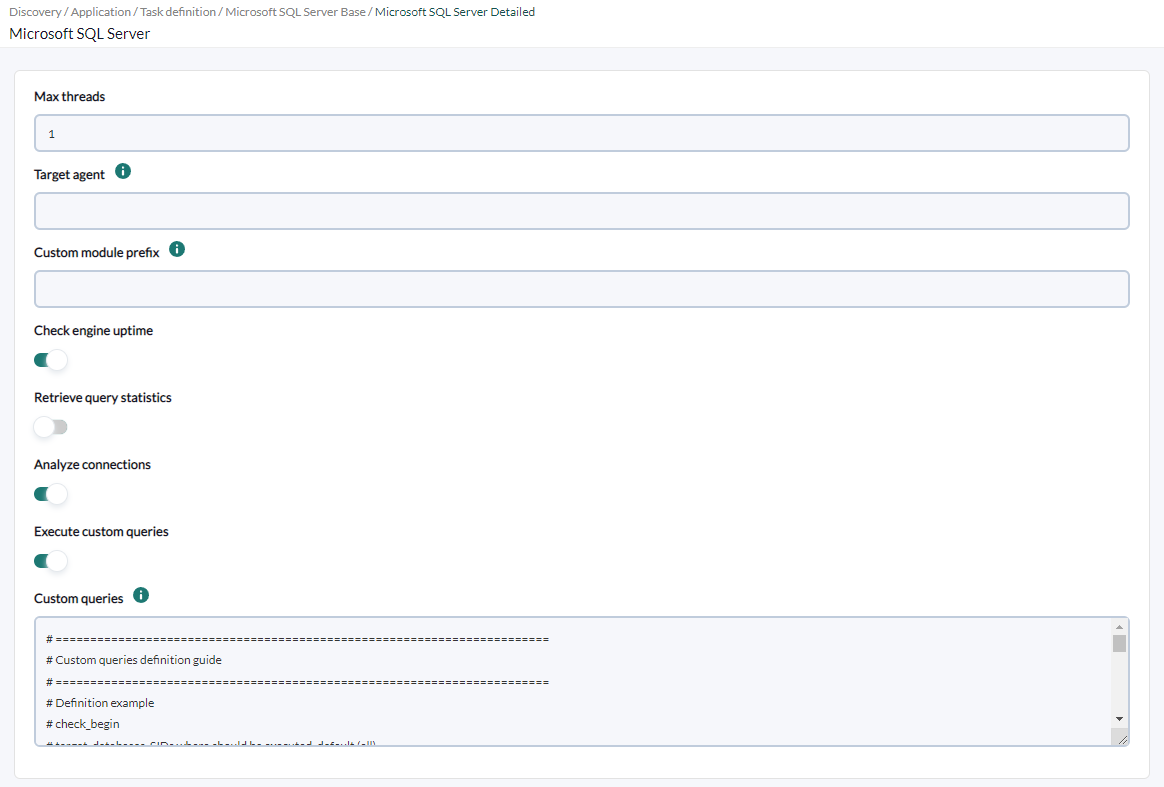
You can also adjust the task configuration to customize the desired monitoring:
- Max threads: To optimize execution time, you can configure multiple threads to monitor the task's agents. Keep in mind that configuring multiple threads may increase the CPU usage of the task.
- Target agent: List of target agents for the Microsoft SQL Server targets to be monitored. These are the names under which agents for each defined target in the task will be generated. It should be a comma-separated or newline-separated list. The position of the names in the list should match the position of the Microsoft SQL Server targets in their list, meaning the first name will be used for the first target, and so on. If the list is separated by lines, blank lines will be ignored. If no agent name is specified for a target, its IP or FQDN will be used as the agent name.
- Custom module prefix: Text included as a prefix for all generated module names. It's useful for locating modules generated by the task or distinguishing them from others.
- Check engine uptime: If activated, it will monitor the uptime of the targets.
- Retrieve query statistics: If activated, it will monitor query statistics.
- Analyze connections: If activated, it will monitor connections.
- Execute custom queries: If activated, it will allow executing custom queries for each Microsoft SQL Server target.
- Custom queries: Configuration block to define the custom queries to be executed. Each query will generate a new module for each agent in the task.
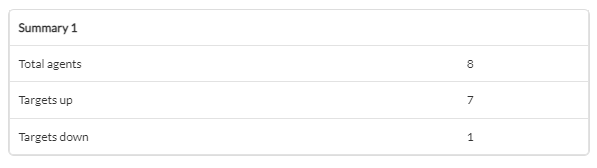
Successfully completed tasks will have an execution summary with the following information:
- Total agents: Total number of agents generated by the task.
- Targets up: Total number of targets successfully connected to.
- Targets down: Total number of targets that could not be connected to.
Tasks that do not complete successfully will have an execution summary that records the errors encountered.
Agents y modules generated by the plugin
The plugin will create one agent for each target database.
Instance metrics
|
server_startup
|
Monitors the uptime (in days) of the database server
|
|
locks_used
|
Monitors percentage of used lock and lock owner blocks |
|
workspace_memory
|
Monitors amount of memory that is used for executing processes such as hash, sort, bulk copy, and index creation operations |
|
average_waittime
|
SQL Server Average Lock Wait Time |
Each agent will contain the following modules if "engine_uptime" is activated:
| restart_detection |
It will be 0 if an unexpected restart is detected, and 1 if this is not the case. When a server restarts unexpectedly, there can be a disruption in database access, and potentially, transactions or data may not be saved correctly, leading to data integrity issues. |
If "query_stats" is activated, each agent will contain the following modules:
| queries | The total number of queries. Monitoring queries is essential for understanding the workload running on the server and assessing the overall system performance. By monitoring the total number of queries, you can identify activity spikes, optimize performance, and detect potential issues such as inefficient or excessive queries. |
| update | The number of UPDATE queries. UPDATE queries are used to modify existing data in the database. Monitoring UPDATE queries is important to assess the frequency and efficiency of data updates. You can identify UPDATE queries that affect a large number of rows or have a significant impact on server performance. This allows you to optimize queries, review table structures, or take measures to reduce the load generated by updates. |
| delete | The number of DELETE queries. DELETE queries are used to remove data from the database. Monitoring DELETE queries is useful to assess the frequency and efficiency of data deletions. You can identify DELETE queries that affect a large number of rows or have a significant impact on server performance. This allows you to optimize queries, review table structures, or take measures to reduce the load generated by deletions. |
| insert | The number of INSERT queries. INSERT queries are used to add new data to the database. Monitoring INSERT queries allows you to assess the frequency and efficiency of data insertions. You can identify INSERT queries that are generating a high load on the server or may be causing performance issues. This enables you to optimize queries, review table structures, or consider strategies like deferred insertion to enhance performance in high-concurrency environments. |
If "analyze_connections" is activated, each agent will contain the following modules:
| session usage | The number of current connections relative to the total maximum connections. Monitoring session usage in SQL Server is important for optimizing performance, identifying locking issues, enhancing security and auditing, and efficiently planning server resources. |
If "retrieve_memory_statistics" is activated, each agent will contain the following modules :
|
lock_memory
|
Monitors amount of allocated lock memory in Bytes |
|
connection_memory
|
Monitors amount of connection memory in Bytes
|
|
optimizer_memory
|
Monitors amount of optimizer memory in Bytes |
|
sqlcache_memory
|
Monitors amount of SQL cache memory in Bytes
|
|
total_memory
|
Monitors total amount of dynamic server memory in Bytes
|
Si esta activado retrieve_locks_statistics:
|
retrieve_locks_statistics
|
Monitors the number of deadlocks per second
|
|
lock_timeouts
|
Monitor the number of lock-timeouts per second
|
|
lock_requests
|
Monitor the number of lock-requests per second |
|
lock_waits
|
Monitor the number of lock-waits per second
|
Si esta activado retrieve_buffer_statistics:
|
buf_cachehit_ratio
|
Percentage of pages found in the buffer cache without having to read from the disk
|
|
free_connections
|
Monitors % free connections to SQL Server instance
|
|
page_reads
|
Monitors the number of database page reads per second
|
|
page_writes
|
Monitors the number of database page writes per second
|
Si esta activado monitor_latch_requests:
|
latch_waits
|
Monitors the number of latch requests per second
|
Si esta activado monitor_full_scans:
|
full_scans
|
Monitors the number of full scans (table or index) per second
|
Si esta activado check_engine_performance:
|
server_cpu
|
Monitors % of CPU usage by SQL Server instance
|
|
io_busy
|
Monitors % of I/O busy for SQL Server instance
|
|
server_io
|
Monitors % of I/O busy for SQL Server instance
|
Si esta activado retrieve_users_information:
|
active_connection_ratio
|
Monitors ratio of active connections to total allowed connections
|
|
locked_users
|
Monitors the number of users suspended by locks |
|
blocked_users
|
Monitors the number of users suspended by locks
|
|
active_users
|
Monitors the number of users currently logged onto the server
|
Si esta activado monitor_long_queries:
|
long_queries
|
Monitors long running queries (in seconds)
|
|
long_queries_string
|
Complete output of long running queries
|
Si esta activado retrieve_cluster_state:
|
aag_cluster_quorum_state
|
State: < desc >. Monitors AlwaysOn WSFC quorum State.
|
|
aag_cluster_members_state
|
State: < desc >. Monitors AlwaysOn WSFC nodes state
|
|
aag_synchronization_health
|
State: <desc >. Monitors the synchronization health of an availability group
|
|
aag_replica_synchronization_health
|
State: < desc >. Role: < role > . Monitors the synchronization health of an availability replica
|
|
aag_replica_connected_state
|
State: < desc >. Role: < rol > .Monitors connected state of an availability replica
|
|
aag_replica_recovery_health
|
State: < desc >. Role: < rol> . Monitors the recovery health of an availability replica
|
|
aag_replica_operational_state
|
State: < state >. Role: < rol >. Monitors the Current operational state of the availability replica
|
|
aag_db_replica_synchronization_state
|
State: < desc >. Monitors the synchronization state of databases on availability replica
|
|
aag_listener_state
|
State: < desc >. Role: < rol >. Monitor the AlwaysOn availability Group Listener state
|
Database metrics
If monitor_active_users is enabled :
| active users |
Monitors the number of active user transactions per database
|
If retrieve_transactions_statistics is enabled:
| transactions |
Monitors the number of transactions per second
|
| active transactions |
Active Transactions
|
If retrieve_logs_statistics is enabled:
| log_flush_waits |
Monitors the number of log flush waits per second
|
| log_file_growths |
Monitors the usage (growth) of the transaction logs
|
| log_file_shrinks |
Monitors the usage (shrinking) of the transaction logs
|
| logfile_size |
Monitors logfile size
|
| logfile_usage |
Monitors free space in log files
|
If monitor_backups is enabled:
| backup_status_minutes |
Monitors number of minutes since last backup
|
| backup_status_last_backup |
Monitors when last backup was done
|
If monitor_filegroups_space is enabled:
| fg_free_space |
Monitors free space in filegroups
|
If monitor_user_reserved_space is enabled:
| Monitors reserved space in user tables |
Monitors reserved space in user tables
|
| Monitors reserved space free data % in user tables |
Monitors reserved space free data % in user tables
|
The plugin will also create one module for each custom query defined in the configuration file.