Redis
This document describes the Redis functionality of PandoraFMS discovery.
- Introduction
- Pre requisites
- Parameters and configuration
- Manual execution
- Discovery
- Agents and modules generated by the plugin
Introduction
This plugin is designed to monitor Redis instances by means of queries that extract key information to evaluate service performance and status, such as memory usage, number of connected clients, operations executed, or replication statistics. This data is reflected in Pandora FMS in the form of modules that provide statistical values within an agent representing each Redis instance.
Pre requisites
In Redis 6 or higher, if ACLs (access control lists) are used, each user can have specific permissions to execute certain commands. The +info permission is required to execute this integration.
To grant this permission to a user, you can use:
ACL SETUSER <user> on >password ~* +info
Parameters and configuration
Parameters
| --conf | Path to the configuration file |
Configuration file (--conf)
[CONF]

threads = < Number of threads to be used for agent creation >
prefix = < Prefix to be added to the name of the generated modules >
prefix_agents = < Prefix to be added to the name of the generated agents >
agents_group = < ID of the Pandora FMS group where the agents will be created >
tentacle_ip = < IP of the Tentacle server to which the information will be sent >
allow_regexp = < Regular expression to filter module names that will be allowed >
deny_regexp = < Regular expression to filter module names that will be denied >
scan_server = < Enable with 1 to monitor Redis server statistics >
scan_clients = < Enable with 1 to monitor connected client statistics >
scan_memory = < Enable with 1 to monitor memory statistics >
scan_persistence = < Enable with 1 to monitor persistence status >
scan_threads = < Enable with 1 to monitor internal thread statistics >
scan_stats = < Enable with 1 to monitor general statistics >
scan_replication = < Enable with 1 to monitor replication status >
scan_cpu = < Enable with 1 to monitor CPU usage >
scan_commandstats = < Enable with 1 to monitor executed command statistics >
scan_latencystats = < Enable with 1 to monitor latency statistics >
scan_sentinel = < Enable with 1 to monitor Sentinel status >
scan_cluster = < Enable with 1 to monitor cluster status >
scan_modules = < Enable with 1 to monitor module statistics >
scan_keyspace = < Enable with 1 to monitor the Redis keyspace >
scan_errorstats = < Enable with 1 to monitor error statistics >

[CONNECTION_STRINGS]

< Connection string for a Redis server. One string must be defined per line. You can specify the agent name by using | at the end of the connection string and specifying the agent name. >

[THRESHOLDS]

< Threshold settings to apply to a specific module. One must be defined per line. >

< Threshold settings to apply to specific modules that match a regexp expression. One must be defined per line. >

[QUERIES]

< Custom module to execute a custom search query. One must be defined per line
Example
[CONF]
threads = 1
prefix = redis-
prefix_agents = redis-
agents_group =

tentacle_ip= 192.168.10.51

allow_regexp = ^used
deny_regexp =

scan_server = 1
scan_clients = 1
scan_memory = 1
scan_persistence = 1
scan_threads = 1
scan_stats = 1
scan_replication = 1
scan_cpu = 1
scan_commandstats = 1
scan_latencystats = 1
scan_sentinel = 1
scan_cluster = 1
scan_modules = 1
scan_keyspace = 1
scan_errorstats = 1

[CONNECTION_STRINGS]
host='localhost', port=6379
host='127.0.0.1', port=6379|redis_agent

[UMBRALS]

pre-used_memory [name] = min_warning 75|min_critical 85
pre-used_cpu_sys_children [name] = min_warning 60|min_critical 90
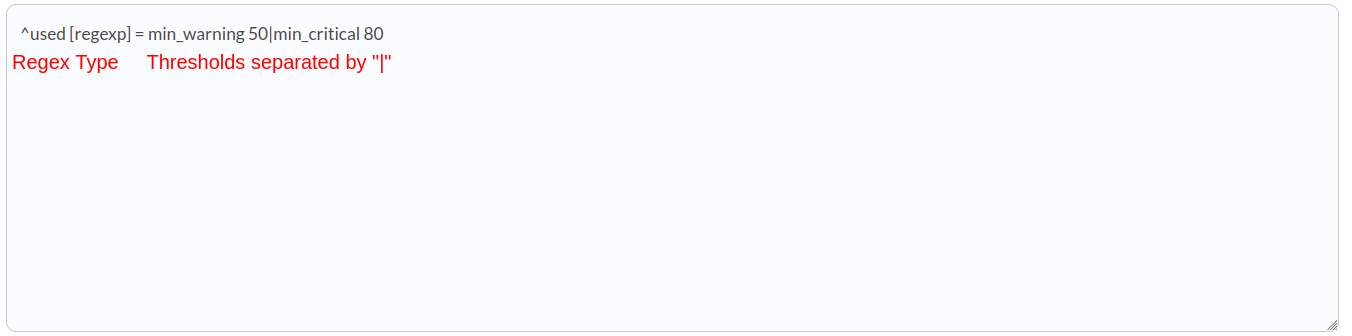
^used [regexp] = min_warning 50|min_critical 80

[QUERIES]
custom_module 1|generic_data_string|idx:users|Paul @age:[30 40]|name
custom_module 2|generic_data_string|idx:users|@city:{Tel Aviv}
Manual execution
The plugin execution format is as follows:
./pandora_redis --conf < path to the configuration file > For example:
./pandora_redis --conf /usr/share/pandora_server/util/plugin/redis.conf Discovery
This plugin can be integrated with Pandora FMS Discovery.
To do this, you must load the “.disco” package, which you can download from the Pandora FMS library.
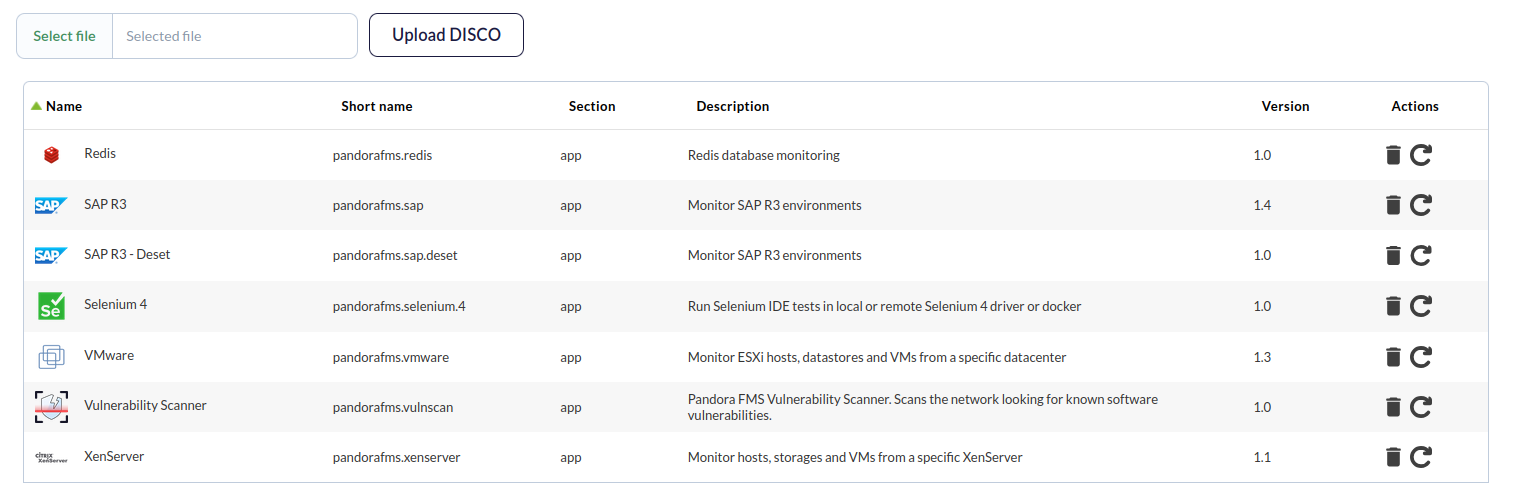 Once loaded, Microsoft SQL Server environments can be monitored by creating Discovery tasks from the Management > Discovery > Applications section.
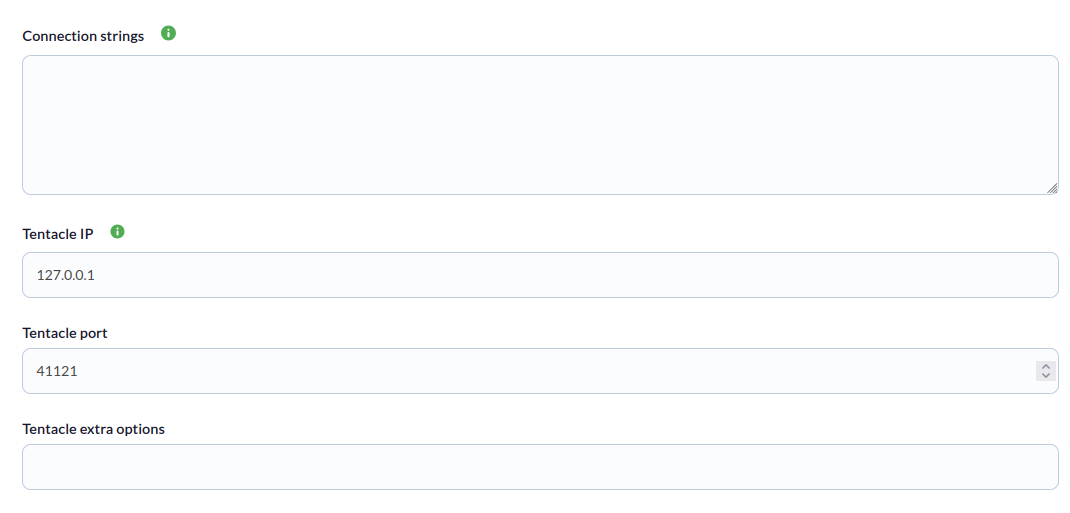
For each task, the following minimum information will be requested:
- Connection strings:
host='172.17.0.2', port=6379|redis_agent - Tentacle IP: IP address of the Tentacle server to which agent data should be sent. Normally, this parameter will not be modified.
- Tentacle Port: Port of the Tentacle server to which the data should be sent. Normally, this parameter will not be modified.
- Tentacle extra options: Additional options for sending data using the Tentacle client. Normally, this parameter will not be modified.
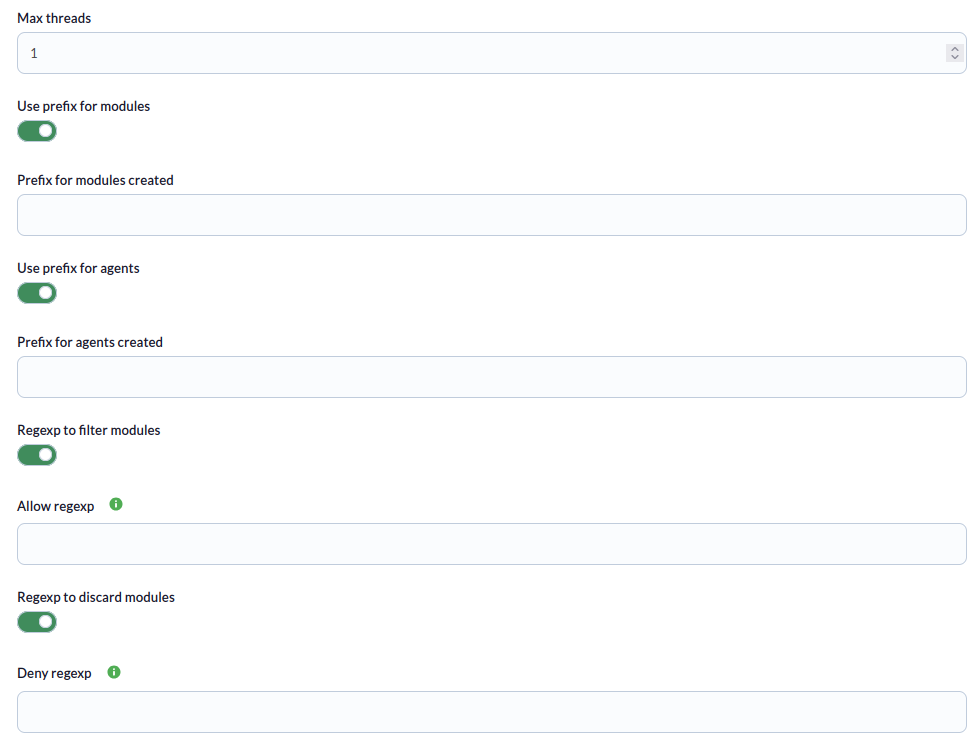
También se podrá ajustar la configuración de la tarea para personalizar la monitorización deseada:
- Max threads: To optimize execution time, multiple threads can be configured to monitor task agents. Keep in mind that configuring multiple threads can increase the CPU usage of the task.
- Use prefix for modules: Enable this token to specify a prefix.
- Prefix for modules created: Specify a prefix that will be added to the agents modules created.
- Use prefix for agents: Enable this token to specify a prefix.
- Prefix for agents created: Specify a prefix that will be added to the agents created.
- Regexp to filter modules: Enable this token to specify a regexp pattern for filtering.
- Allow regexp: Regex value; only modules that match this pattern will be created.
- Regexp to discard modules: Enable this token to specify a regexp pattern to discard.
- Deny regexp: Regex value, modules matching this pattern will be discarded.
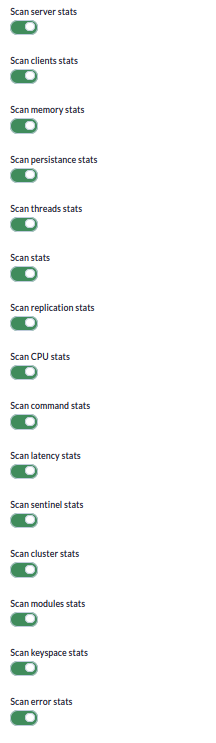
-
Scan server stats : If enabled, it will monitor server statistics.
-
Scan clients stats : If enabled, it will monitor client statistics.
-
Scan memory stats : If enabled, it will monitor memory statistics.
-
Scan persistance stats : If enabled, it will monitor persistence statistics.
-
Scan threads stats :If enabled, it will monitor thread statistics.
-
Scan stats : If enabled, it will monitor general Redis statistics.
-
Scan replication stats : If enabled, it will monitor replication statistics.
-
Scan CPU stats : If enabled, it will monitor CPU statistics.
-
Scan command stats : If enabled, it will monitor command statistics.
-
Scan latency stats : If enabled, it will monitor latency statistics.
-
Scan cluster stats : If enabled, it will monitor cluster statistics.
-
Scan modules stats : If enabled, it will monitor module statistics.
-
Scan keyspace stats : If enabled, it will monitor keyspace statistics.
-
Scan error stats : If enabled, it will monitor error statistics.
- Define tresholds: In this section, you can specify thresholds that will be applied to the modules. You can specify a module name to which the threshold will be applied, or a regexp pattern to add the threshold to modules containing that regexp.

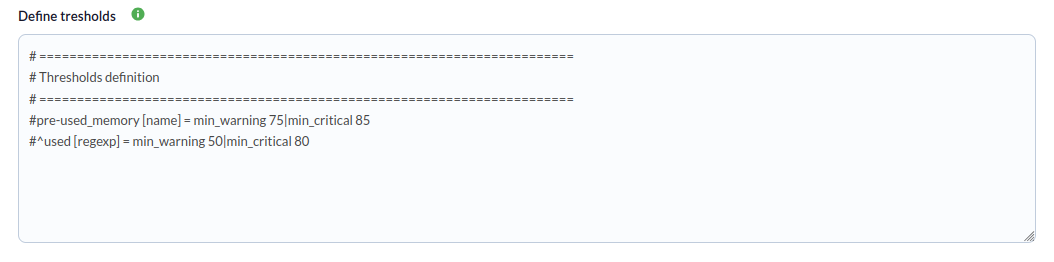
The syntax for specifying each query must be specified on a different line for each threshold and is as follows:
< name of module to apply the threshold to, or regexp pattern > [< type, name if it is a name or regexp if it is a pattern ] = threshold, separating each threshold with | >For example, if we want to apply thresholds to a specific module:
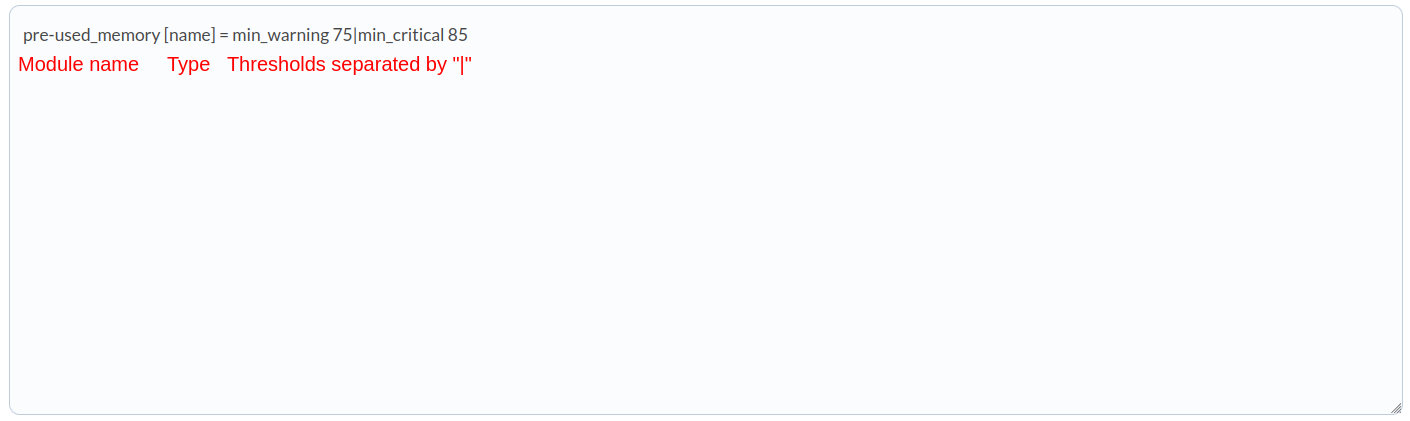
If we want to apply thresholds to a group of modules, determined by a regexp pattern:
- Custom queries: Configuration block to define the custom queries to be executed. Each query will generate a new module for each task agent.
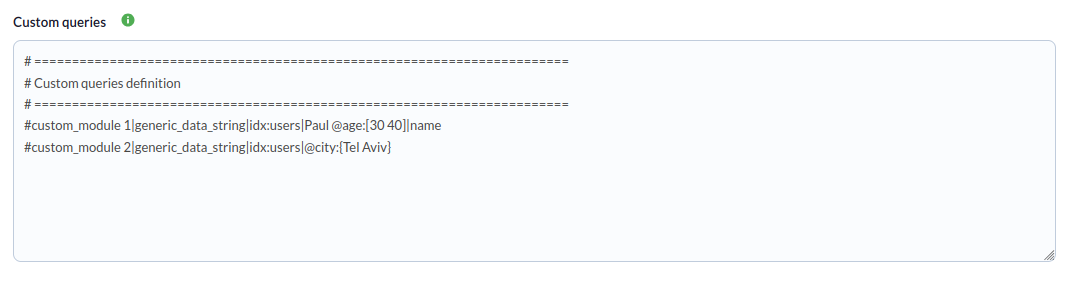
The syntax for specifying each threshold must be specified on a different line for each query and is as follows:
< module name > | < module type > | < index name > | < query > | < field (optional) >Example:
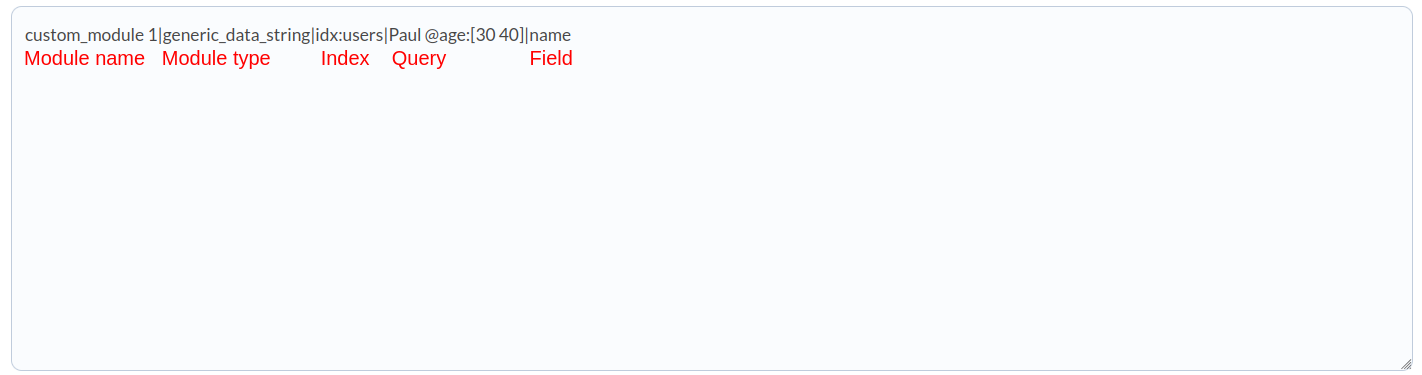
The field section is used to specify a “key” for the document from which to extract the value. If it is not used, or if the query returns multiple documents, the value will be the documents in string format.
Successfully completed tasks will have an execution summary with the following information:
- Total agents: Total agents generated by the task.

Tasks that are not successfully completed will have an execution summary recording the errors that occurred.
Agents and modules generated by the plugin
The plugin will create an agent for the Redis instance with the name specified in the configuration. If no name is specified, the agent name will be <redis_<host redis>>.
Running the integration will create the defined custom query modules and the following modules in the agents:
If the Scan server stats token is enabled:
- redis_version
- redis_git_sha1
- redis_git_dirty
- redis_build_id
- redis_mode
- os
- arch_bits
- monotonic_clock
- multiplexing_api
- atomicvar_api
- gcc_version
- process_id
- process_supervised
- run_id
- tcp_port
- server_time_usec
- uptime_in_seconds
- uptime_in_days
- hz
- configured_hz
- lru_clock
- executable
- config_file
- io_threads_active
- listener0
If the Scan clients stats token is enabled:
- connected_clients
- cluster_connections
- maxclients
- client_recent_max_input_buffer
- client_recent_max_output_buffer
- blocked_clients
- tracking_clients
- pubsub_clients
- watching_clients
- clients_in_timeout_table
- total_watched_keys
- total_blocking_keys
- total_blocking_keys_on_nokey
If the Scan memory stats token is enabled:
- used_memory
- used_memory_human
- used_memory_rss
- used_memory_rss_human
- used_memory_peak
- used_memory_peak_human
- used_memory_peak_time
- used_memory_peak_perc
- used_memory_overhead
- used_memory_startup
- used_memory_dataset
- used_memory_dataset_perc
- allocator_allocated
- allocator_active
- allocator_resident
- allocator_muzzy
- total_system_memory
- total_system_memory_human
- used_memory_lua
- used_memory_vm_eval
- used_memory_lua_human
- used_memory_scripts_eval
- number_of_cached_scripts
- number_of_functions
- number_of_libraries
- used_memory_vm_functions
- used_memory_vm_total
- used_memory_vm_total_human
- used_memory_functions
- used_memory_scripts
- used_memory_scripts_human
- maxmemory
- maxmemory_human
- maxmemory_policy
- allocator_frag_ratio
- allocator_frag_bytes
- allocator_rss_ratio
- allocator_rss_bytes
- rss_overhead_ratio
- rss_overhead_bytes
- mem_fragmentation_ratio
- mem_fragmentation_bytes
- mem_not_counted_for_evict
- mem_replication_backlog
- mem_total_replication_buffers
- mem_replica_full_sync_buffer
- mem_clients_slaves
- mem_clients_normal
- mem_cluster_links
- mem_aof_buffer
- mem_allocator
- mem_overhead_db_hashtable_rehashing
- active_defrag_running
- lazyfree_pending_objects
- lazyfreed_objects
If the Scan persistence stats token is enabled:
- loading
- async_loading
- current_cow_peak
- current_cow_size
- current_cow_size_age
- current_fork_perc
- current_save_keys_processed
- current_save_keys_total
- rdb_changes_since_last_save
- rdb_bgsave_in_progress
- rdb_last_save_time
- rdb_last_bgsave_status
- rdb_last_bgsave_time_sec
- rdb_current_bgsave_time_sec
- rdb_saves
- rdb_last_cow_size
- rdb_last_load_keys_expired
- rdb_last_load_keys_loaded
- aof_enabled
- aof_rewrite_in_progress
- aof_rewrite_scheduled
- aof_last_rewrite_time_sec
- aof_current_rewrite_time_sec
- aof_last_bgrewrite_status
- aof_rewrites
- aof_rewrites_consecutive_failures
- aof_last_write_status
- aof_last_cow_size
- module_fork_in_progress
- module_fork_last_cow_size
If the Scan threads stats token is enabled:
-io_thread_0
If the Scan stats token is enabled:
- total_connections_received
- total_commands_processed
- instantaneous_ops_per_sec
- total_net_input_bytes
- total_net_output_bytes
- total_net_repl_input_bytes
- total_net_repl_output_bytes
- instantaneous_input_kbps
- instantaneous_output_kbps
- instantaneous_input_repl_kbps
- instantaneous_output_repl_kbps
- rejected_connections
- sync_full
- sync_partial_ok
- sync_partial_err
- expired_subkeys
- expired_keys
- expired_stale_perc
- expired_time_cap_reached_count
- expire_cycle_cpu_milliseconds
- evicted_keys
- evicted_clients
- evicted_scripts
- total_eviction_exceeded_time
- current_eviction_exceeded_time
- keyspace_hits
- keyspace_misses
- pubsub_channels
- pubsub_patterns
- pubsubshard_channels
- latest_fork_usec
- total_forks
- migrate_cached_sockets
- slave_expires_tracked_keys
- active_defrag_hits
- active_defrag_misses
- active_defrag_key_hits
- active_defrag_key_misses
- total_active_defrag_time
- current_active_defrag_time
- tracking_total_keys
- tracking_total_items
- tracking_total_prefixes
- unexpected_error_replies
- total_error_replies
- dump_payload_sanitizations
- total_reads_processed
- total_writes_processed
- io_threaded_reads_processed
- io_threaded_writes_processed
- io_threaded_total_prefetch_batches
- io_threaded_total_prefetch_entries
- client_query_buffer_limit_disconnections
- client_output_buffer_limit_disconnections
- reply_buffer_shrinks
- reply_buffer_expands
- eventloop_cycles
- eventloop_duration_sum
- eventloop_duration_cmd_sum
- instantaneous_eventloop_cycles_per_sec
- instantaneous_eventloop_duration_usec
- acl_access_denied_auth
If the Scan replication stats token is enabled
- role
- connected_slaves
- master_failover_state
- master_replid
- master_replid2
- master_repl_offset
- second_repl_offset
- repl_backlog_active
- repl_backlog_size
- repl_backlog_first_byte_offset
- repl_backlog_histlen
If the Scan CPU stats token is enabled:
- used_cpu_sys
- used_cpu_user
- used_cpu_sys_children
- used_cpu_user_children
- used_cpu_sys_main_thread
- used_cpu_user_main_thread
If the Scan command stats token is enabled
- cmdstat_FT.SEARCH
- cmdstat_ping
- cmdstat_config|get
- cmdstat_info
- cmdstat_client|setinfo
If the Scan latency stats token is enabled:
- latency_percentiles_usec_FT.SEARCH
- latency_percentiles_usec_ping
- latency_percentiles_usec_config|get
- latency_percentiles_usec_info
- latency_percentiles_usec_client|setinfo
If the Scan cluster stats token is enabled:
-cluster_enabled
If the Scan modules stats token is enabled:
- modules
- search_version
- search_redis_version
- search_number_of_indexes
- search_number_of_active_indexes
- search_number_of_active_indexes_running_queries
- search_number_of_active_indexes_indexing
- search_total_active_write_threads
- search_total_indexing_time
- search_fields_text
- search_fields_numeric
- search_fields_tag
- search_used_memory_indexes
- search_used_memory_indexes_human
- search_smallest_memory_index
- search_smallest_memory_index_human
- search_largest_memory_index
- search_largest_memory_index_human
- search_used_memory_vector_index
- search_global_idle_user
- search_global_idle_internal
- search_global_total_user
- search_global_total_internal
- search_gc_bytes_collected
- search_gc_total_cycles
- search_gc_total_ms_run
- search_gc_total_docs_not_collected
- search_gc_marked_deleted_vectors
- search_total_queries_processed
- search_total_query_commands
- search_total_query_execution_time_ms
- search_total_active_queries
- search_errors_indexing_failures
- search_errors_for_index_with_max_failures
- search_OOM_indexing_failures_indexes_count
- search_dialect_1
- search_dialect_2
- search_dialect_3
- search_dialect_4
- search_extension_load
- search_friso_ini
- search_enableGC
- search_minimal_term_prefix
- search_minimal_stem_length
- search_maximal_prefix_expansions
- search_query_timeout_ms
- search_timeout_policy
- search_cursor_read_size
- search_cursor_max_idle_time
- search_max_doc_table_size
- search_max_search_results
- search_max_aggregate_results
- search_gc_scan_size
- search_min_phonetic_term_length
- search_bm25std_tanh_factor
If the Scan keyspace stats token is enabled:
-db0
If the Scan error stats token is enabled:
-errorstat_Expected