Add a remote check on an already monitored system
Now that the systems are detected, add some monitoring modules. Add the following monitoring:
- Network traffic on an interface.
- Packet loss on the network.
- Monitor a TCP network service.
See also: "Live the SNMP fever. New Wizards: Network monitoring (video)": https://www.youtube.com/watch?v=yb2Ln0waCTY
Network traffic on interface
For this it is imperative that SNMP is configured on the remote device. This generally needs to be enabled and with a minimum configuration that allows data to be queried. The SNMP devices allow you to configure which IP addresses can make queries and with which community, which for all intents and purposes is a kind of password.
First you locate the agent from where you need to get the network traffic; in this case it is 192.168.70.1. Following the same process (left side menu Operation → Monitoring → Views → Agent detail) you get to the main view of the agent to be configured and click on the last tab on the right, which will take you to the editing view of that agent.

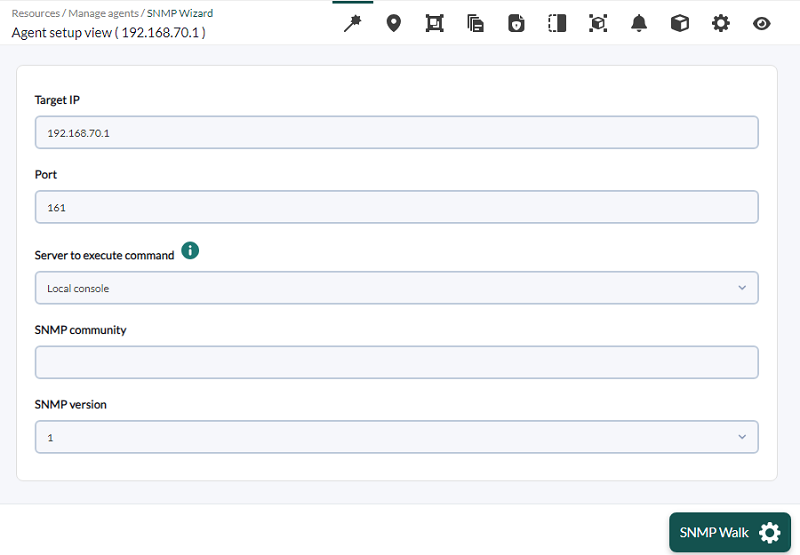
It will switch to the main editing view of the agent. Here the Wizards configuration submenu for this agent will be displayed, where the wizard (Wizard de Interface SNMP) will be chosen.
At this point you must provide the SNMP community that the device has configured, and make sure that the device supports SNMP queries enabled on the IP address shown on the screen. You can change the IP address and the default SNMP community, which is public. Once it is filled in, the SNMP Walk button will be given the job. If all goes well, it will display interfaces and the data that can be obtained from them.
With CTRL+Click (or CMD+Click on MacOS®) you can select several items in both boxes. Always remember to monitor the Output traffic (ifOutOctets), the Input traffic (ifInOctets) and the interface status (ifOperStatus) for each interface. Click on the Create modules button and a screen will appear that should inform that the modules have been created.
Bear in mind that the network traffic modules are of the incremental type, i.e. their value is the difference between the information sample just collected and the previous one. It displays a “rate” (in this case in bytes per second), so it needs some time (between 5 and 10 minutes) before displaying any data.
Click on the tab View to return to the agent view and wait at least 5 minutes until you already have traffic data, refreshing or clicking on the tab View.
Packet loss in the network
Remote plugins are user-defined checks that use a script or program that has been deployed on the Pandora FMS server, so that it can be used for monitoring, expanding the set of things it can do. In this section we will add a remote plugin preconfigured in Pandora FMS.
Use a plugin serial; to do so, go to the agent edit view and then to the module configuration tab:

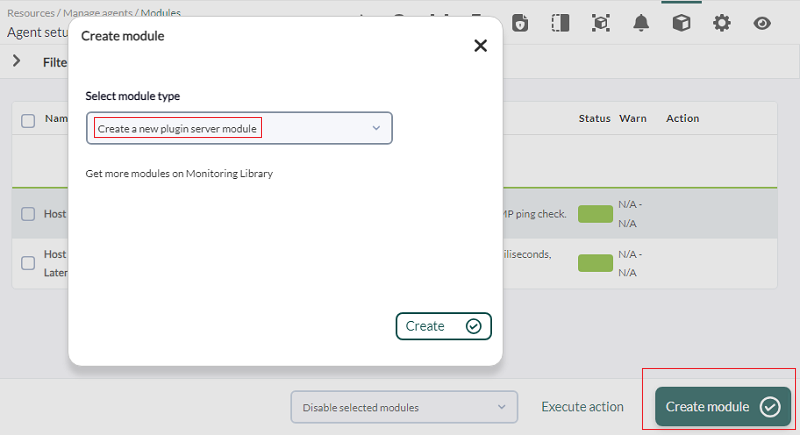
First choose Network management and then the plugin Packet Loss using the drop-down lists, and finally put the IP address on which you want to launch the check. The rest of the fields are left as they are. The editing mode is similar, only that the Create button is replaced by the Update button.
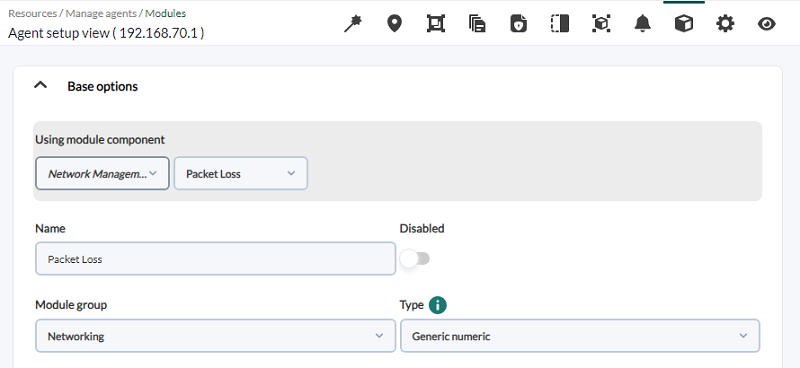
Update the screen a couple of times, until the new module appears in the list:

This is a very interesting plugin, which used in conjunction with the basic connectivity (ping) and latency time, serves to determine the quality of the network, as it indicates the percentage of packet loss, sampling every 5 minutes by default.
Monitoring a TCP network service
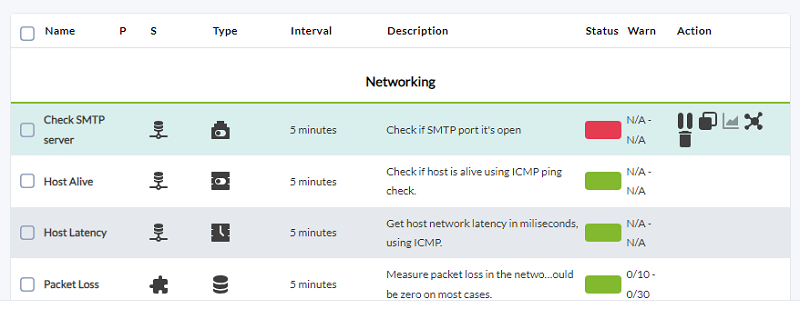
In this case we are going to add a monitoring to verify that an SMTP (email) service is active on a machine. Although it can be a very complex check (simulating that user and password credentials are sent, that an email is sent, etc.) it will be simplified by only verifying that the port is open and that it responds.
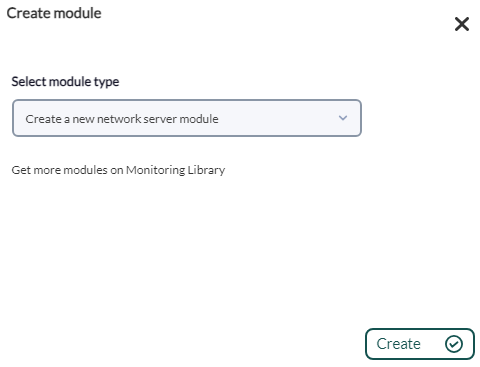
To do this, repeat the same initial steps as in the previous example, but this time choose a Network module.
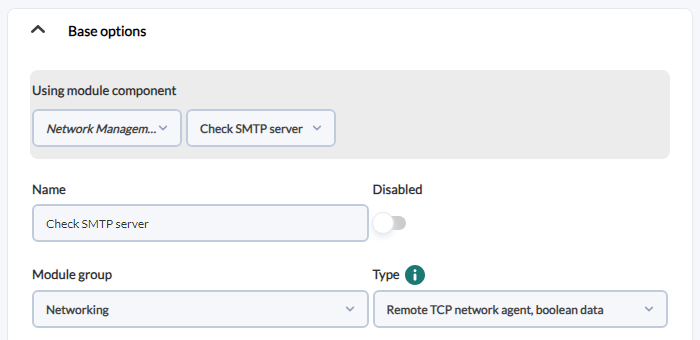
Then use the drop-down controls until you find the desired check (Check SMTP Server) and click to create the module.
Finally the steps will be repeated again (go to the operation view and refresh until the monitor appears), so the final result will be something similar to this: