There is a similar online installation tool for Pandora FMS Enterprise version that you may request if you are a user of this version through the support portal or [through this link](https://pandorafms.com/en/free-trial/ "https://pandorafms.com/en/free-trial/") get a free trial (demo). In addition, for [Satellite server installation](https://dokuwiki.pandorafms.com/manual/!development/en/documentation/05_big_environments/05_satellite#online_installation_tool "en:documentation:05_big_environments:05_satellite"), there is an online installation tool too.
By means of this execution, the whole stack necessary for Pandora FMS will be installed, rendering an instance fully funtional to start monitoring. [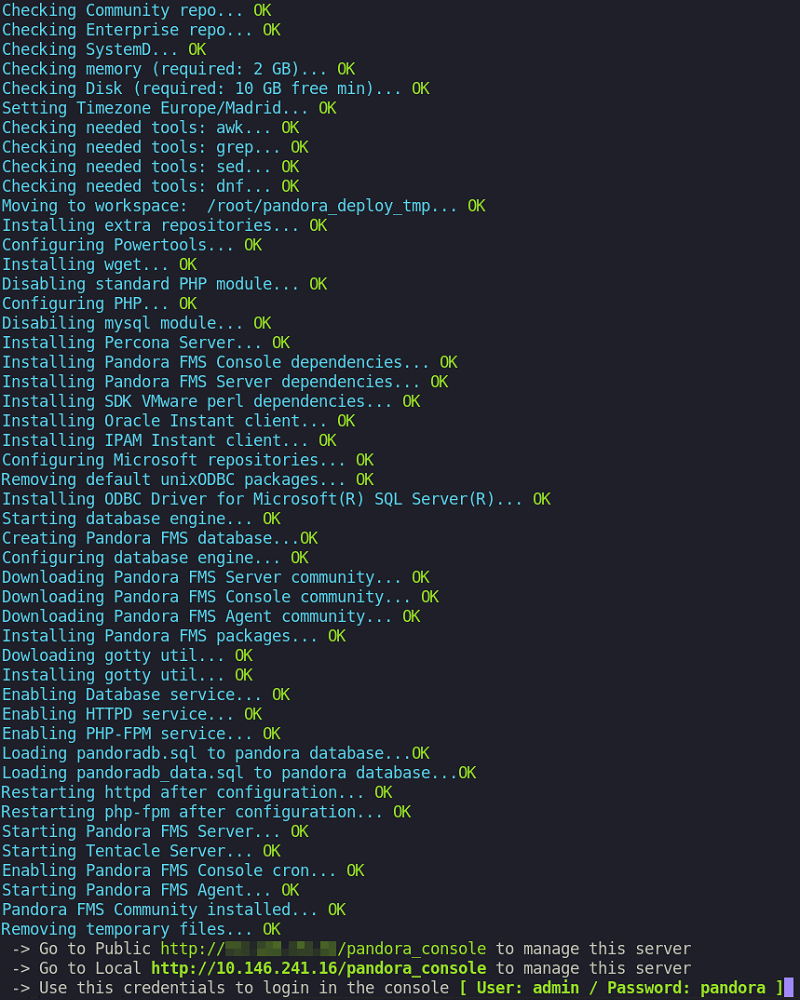](https://pandorafms.com/guides/public/uploads/images/gallery/2023-10/Kdjimage.png) You may get more information in our video tutorial «[Cloud installers (agents, server)](https://www.youtube.com/watch?v=hChQ2EVz9SM&t=0s)». **Custom installation using the online installation tool** Although the previous execution performs a full environment installation, it is possible to define different modifications through the environment variables to customize the installation. These modifiers are: - **TZ:** Define the time zone (time zone) of the machine, by default it is `Europe/Madrid`. - **DBHOST:** The database host, by default`DBHOST=127.0.0.1` . - **DBNAME:** The database name to be created, by default `DBNAME=pandora`. - **DBUSER:** The database user will be created, by default `DBUSER=pandora` . - **DBPASS:** The user password that will be created, by default `DBPASS=pandora`. - **DBPORT:** Port number of the database to be connected, by default `DBPORT=3306`. - **DBROOTPASS:** Database root user password, by default `DBROOTPASS=pandora`. - **SKIP\_PRECHECK:** Skip the check of whether there is an prior Pandora FMS installation, useful for creating a new database and pointing the installation to that one; by default `SKIP_PRECHECK=0`. - **SKIP\_DATABASE\_INSTALL:** Skip the database installation, useful for having a database installed, whether local or remote and using its credentials for creating Pandora FMS database; by default `SKIP_DATABASE_INSTALL=0`. - **SKIP\_KERNEL\_OPTIMIZATIONS:** Skip the recommended kernel optimization, only for advanced users. By default `SKIP_KERNEL_OPTIMIZATIONS=0`. - **MYVER:** Define the MySQL version to be installed, if 80 is defined MySQL 8 will be installed. By default `MYVER=57` (deploy MySQL 5.7). - **PHPVER:** Define PHP version to be installed, if 8 is defined, PHP 8 will be installed. By default `PHPVER=7` (deploy PHP 7). - **PANDORA\_SERVER\_PACKAGE:** Define the URL of the RPM package of the Pandora FMS server you wish to install. By default, the last available version is defined. - **PANDORA\_CONSOLE\_PACKAGE:** Define the URL of the RPM package of the Pandora FMS Web console you wish to install. The latest version available is defined by default. - **PANDORA\_AGENT\_PACKAGE:** Define the URL of the RPM package of the Pandora FMS EndPoint you wish to install. The latest version available is defined by default. - **PANDORA\_BETA:** If defined to `1`, the packages from the latest beta version available will be installed (only for test environments). By default `PANDORA_BETA=0` (if specific packages are defined, ignore this option). for the use of this environment variables, just define them before running the installation script, for example, in a **RHEL 8** installation with defined variables run the block: ``` env TZ='Europe/Madrid' \ DBHOST='127.0.0.1' \ DBNAME='pandora' \ DBUSER='pandora' \ DBPASS='pandora' \ DBPORT='3306' \ DBROOTPASS='pandora' \ MYVER=57 \ PHPVER=7 \ SKIP_PRECHECK=0 \ SKIP_DATABASE_INSTALL=0 \ SKIP_KERNEL_OPTIMIZATIONS=0 \ PANDORA_SERVER_PACKAGE="https://firefly.pandorafms.com/pandorafms/latest/RHEL_CentOS/pandorafms_server-7.0NG.noarch.rpm" \ PANDORA_CONSOLE_PACKAGE="https://firefly.pandorafms.com/pandorafms/latest/RHEL_CentOS/pandorafms_console-7.0NG.noarch.rpm" \ PANDORA_AGENT_PACKAGE="https://firefly.pandorafms.com/pandorafms/latest/RHEL_CentOS/pandorafms_agent_linux-7.0NG.noarch.rpm" \ PANDORA_BETA=0 \ sh -c "$(curl -fsSL https://pfms.me/deploy-pandora-el8)" ``` # First Steps Once installed, the system should boot up and, after a few seconds, display the terminal to log in. The first step should be to know the IP address that the system has assigned, to be able to connect to the server from outside. To do this, type the following command in the terminal: ```file ifconfig ```You may also use the command `ip address show` .
[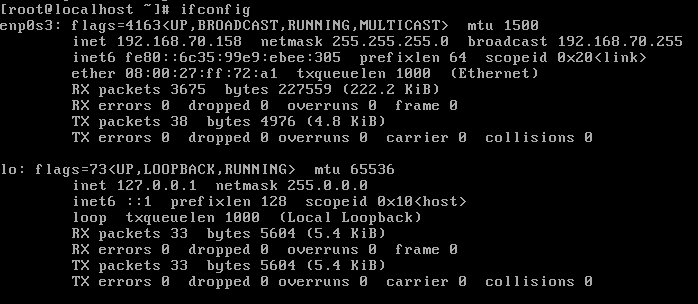](https://pandorafms.com/guides/public/uploads/images/gallery/2023-08/f-step-2.png) In the case of this screenshot, the IP address of the system is 192.168.70.158. Once you know Pandora FMS system IP address, you may access it from outside the virtual machine, which is always the most convenient. It can be done via SSH or HTTP. Use the root password (superuser) that you established in the installation configuration (**DBROOTPASS**). Open a web browser (Google Chrome® and Mozilla Firefox® are recommended) and type in the following address in the address bar, consisting of the IP address (x.x.x.x.x) you obtained from the server: ```file http://x.x.x.x/pandora_console ``` In the previous example, it would be ```file http://192.168.70.158/pandora_console ``` If everything is correct, access the welcome screen of Pandora FMS Console, similar to this one: [](https://dokuwiki.pandorafms.com/manual/!development/_detail/wiki/wiki/pandora_login.png?id=es%3Aquickguides%3Ageneral_quick_guide_cloud "wiki:wiki:pandora_login.png")[](https://pandorafms.com/guides/public/uploads/images/gallery/2023-08/pandora-login.png)Use the default credentials: user `admin` and password `pandora`/`Pandor4!` .
Once here, you have a full Pandora FMS installation ready to be used. # Enterprise License ActivationThis section is only for Enterprise version users. If you wish to request a *demo*, [please contact us.](https://pandorafms.com/en/contact/ "https://pandorafms.com/en/contact/")
If you have a **Metaconsole** license, you may skip this step, since this type of license automatically activates each associated node.**It is important not to start the *daemon*** `pandora_server` with the Enterprise version installed if the Console Enterprise version has not been previously activated, as that may be the cause for errors.
You may also get more information in the video tutorial "[How to renew Pandora FMS License](https://www.youtube.com/watch?v=Yd-BfFMnOqE&t=0s)" or "[offline](https://www.youtube.com/watch?v=9n8LVcPyXhI&t=0s)". Once you have accessed Pandora FMS through the browser, you will be asked to enter a valid license. Click on **Request new license** and proceed to the next step. In this step you should fill in the contact information and the **Auth key** that the commercial department sent you. Proceed to the next step by clicking on **Online validation**: [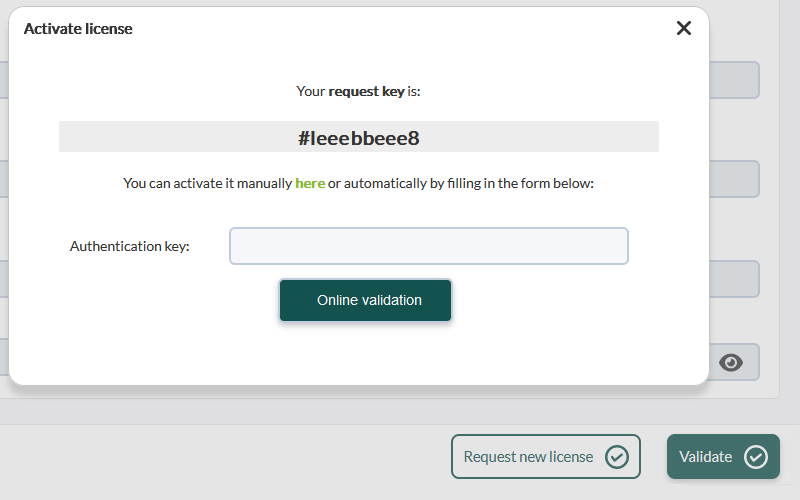](https://pandorafms.com/guides/public/uploads/images/gallery/2023-08/pfms-activate-license.png) Once finished, a license will be ready to be validated. Finish all steps, the console is ready for use. # Starting the Enterprise Server This section is for Enterprise version users only. If you wish to evaluate a demo, [please contact us](https://pandorafms.com/en/contact/). After activating the license, the Enterprise server must be started. You may connect to Pandora FMS server through a command terminal (local or remote) or through the [QuickShell feature](https://dokuwiki.pandorafms.com/manual/!development/en/documentation/04_using/12_console_setup#websocket_engine) if you access the Agent that monitors the server itself. ```file sudo /etc/init.d/pandora_server start ``` From version NG 754 onwards, you have additional options for manual start and stop of High Availability Environments (HA). To verify its correct operation, access Pandora FMS through the browser, go to the left side menu, click on **Management → Servers → Manage servers**. You should see something like the following: [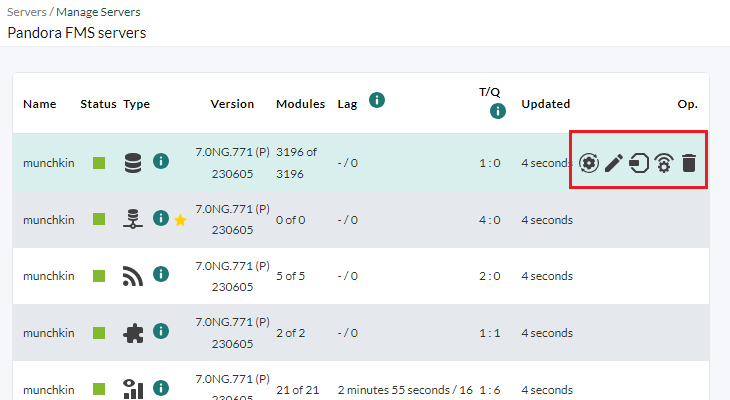](https://pandorafms.com/guides/public/uploads/images/gallery/2023-08/servers-manage-servers-pandora-fms-servers.png) # Detecting Local Network Systems To start monitoring with Pandora FMS, there is nothing better than detecting close-range devices and start detecting them. It makes no difference if they are PCs with MS Windows®, servers with GNU/Linux®, routers, switches, etc., since monitoring in this case will be very basic (see whether they respond to pinging). Then you may upgrade monitoring once they are all located (see also "Introduction to Pandora FMS Discovery" (video): https://www.youtube.com/watch?v=oiPyFDgYvIM&t=0s . # Creating a scanning task In the side menu go to the **Management → Discovery → Host&Devices** section. Click Net Scan, this will allow you to create a scanning task. [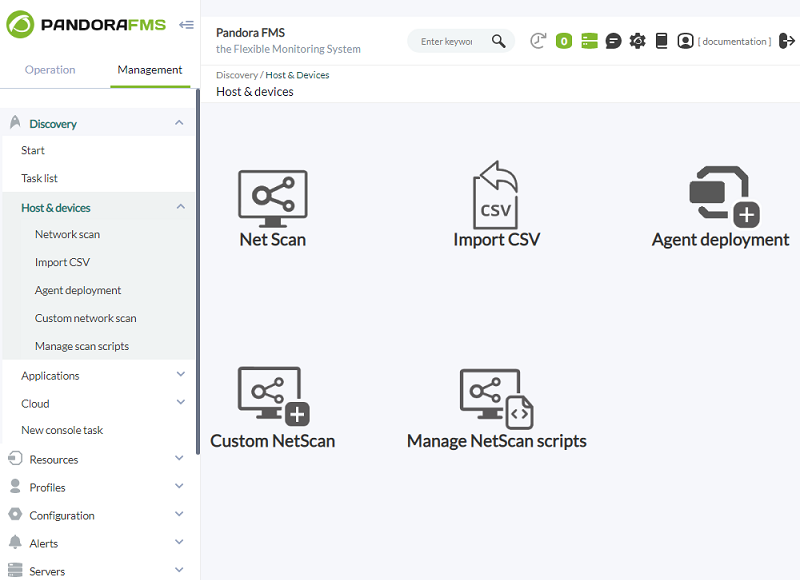](https://pandorafms.com/guides/public/uploads/images/gallery/2023-08/pfms-management-discovery-host-and-devices.png) It will create the task as follows: You will have to modify only the network range to be scanned, in this capture it is `192.168.70.1/24`, which means that all hosts in network `192.168.70.xx` will be scanned. The appropriate mask will be used here to define the network. Select the **Applications** group, which will be used to contain the devices you detect. From now on we will call generically "agents" the devices managed and/or monitored by Pandora FMS. [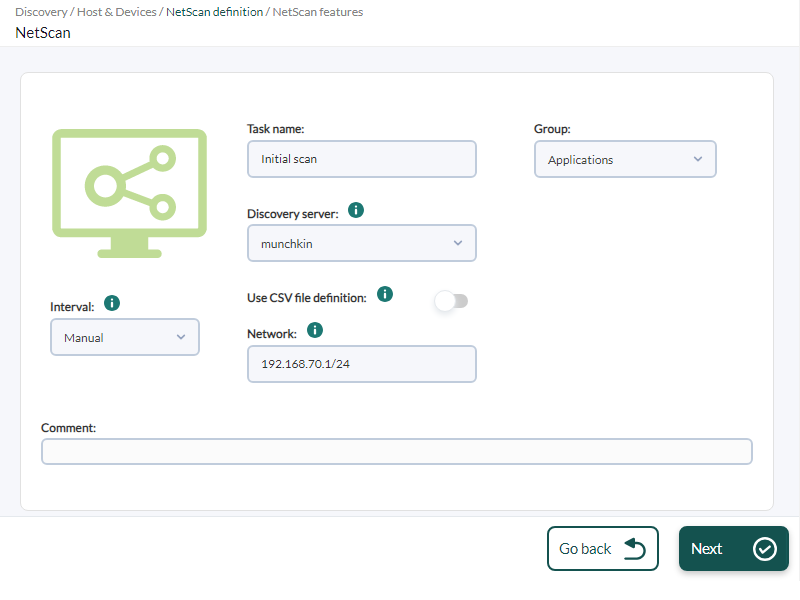](https://pandorafms.com/guides/public/uploads/images/gallery/2023-08/pfms-discovery-netscan-initial-scan.png) Select under **Module template** the **Basic monitoring** option, which covers only latency and network availability checks. You may select other types of checks, such as SNMP or WMI, to be performed during the scanning process. [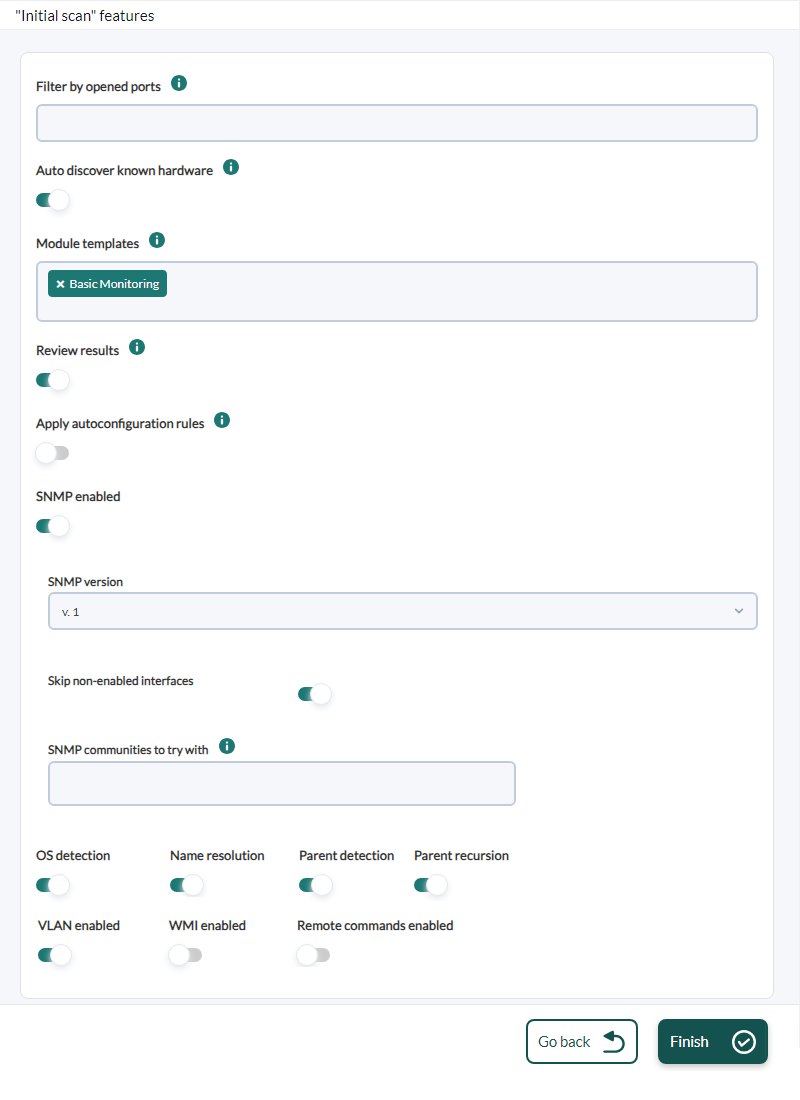](https://pandorafms.com/guides/public/uploads/images/gallery/2023-08/pfms-discovery-netscan-initial-scan-features.png) Once created, the entry will be displayed. Click on the magnifying glass icon to see the task details: [](https://pandorafms.com/guides/public/uploads/images/gallery/2023-08/pfms-discovery-netscan-initial-scan-see-summary.png) By clicking on the magnifying glass icon, the current status of the task will be shown, which in this case is completed. In this image you may see that the progress bar disappeared and that the system found the network systems to add them to the monitoring. [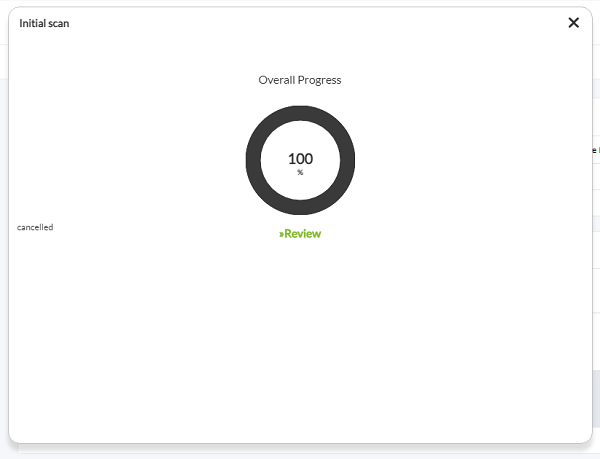 ](https://pandorafms.com/guides/public/uploads/images/gallery/2023-08/pfms-discovery-netscan-initial-scan-overall-progress.png) # Checking detected systems Wait for the whole network to be detected. [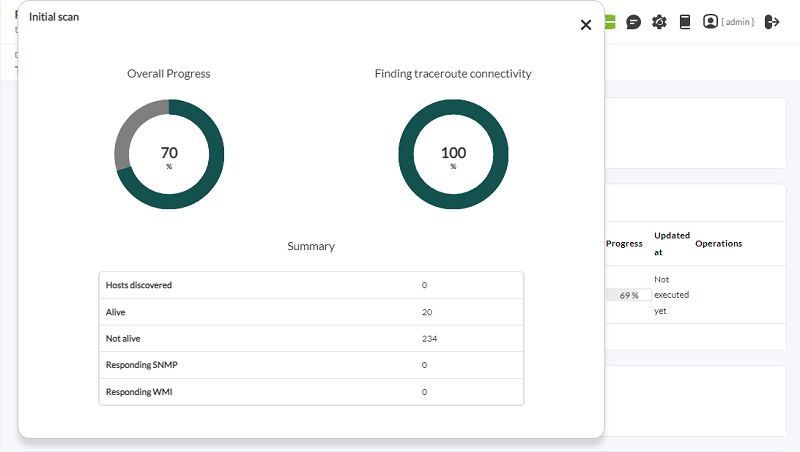](https://pandorafms.com/guides/public/uploads/images/gallery/2023-08/pfms-discovery-netscan-initial-scan-overall-progress-2.png) [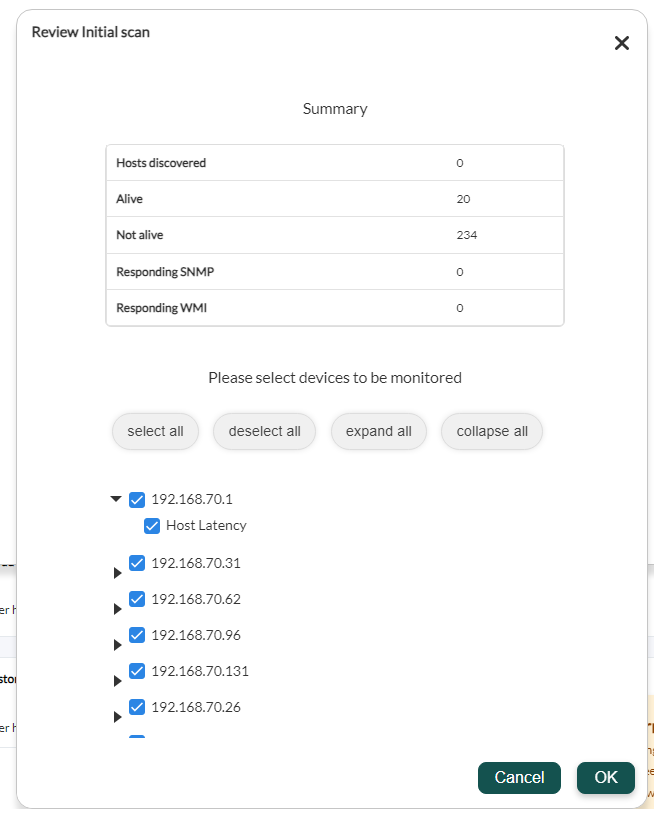](https://pandorafms.com/guides/public/uploads/images/gallery/2023-08/pfms-discovery-netscan-initial-scan-overall-progress-3.png) Once finished, access the agent detail view (left-side menu **Operation** → **Monitoring** → **Views** → **Agent detail**) to see all detected systems. [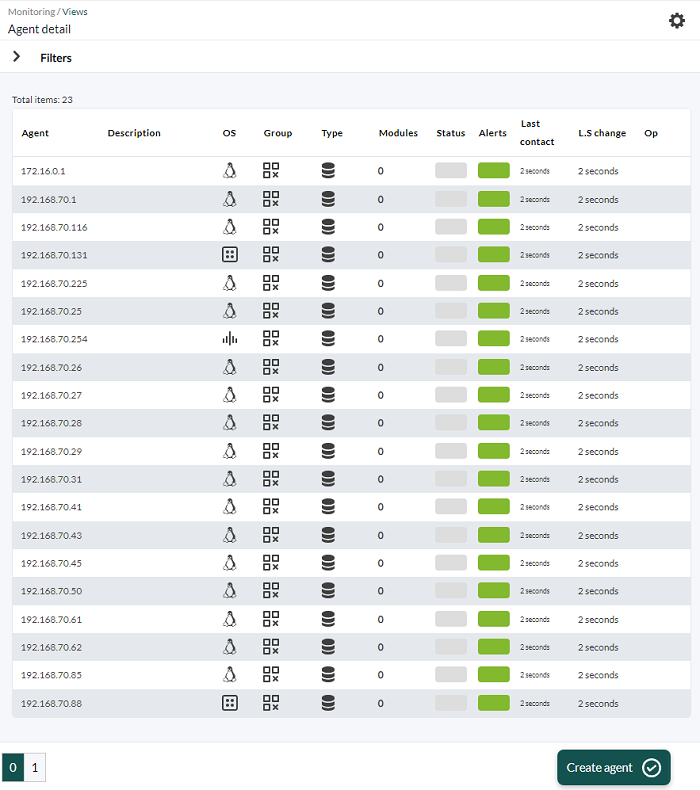](https://pandorafms.com/guides/public/uploads/images/gallery/2023-08/pfms-operation-monitoring-views-agent-detail.png) You may see several systems that were correctly detected by Pandora FMS. In some cases the system name will have been solved (if it was possible by DNS) and in others, the operating system will have been detected. By clicking on the name (in this case, the second one in the previous image) you will go to the agent detail view, which will show all the information collected from that system. [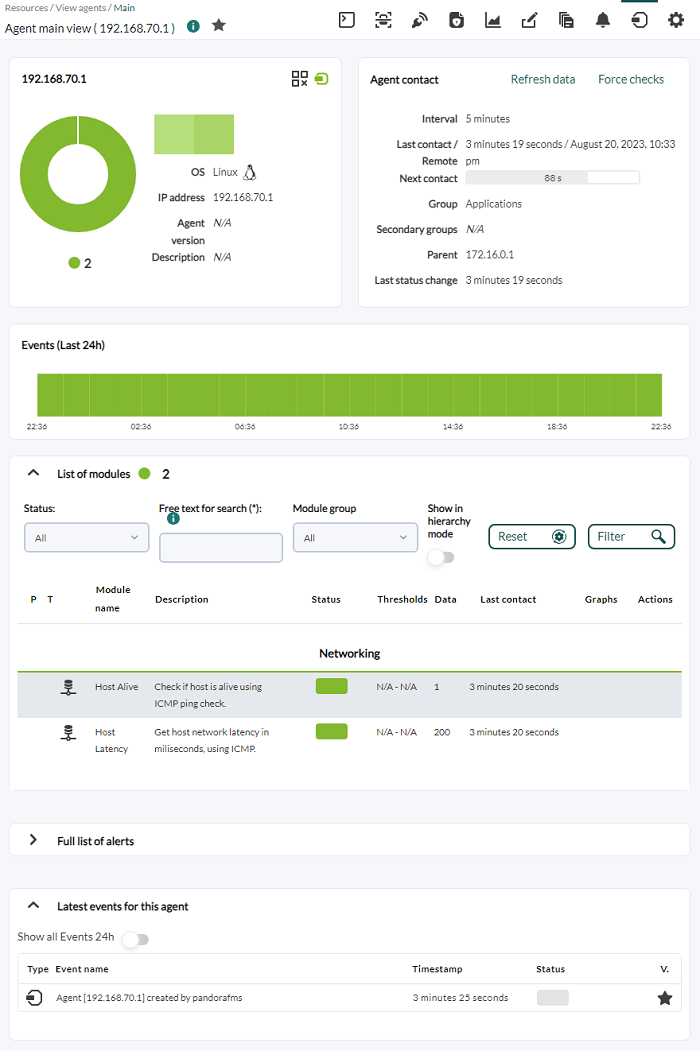](https://pandorafms.com/guides/public/uploads/images/gallery/2023-08/pfms-operation-monitoring-views-agent-detail-2.png) # Adding a Remote Check to a Monitored System Now that the systems are dected, add monitoring modules. Add the following monitoring: - Interface network monitoring. - Network packet loss. - Monitoring a TCP network service. See also: “Join SNMP fever. New Wizards: Network Monitoring (video)”: https://www.youtube.com/watch?v=yb2Ln0waCTY&t=0s # Interface Network Traffic For that it is imperative for SNMP to be configured on the remote device. This usually needs to be enabled and with a minimum configuration that allows querying data. [SNMP devices](https://dokuwiki.pandorafms.com/manual/!development/en/documentation/03_monitoring/08_snmp_traps_monitoring) allow you to configure the IP addresses that can make queries and with which community, which for all intents and purposes is a kind of password. First the agent from where you need to get the network traffic will be located; in this case it is `192.168.70.1`. Following the same process (left side menu **Operation → Monitoring → Views → Agent detail**) you will get to the main view of the agent to be configured and you will click on the last tab on the right, which will take you to the editing view of that agent. [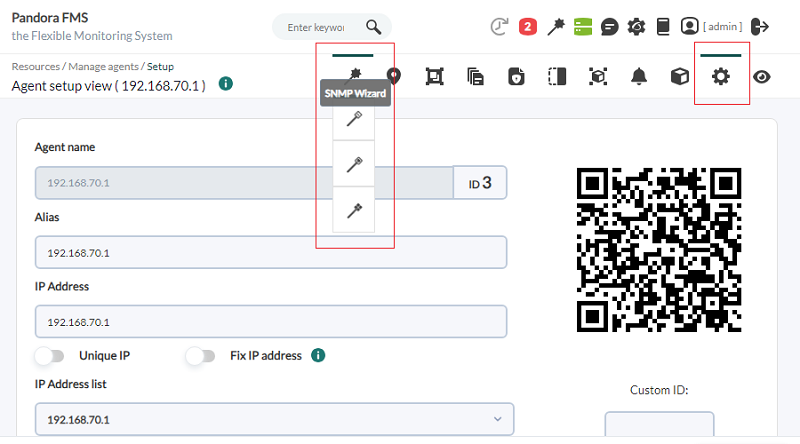](https://pandorafms.com/guides/public/uploads/images/gallery/2023-08/pfms-operation-monitoring-views-agent-detail-snmp-wizard-1.png) You will go to the main agent editing view. Here the configuration **Wizards** submenu for this agent will be displayed, where the wizard (SNMP Interface Wizard) will be chosen. At this point you must provide the SNMP community that the equipment has configured, **and make sure that the device supports SNMP queries enabled on the IP address shown on the screen**. You may change the IP address and the default SNMP community, which is `public`. Once it is filled in, click on **SNMP Walk**. If everything works, it will show the interfaces and the data that can be obtained from them. [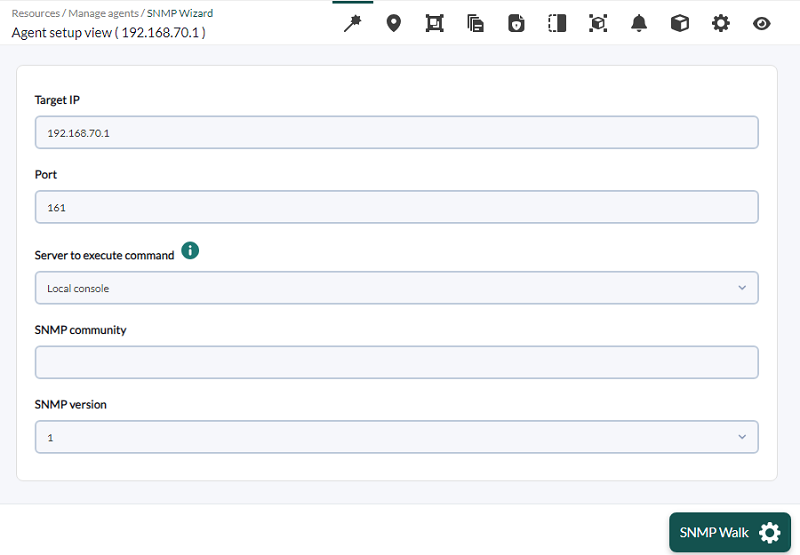](https://pandorafms.com/guides/public/uploads/images/gallery/2023-08/pfms-operation-monitoring-views-agent-detail-snmp-wizard-2.png) With CTRL+Click (or CMD+Click on MacOS®) you may select several items in both boxes. Always remember to monitor the outgoing traffic (**ifOutOctets**), the incoming traffic (**ifInOctets**) and the interface status (**ifOperStatus**) for each interface. Click **Create modules** and a screen will appear that should inform that the modules have been created.Note that network traffic modules are **incremental**, i.e. their value is the difference between the information sample just collected and the previous one. It displays a "rate" (in this case in bytes per second), so it needs some time (between 5 and 10 minutes) before displaying any data.
Click on the **View** tab to return to the agent view and wait at least 5 minutes until traffic data is already available by refreshing or clicking on the **View** tab. [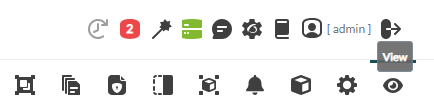](https://pandorafms.com/guides/public/uploads/images/gallery/2023-08/pfms-operation-monitoring-views-agent-detail-view.png) After a while you should have the data of the traffic modules (input and output, separately) and a new section in the agent, which shows information of the interfaces with a direct access to an aggregated graph with the input and output traffic overlaid, if you click on the title where it says **Interface information** (SNMP). If you want to speed up the execution of the network modules, you may use the force remote check icon (**it will not work with local modules, or those collected locally by a EndPoint**). Depending on the server load, it may take between 2 and 15 seconds to run the network test. [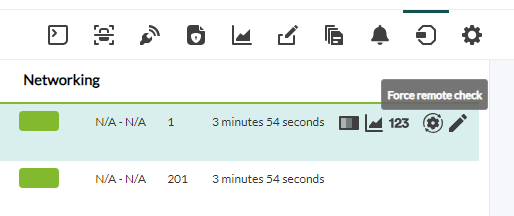](https://pandorafms.com/guides/public/uploads/images/gallery/2023-08/pfms-operation-monitoring-views-agent-detail-force-remote-check.png) The traffic module information will look like this, and the graphs for each metric. By clicking on the **Module graph** icon, a window will be displayed with the graph for that monitor and by clicking on the **Module detail** icon, a table with the data will be shown. [](https://pandorafms.com/guides/public/uploads/images/gallery/2023-08/pfms-operation-monitoring-views-agent-detail-module-graph.png) [](https://pandorafms.com/guides/public/uploads/images/gallery/2023-08/pfms-operation-monitoring-views-agent-detail-module-detail.png) # Network Packet Loss Remote plugins are user-defined checks that use a script or a program that was **deployed on Pandora FMS server**, so that it can be used for monitoring, expanding the set of things it can do. In this section we will add a remote plugin preconfigured in Pandora FMS. Use a serial plugin; go to the agent editing view and then to the module configuration tab: [](https://pandorafms.com/guides/public/uploads/images/gallery/2023-08/pfms-operation-monitoring-views-agent-detail-modules.png) Click **Create module**, which will lead you to the remote plugin module configuration (**Create a new plugin server module**). [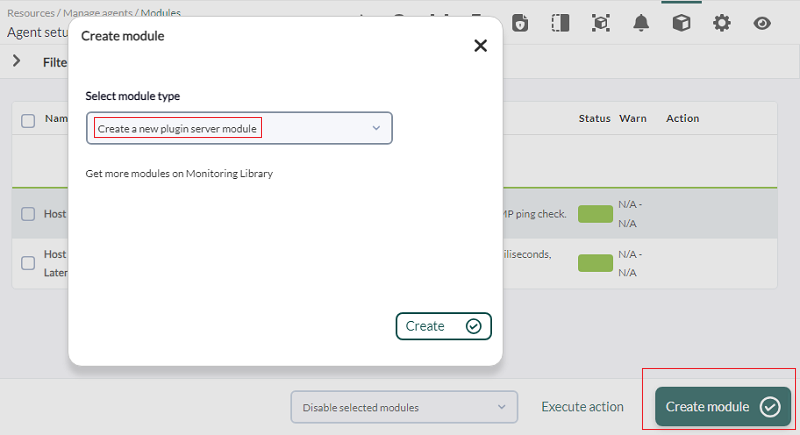](https://pandorafms.com/guides/public/uploads/images/gallery/2023-08/pfms-operation-monitoring-views-agent-detail-create-a-new-plugin-server-module.png) First choose **Network management** and then the **Packet Loss** plugin using the drop-down lists, and finally the IP address on which you want to launch the check. The rest of the fields are left as they are. The editing mode is similar, only that the **Create** button is replaced by the **Update** button. [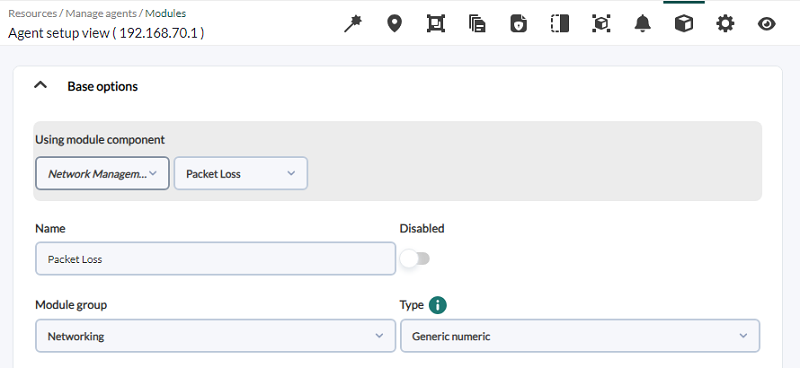](https://pandorafms.com/guides/public/uploads/images/gallery/2023-08/pfms-operation-monitoring-views-agent-detail-module-packet-loss.png) Refresh the screen a couple of times, until the new module appears on the list: [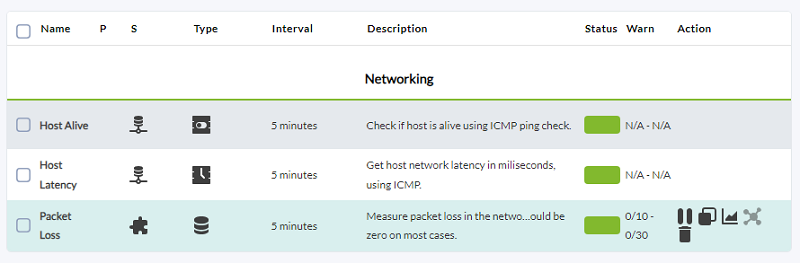](https://pandorafms.com/guides/public/uploads/images/gallery/2023-08/pfms-operation-monitoring-views-agent-detail-module-packet-loss-2.png) This is a very interesting plugin, which used together with the basic connectivity (**ping**) and latency time, serves to determine the quality of the network, as it indicates the percentage of packet loss, sampling every 5 minutes by default. # Monitoring a TCP Network Service In this case we are going to add monitoring to verify that an SMTP (email) service is active on a machine. Although it can be a very complex check (simulating that user and password credentials are sent, that an email is sent, etc.) it will be simplified by only verifying that the port is open and that it responds. To do this, the same initial steps of the previous example will be repeated, but this time **Network module** will be chosen. [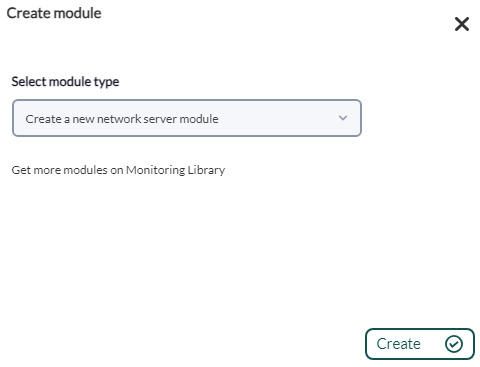](https://pandorafms.com/guides/public/uploads/images/gallery/2023-08/pfms-operation-monitoring-views-agent-detail-create-a-new-network-server-module.png) Then use the drop-down controls until you find the desired check (**Check SMTP Server**) and click to create the module. [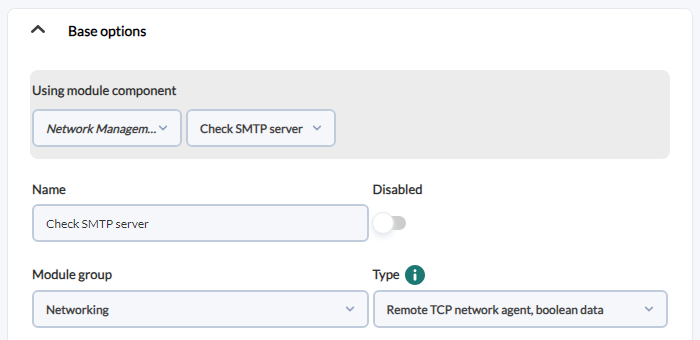](https://pandorafms.com/guides/public/uploads/images/gallery/2023-08/pfms-operation-monitoring-views-agent-detail-network-server-module-smtp-server.png) Finally the steps will be repeated again (go to the operation view and refresh until the monitor appears), so the final result will be something similar to this: [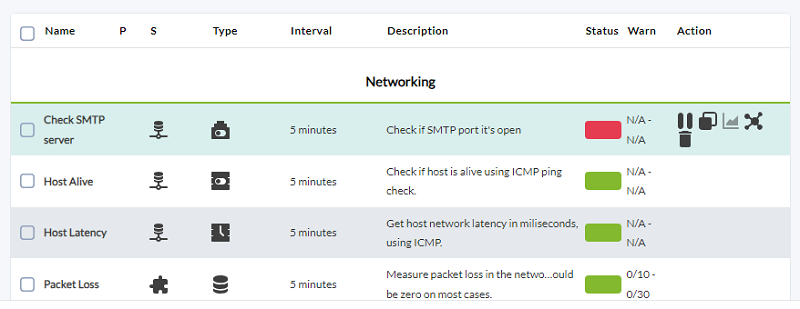](https://pandorafms.com/guides/public/uploads/images/gallery/2023-08/pfms-operation-monitoring-views-agent-detail-network-server-module-smtp-server-2.png) # Adding an Alert in the Face of an Issue At Pandora FMS the most basic way in which to create alerts is assigning an alert to a specific module. # Introduction Of course, [more advanced tasks can be carried out](https://dokuwiki.pandorafms.com/manual/!development/en/documentation/04_using/01_alerts), such as alerts on events, correlation, etc. The first alert to create is sending an email when one of the [monitored machines](https://dokuwiki.pandorafms.com/manual/!development/en/quickguides/general_quick_guide#interface_network_traffic) goes offline (with the Host alive module). Pandora FMS alerts are made up by three elements: - **Command.** - **Action.** - **Template.** In this particular case, a predefined command will be used (email forwardingt), an existing action will be modified (`Mail to XXX`) and an existing template will also be used, template Critical condition, that will execute the task when the module itself goes into critical state. See also: "[How Pandora FMS alert system works (video)](https://www.youtube.com/watch?v=LzWx9x6ESbw&t=0s)" # Server Setup For the correct functioning of the `email` command, it is necessary to configure in `pandora_server.conf` file a mail server that allows to make relay. In the example, the mail server located in our `localhost` through [Postfix](https://es.wikipedia.org/wiki/Postfix). You should enter the IP address of the local mail server, or one in Internet (configuring its authentication). To modify the server configuration file, you must access it, located at `/etc/pandora/pandora_server.conf` as **root** user by elevating your privileges using the `sudo su` command. You are the only **responsible** for this key. [](https://pandorafms.com/guides/public/uploads/images/gallery/2023-10/E6jimage.png) To edit this configuration file in this example, the **vim** program is used. More information can be found in the video tutorial "[Editing files with VIM](https://www.youtube.com/watch?v=mjE1GD4LRXc&t=0s)". Find the lines you see in the screenshot below and set those values. If you do not have a mail server, you may use for example a Gmail® account. You may see a quick guide on how to configure Pandora FMS server to work with a Gmail® account in the following link: [Configuring email alerts](https://dokuwiki.pandorafms.com/manual/!development/en/quickguides/configuration_emails_alerts). The lines that begin with the character `#` are comments and are not taken into account by the server. [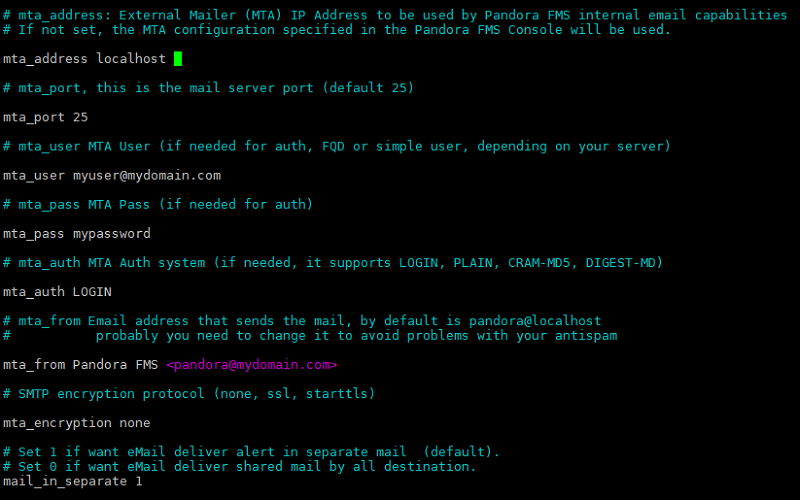](https://pandorafms.com/guides/public/uploads/images/gallery/2023-08/guiarapida-mailconf03.png) Once the changes are made, click ESC and `:wq` to save the changes and exit. Once you are in the command line, restart Pandora FMS server: ``` /etc/init.d/pandora_server restart ``` # Alert Setup As indicated before, alerts in Pandora FMS are made up by 3 parts: **Command**, **Action** and **Template**. You may find these options in the **Alerts** section. In order to configure this alert just modify the **action**, so the **Alert actions** option will be used. [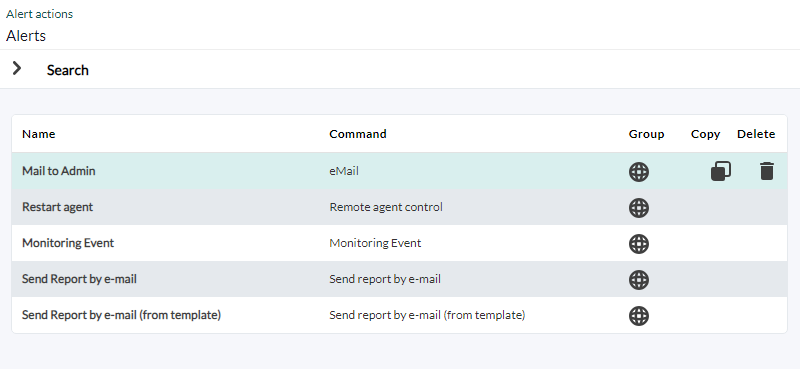](https://pandorafms.com/guides/public/uploads/images/gallery/2023-08/pfms-management-alert-actions.png) The section to be used is that of **Mail to admin**, click on said name to edit the alert action. [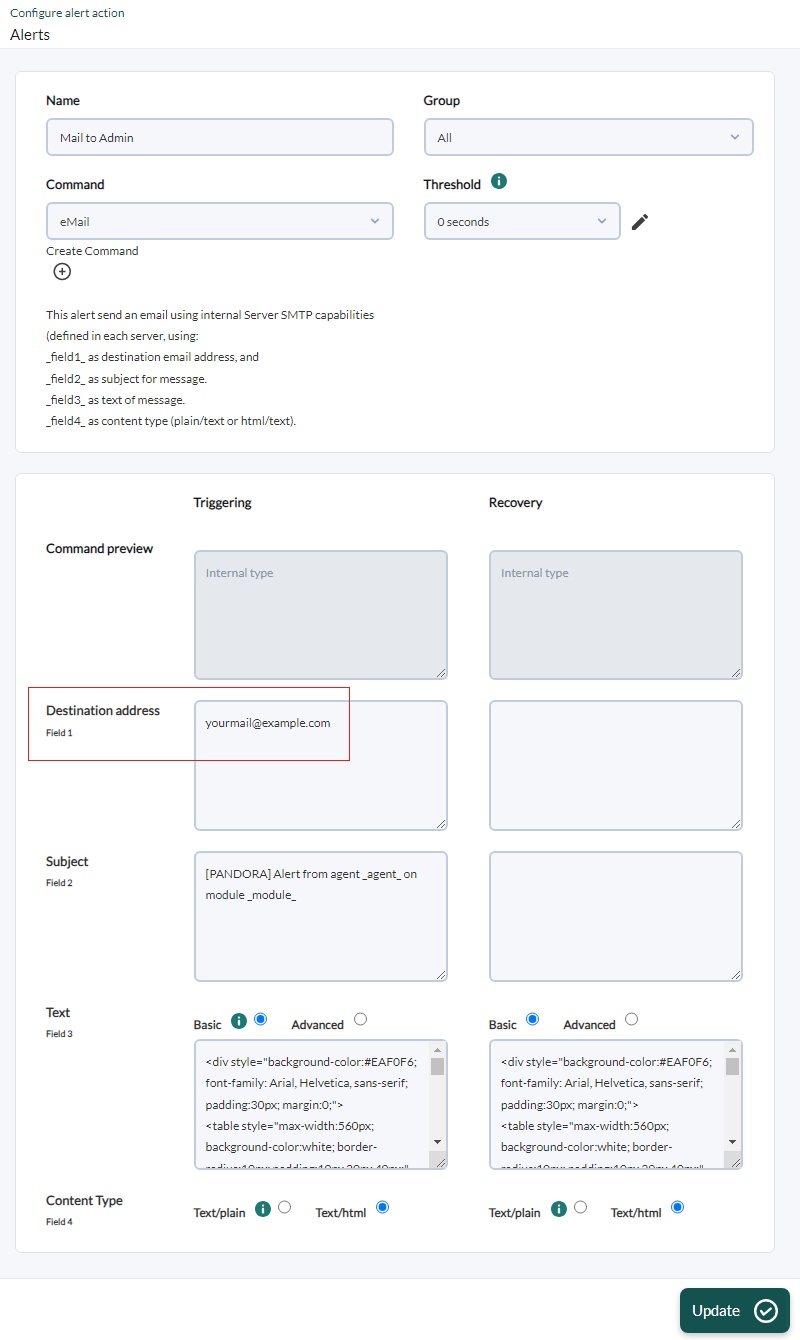](https://pandorafms.com/guides/public/uploads/images/gallery/2023-08/pfms-management-alert-actions-mail-to-admin.png) Modify **Field 1** and enter your email address, in this example [\[email protected\]](https://pandorafms.com/cdn-cgi/l/email-protection) is used. **Field 2** will leave the text in the screenshot. Here two macros are used, which will replace at run time the name of the agent and the module that generated the alert. # Assigning an Alert to a Module Go the agent editing, where the module is defined and click on the alert tab: [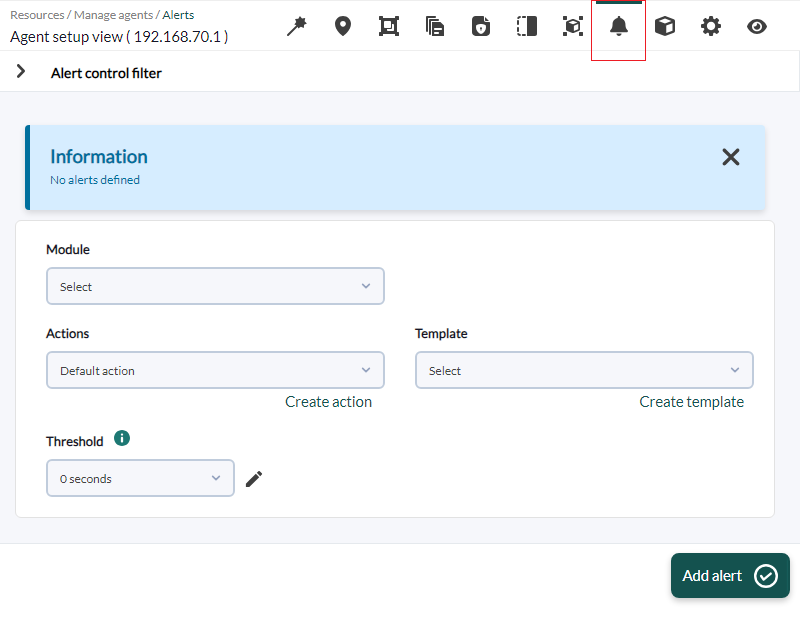](https://pandorafms.com/guides/public/uploads/images/gallery/2023-08/pfms-agent-add-alert.png) Now add the module (**Host Alive**), the template (**Critical Condition**) and the action (**Mail to admin**). Click **Add alert**. [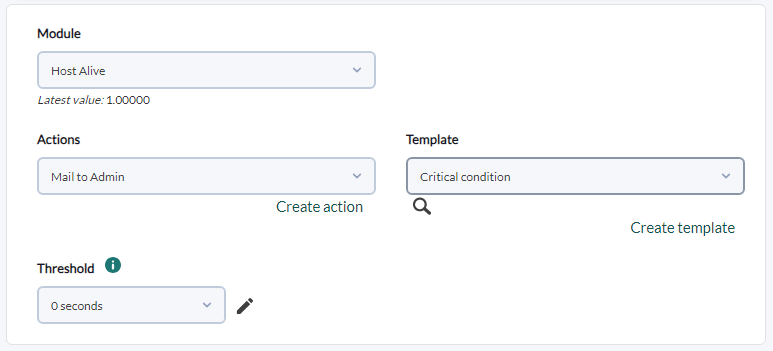](https://pandorafms.com/guides/public/uploads/images/gallery/2023-08/pfms-agent-add-alert-2.png) Once added, you may see in the agent view whether it is running or not, by taking a look at is state color: [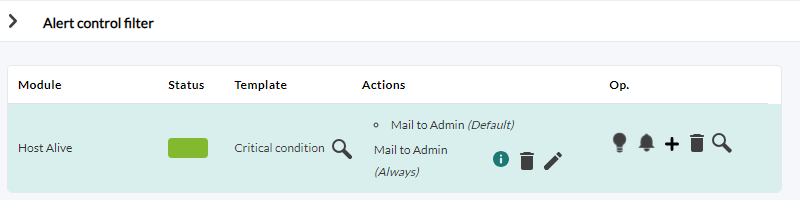](https://pandorafms.com/guides/public/uploads/images/gallery/2023-08/pfms-agent-add-alert-3.png) When the host goes offline the alert will fire: [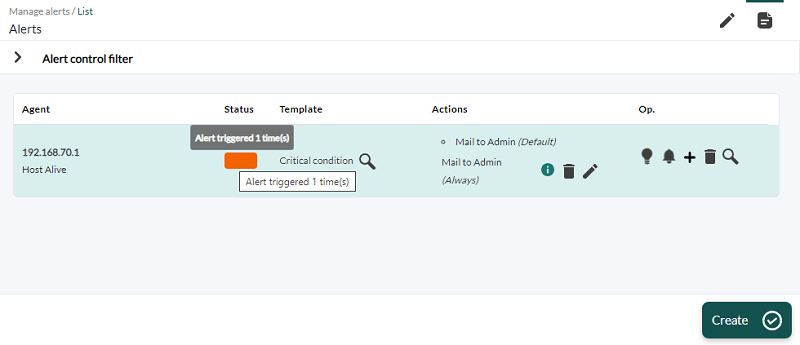](https://pandorafms.com/guides/public/uploads/images/gallery/2023-08/pfms-agent-add-alert-4.png) An email should be received, something similar to this one:[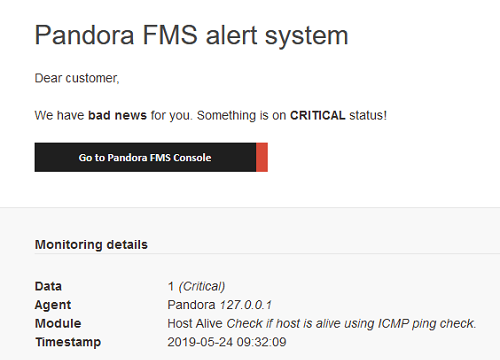](https://pandorafms.com/guides/public/uploads/images/gallery/2023-08/guiarapida-mail.png) Pandora FMS alerts are extremely flexible and, therefore sometimes complex to use. There is a specific chapter for those in the documentation: [Alerts in Pandora FMS](https://pandorafms.com/manual/). # Monitor a Windows Server with an EndPoint At Pandora FMS there are two types of monitoring:- Remote (carried out from Pandora FMS server to the different devices).- Local (a EndPoint is installed in each of the machines to be monitored and this one is in charge of retrieving the information and sending it to Pandora FMS server.See: “How to install a Windows Agent in Pandora FMS (video)”: https://www.youtube.com/watch?v=j_OvbrR-l_M&t=0sAt this point we will address the installation of a EndPoint in a MS Windows® computer and its basic monitoring. # Agent Installation The first step is to download MS Windows® agent from: [https://sourceforge.net/projects/pandora/files/Pandora%20FMS%207.0NG/759/Windows/](https://sourceforge.net/projects/pandora/files/Pandora%20FMS%207.0NG/759/Windows/ "https://sourceforge.net/projects/pandora/files/Pandora%20FMS%207.0NG/759/Windows/") In this link you may choose between the 32 bit or 64 bit agent. Once the agent is downloaded, run it by double clicking on it and the following language selection window will appear: [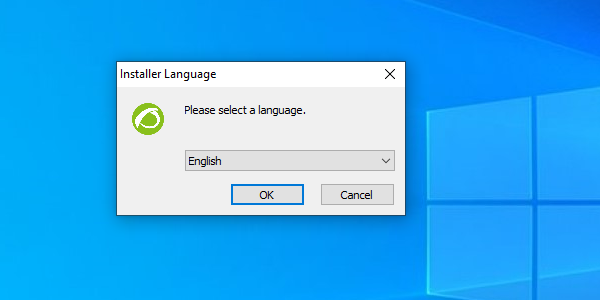](https://pandorafms.com/guides/public/uploads/images/gallery/2023-08/pandora-agent-30-rc3-install-windows-01.png) This is a standard MS Windows® installer that will prompt you to follow the steps. Accept the license and go through the different windows of the installer. Select the path where Pandora FMS agent will be installed (by default it is installed in `%ProgramFiles%/pandora_agent`). You may change it by clicking **Browse**..., once it is correctly specified click **Next**: [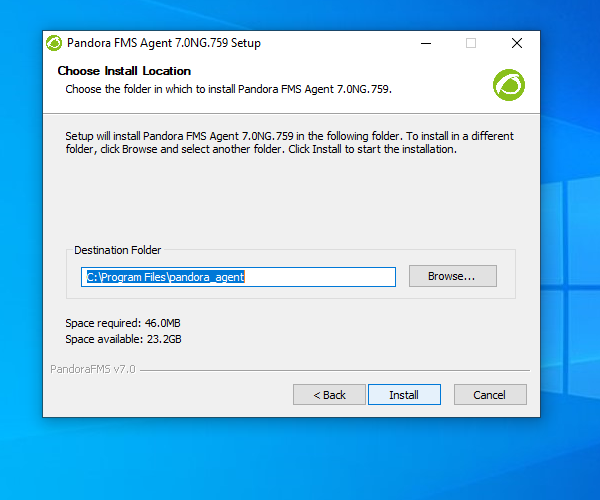](https://pandorafms.com/guides/public/uploads/images/gallery/2023-08/pandora-agent-30-rc3-install-windows-04.png) Wait for the files to be copied. Configure the IP address (or name) of Pandora FMS server that will receive the agent data and the group the agent will be associated to. [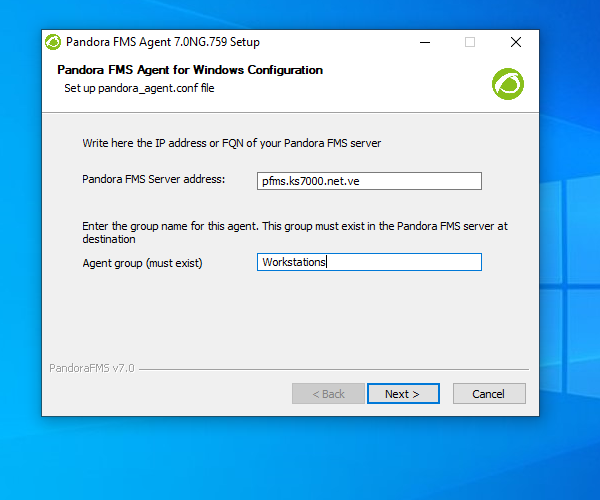](https://pandorafms.com/guides/public/uploads/images/gallery/2023-08/pandora-agent-30-rc3-install-windows-07.png) The following window shows the option to enable the remote configuration. It is important to have it enabled with `1` to have a copy of the agent in Pandora FMS server and from there to be able to add, edit and delete local modules directly from the agent. [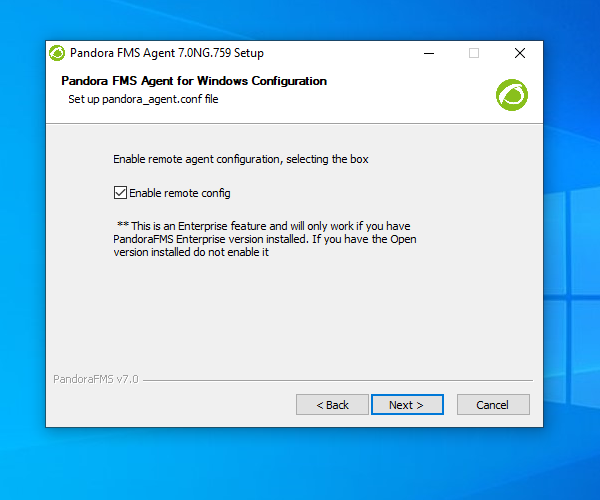](https://pandorafms.com/guides/public/uploads/images/gallery/2023-08/pandora-agent-config-remoto.png) To start the agent service at the end of the Pandora FMS agent installation, keep **Run** **Pandora FMS Agent 7.0NG** selected; otherwise you will have to do it manually, or it will start when MS Windows® restarts again. [](https://pandorafms.com/guides/public/uploads/images/gallery/2023-08/pandora-agent-config-remoto.png) Once the process is finished, MS Windows® agent is installed, running and reporting. # Checking the Information Returned by the Agent Once MS Windows® agent has been started after installation, it is time to check what this agent is reporting. To do this, you must know the name under which this agent will report. By default the agent is created with the host name. You may see the MS Windows® host name by running the **hostname** command in a window with **cmd.exe**. [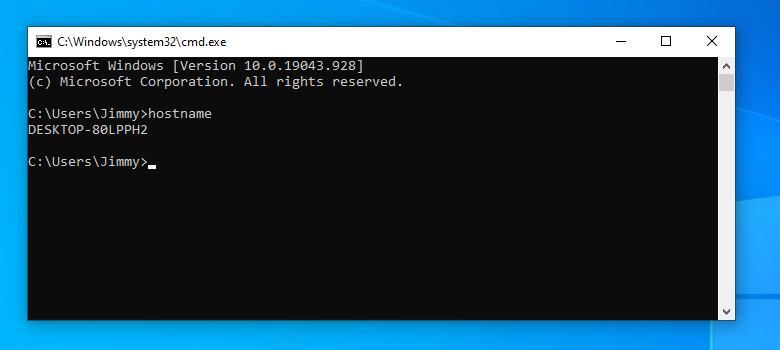](https://pandorafms.com/guides/public/uploads/images/gallery/2023-08/guia-rapida-windows1.png) Once you know the agent name, the next step is to see if it was created in Pandora FMS. To do this you have several options. The first one is to search in the agent details, inside the group where the agent was created, in this example the **Workstations** group. **[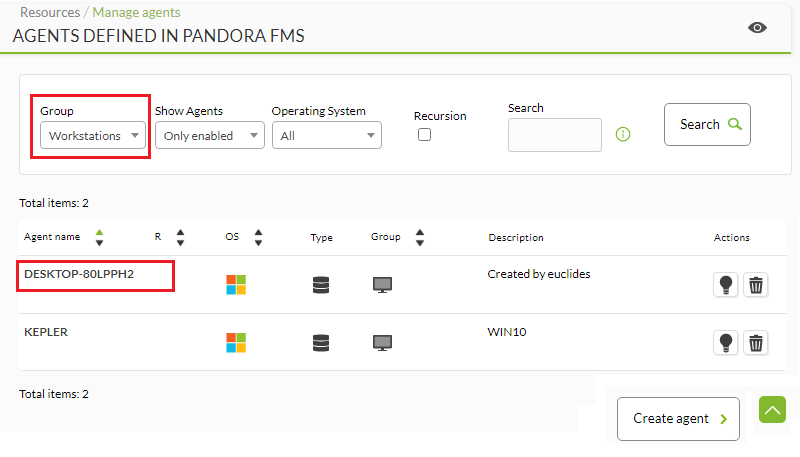](https://pandorafms.com/guides/public/uploads/images/gallery/2023-08/guia-rapida-windows2.png)** A faster and more efficient way to find the agent is to search directly through Pandora FMS search engine, indicating the agent's name. **[](https://pandorafms.com/guides/public/uploads/images/gallery/2023-08/guia-rapida-windows3.png)** By default, MS Windows® agent comes with several pre-loaded local basic monitoring modules, such as CPU load (CPU Load), % of RAM memory used (Memory\_Used), free space in MB on disks (DiskUsed), and so on. [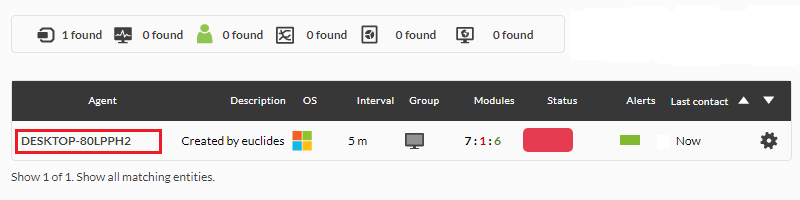](https://pandorafms.com/guides/public/uploads/images/gallery/2023-08/guia-rapida-windows4.png) If you need to add new modules to this agent, you may check the advanced documentation of [monitoring with EndPoints](https://pandorafms.com/manual/documentation/pandorafms/monitoring/02_operations "Installation"). You may see graphs generated with the module data history and a table with the module data history from this view by clicking on the icons marked in the following screenshot: [](https://pandorafms.com/guides/public/uploads/images/gallery/2023-08/guia-rapida-windows4.png) # Create a Visual Console with Monitoring Details One of Pandora FMS display options is Visual Consoles. These allow to represent monitoring information in real time in a full graphic way. In this Visual Console example, we will create a distributed network example around the world and we will see how when clicking on the node that appears over Spain, we can see another map of Spain with the elements from that particular installation. See: "Create Visual Consoles in Pandora FMS": https://www.youtube.com/watch?v=TIdsDbfBX5c&t=0s The power of maps lies on "summing up" the state of a child map in the parent map display; that is, if any of the elements displayed on the Spain map goes into critical state, the icon that represents Spain will become red. This allows establishing very customized hierarchies when it comes to showing information Maps may contain information about the state of groups, agents, modules. In addition, graphs and data may be included (numbers or text), in addition to text and icon tags. # Creating Map 1 (Parent) In this first map, the status of several agents distributed in a world map will be added. This can be done manually, one by one, or through the **Wizard**. To make its creation process easier we will use the **Wizard** in the example. The first thing to do is to create a new map, which we will call **World Map**. Go to **Operation → Topology maps → Visual Consoles** and click on **Create map**. [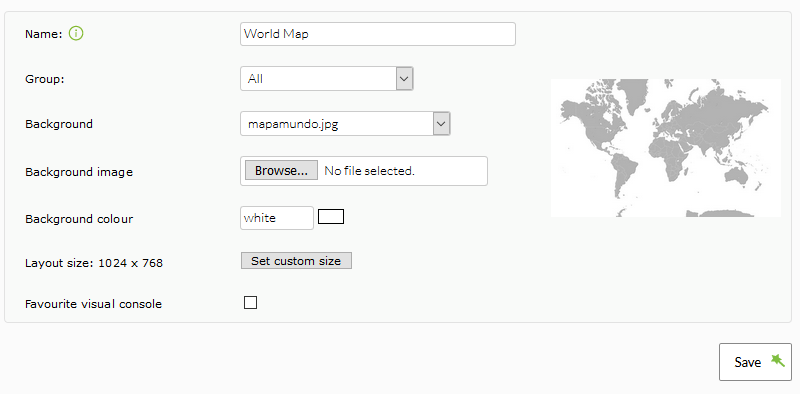](https://pandorafms.com/guides/public/uploads/images/gallery/2023-08/guia-rapida-consvisual2.png) Once created, click on the element **Wizard**: [](https://pandorafms.com/guides/public/uploads/images/gallery/2023-08/guia-rapida-consvisual2.png) In the **Wizard,** select the type of element, in this example **Static Graph**, the image to use, if you want to use one item per agent or per module (in this case per agent), and select the agents to add from the list that appears. [](https://pandorafms.com/guides/public/uploads/images/gallery/2023-08/guia-rapida-consvisual2.png) Click **Add** and all the elements created will appear: [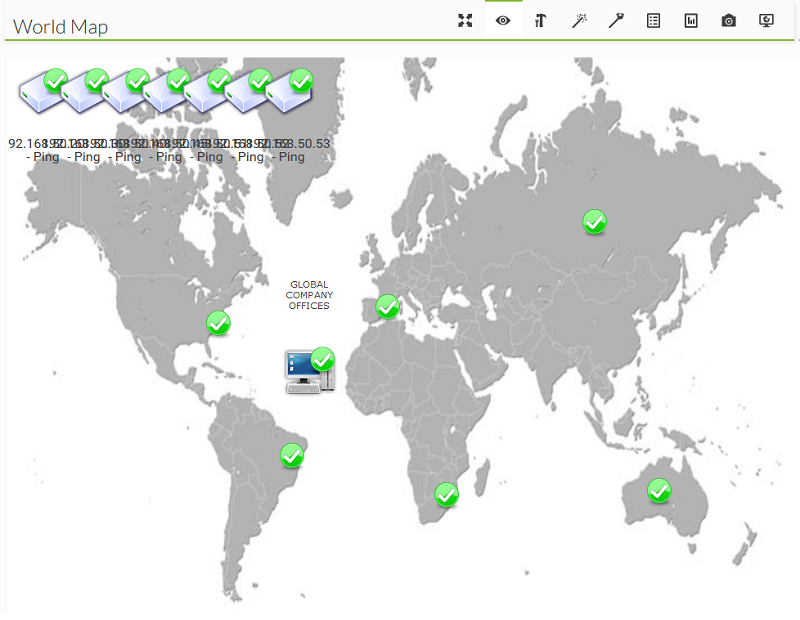](https://pandorafms.com/guides/public/uploads/images/gallery/2023-08/guia-rapida-consvisual5.png) Move all elements until you have them on the map, by clicking and dragging them. [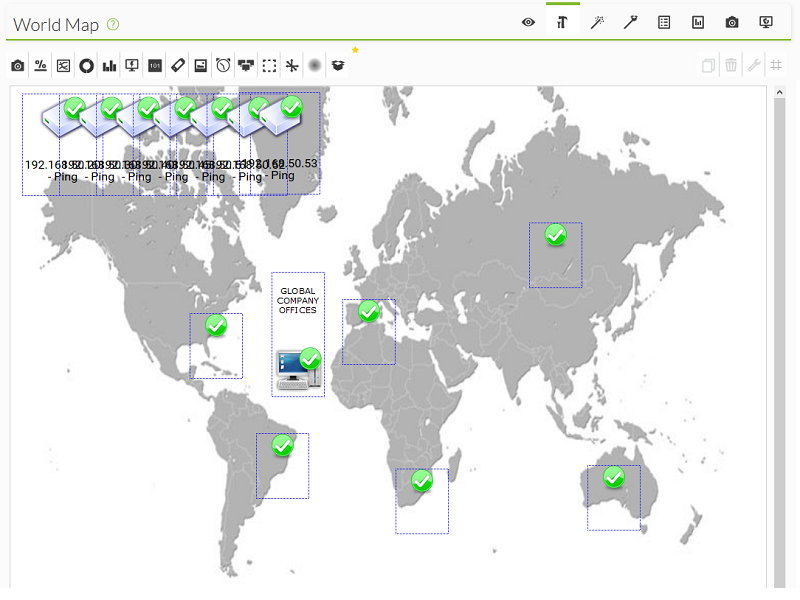](https://pandorafms.com/guides/public/uploads/images/gallery/2023-08/guia-rapida-consvisual6.png) # Creating Map 2 (Child) In the second map we will create an element that indicates the status of one of the main agents, linked to it all the given modules. A graph of the **FreeRAM** module of the same agent will also be displayed. The first step is to create the new map as you did in the previous step: [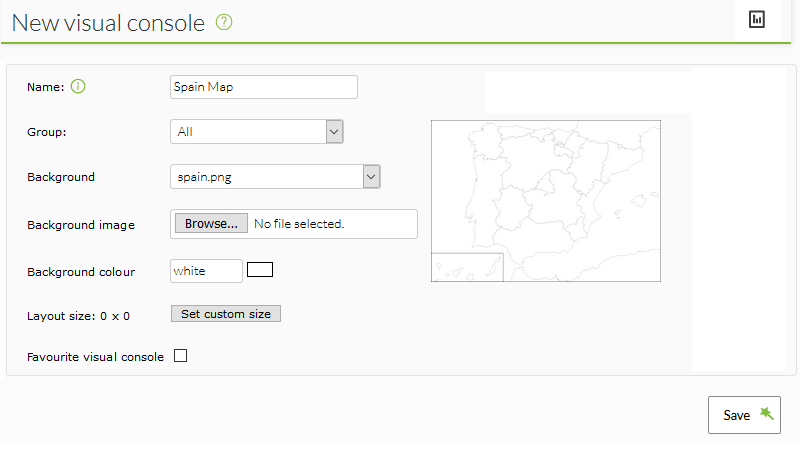](https://pandorafms.com/guides/public/uploads/images/gallery/2023-08/guia-rapida-spain1.png) Once created, add the element the agent status shows on section **Static Graph**: [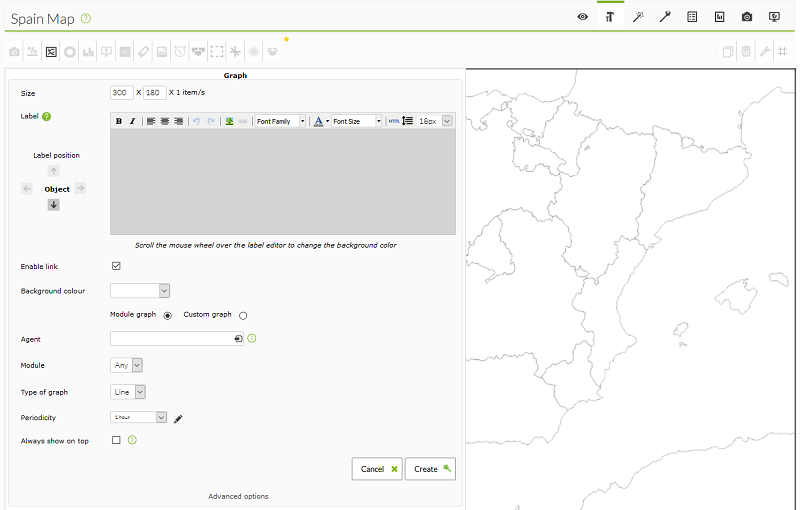](https://pandorafms.com/guides/public/uploads/images/gallery/2023-08/guia-rapida-spain2.png) Also create the graph with the attached configuration, by clicking on the graph icon, adding the agent and module the graph will reflect. After the main element of the map is created, now create a new element for each of the existing modules in the agent. Use the **Wizard** to configure it as you can see in the attached screenshot. Select **Static Graph** of the indicated agent and modules. Add as a label the name of the module and assign to this item a **parent** previously created in the Visual Map, in this case the previous element added. After creating all these elements, they will appear attached to the main element and you may drag them directly with the mouse to the desired position. [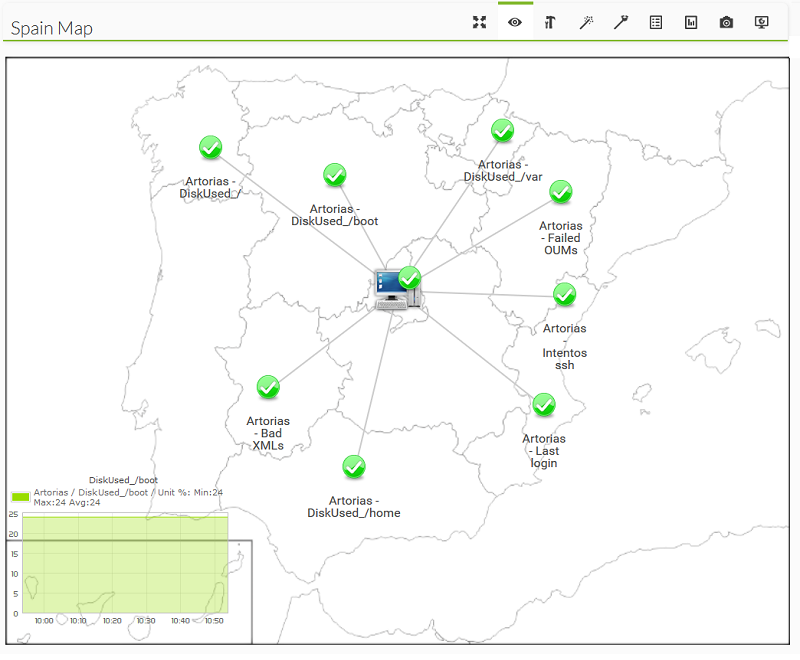](https://pandorafms.com/guides/public/uploads/images/gallery/2023-08/guia-rapida-spain5.png) # Linking Both Maps In the previous steps you created two maps. In this step will indicate how clicking on the element located on Spain in the **World Map**, opens directly the **Spain Map**. Open the **World Map**, in edit mode, by double clicking on the element `192.168.70.70`. The element edition will open, click on advanced options and on the **Linked Map** option, select **Spain Map**. Update the element (**Update** button). [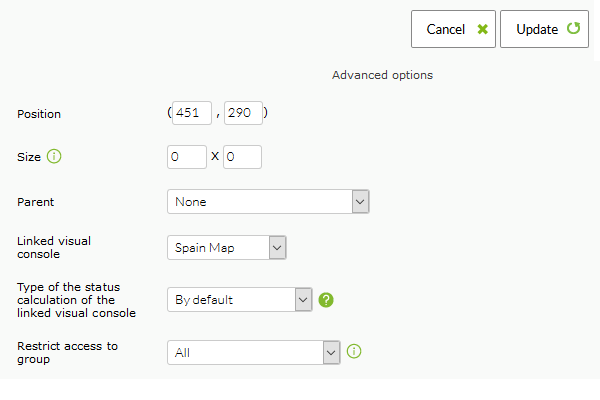](https://pandorafms.com/guides/public/uploads/images/gallery/2023-08/guia-rapida-link1.png) When you go back to the **World Map** view, click on the element located on Spain and the map of Spain will open directly. If there is only one red element on the Spain map, the icon representing Spain on the parent map will also be red. [](https://pandorafms.com/guides/public/uploads/images/gallery/2023-08/guia-rapida-spain5.png) # Adjust Monitoring In this section you may see how to configure some of the advanced options of a module (thresholds, units, others). # Module Advanced Properties Go to the agent modules view. [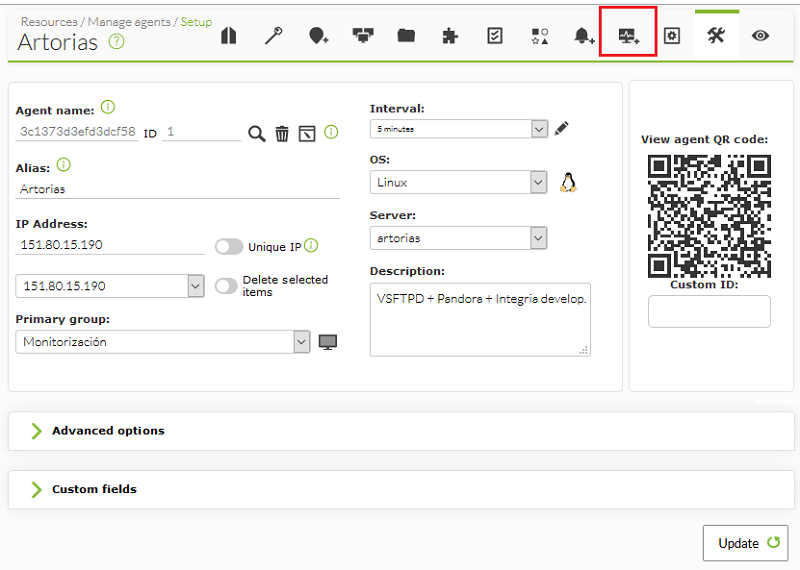](https://pandorafms.com/guides/public/uploads/images/gallery/2023-08/modulou.png) Select the module you wish to configure. [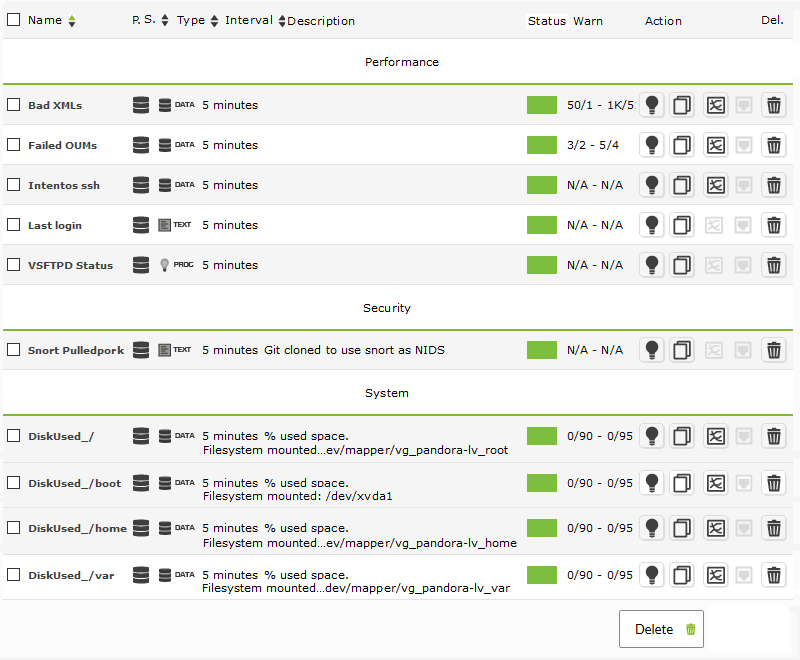](https://pandorafms.com/guides/public/uploads/images/gallery/2023-08/modulo-seleccionado-2.png) Then open the **Advanced Options** tab and proceed to configure the desired fields. [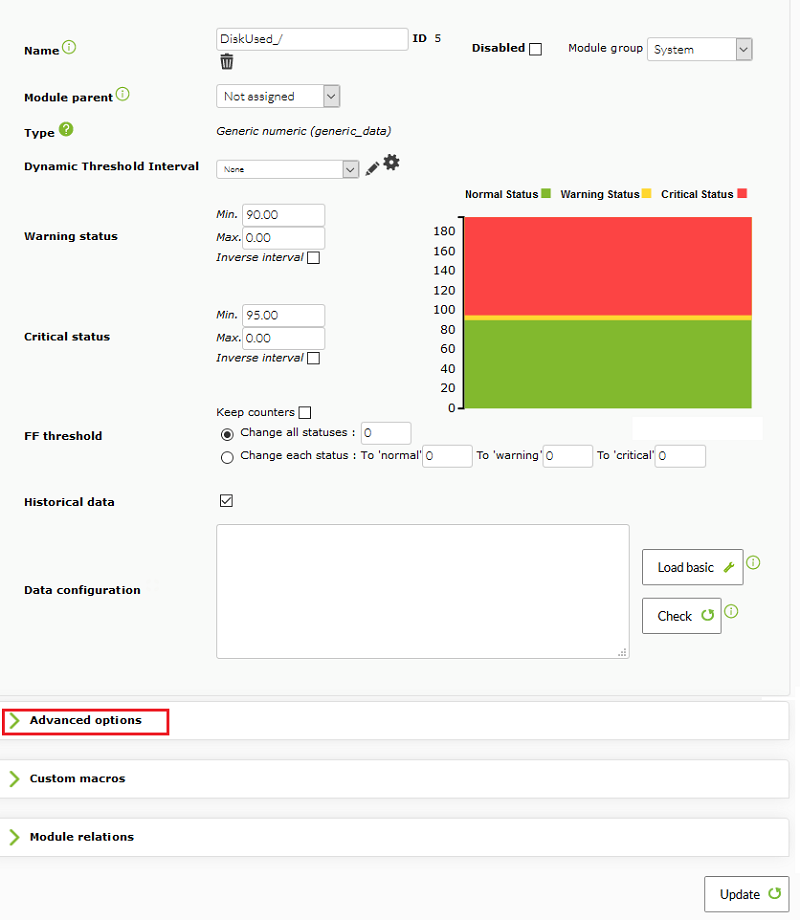](https://pandorafms.com/guides/public/uploads/images/gallery/2023-08/advanced.png) In the next two sections you will see how to configure the **Unit** and **Interval** fields and the **Warning Status** and **Critical Status** thresholds. # Module Unit Setup It allows to define the units of the data obtained in a module. This unit will be included in graphs and reports, so that it is easier to interpret the data displayed to the user. For example, if you have % as unit: Go to the **Unit** field and type the desired unit. [](https://pandorafms.com/guides/public/uploads/images/gallery/2023-08/unitu.png) Finally, click the **Update** button to save and verify that the unit is correctly displayed in the module view. # Module Interval Setup Configuring or modifying the module interval will define how often the module is executed. This affects remote modules (not running locally), since local modules are configured in a somewhat more complex way. **The more frequently a remote system is monitored, the more load it will generate on the system.** [](https://pandorafms.com/guides/public/uploads/images/gallery/2023-08/intervalou.png) Click **Update** and the module will be configured. # Module Threshold Setup In this section you will configure the **Warning** and **Critical** thresholds for a module with the values that a module must have to be in a `CRITICAL`, `WARNING` or `NORMAL` state. In this example you have a CPU module to add thresholds to. This module will always be in `NORMAL` (green) state as long as it is between 0% and 100%. If you want this module to be displayed in **Critical** or **Warning** status when the CPU reaches a certain percentage, you must configure it by determining the desired **Warning Status** and **Critical Status** thresholds. In this example for when the CPU reaches 90% usage the module will switch to **Warning** status and if it exceeds 95%, it will switch to **Critical**. [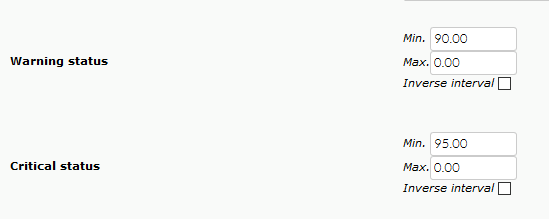](https://pandorafms.com/guides/public/uploads/images/gallery/2023-08/umbralesu.png) After configuring the thresholds, just click **Update** and the thresholds will be correctly configured. The next data received will already interpret these thresholds. # Threshold Advanced Parameters The **Inverse interval** checkbox is used to define non-contiguous ranges. In this example, the module will change to the critical state if the value is below 20 or above 80: [](https://pandorafms.com/guides/public/uploads/images/gallery/2023-08/quickguide-inverse1.png) In string modules, the threshold is defined as a substring. Similarly, it can be inverted so that the module goes into `CRITICAL` if it does **not** contain the substring passed as parameter: [](https://pandorafms.com/guides/public/uploads/images/gallery/2023-08/quickguide-inverse2.png) # Other Advanced Parameters Module configuration is very flexible, with dozens of possibilities. In Pandora FMS documentation you may discover all of them. # Troubleshooting. Where to Look at and Who to Ask # Configuration Files and Diagnosis Information Sources the main configuration files you may need to modify or check are the following: - `/etc/pandora/pandora_server.conf`: Main Pandora FMS server configuration file. If you modify something there, you will have to restart Pandora FMS server. - `/etc/pandora/pandora_agent.conf`: Main Pandora FMS EndPoint configuration file in Unix. If you modify something there, you will have to restart Pandora FMS agent. - `%ProgramFiles%\pandora_agent\pandora_agent.conf`: Pandora FMS EndPoint main configuration file in Windows. If you modify something there, you will have to restart Pandora FMS agent service. - `/etc/my.cnf`: Main MySQL server configuration file. - `/var/www/html/pandora_console/include/config.php`: Pandora FMS console configuration file. It is auto-configured in the installation, but if some environment parameter changed (path, IP, MySQL user/password, MySQL host) you will have to modify it manually. Information sources (*logs*) where you may look for more information, bugs, etc.: - `/var/log/pandora/pandora_server.log`: Server log file, which contains very important clues. If you wish to have more details, modify the **verbosity** parameter in the server configuration file to show more details. - `/var/log/pandora/pandora_server.error`: Server non-captured bug file, it contains traces of errors and exceptions nor handled by the server. - `/var/log/pandora/pandora_agent.log`: Unix agent log file. - `%PROGRAM_FILES%\pandora_agent\pandora_agent.log`: Windows® agent log file. - `/var/www/html/pandora_console/log/console.log`: Pandora FMS console log file. - `/var/log/httpd/error_log`: Apache server error log file (httpd). - `/var/log/messages`: System log file. - **dmesg**: Command that shows kernel warnings. - `/var/log/pandora/pandora_snmptrap.log`: SNMP trap log. If there is any error in the SNMP trap console booting, it may show bug traces. - `/var/log/mysqld.log`: MySQL log. - `/var/log/pandora/web_socket.log`: **Websocket** log. - `/var/www/html/pandora_console/log/cron.log`: **Cron** log. Permissions from some directories: - `/var/spool/pandora/data_in/` must be from `pandora:apache` with permissions `755`. - `/var/log/pandora/` must be from `pandora:root` with permissions `755`. - `/var/www/html/pandora_console/include/config.php` must be from `apache:apache` with permissions `600`.In versions prior to **747**, the console log storage path is: `/var/www/html/pandora_console/pandora_console.log`
In case of updating by **OUM** the [corresponding](https://pandorafms.com/manual/) **logrotate** file must be modified. # Support The community forum is open to anyone, you may create an account and ask any questions you have: - [https://pandorafms.com/community/](https://pandorafms.com/community/). We have a set pf frequently asked questions in the knowledge base that may give you a clue or solve a specific problem you may be having: - [https://pandorafms.com/community/knowledge-base/](https://pandorafms.com/community/knowledge-base/). Of course there is also the training option, by means of our official Pandora FMS courses (certified): - [https://pandorafms.com/en/training](https://pandorafms.com/en/training).