Proxmox
This document describes the Proxmox functionality of PandoraFMS discovery.
- Introduction
- Compatibility matrix
- Pre requisites
- Parameters and configuration
- Manual execution
- Discovery
- Agent and modules generated by the plugin
Introduction
The purpose of this plugin is to monitor Proxmox, through relevant metrics such as memory, cpu and disks of the existing machines in the proxmox environment.
The plugin connects to the Proxmox API and monitors Nodes, lxc Containers or virtual machines by means of the previously mentioned metrics, generating an agent for each region via XML that it sends to the pandora server.
Compatibility matrix
| Systems where tested | Rocky linux, Fedora 34 |
| Systems where it works | Any linux system |
Pre requisites
- Proxmox API Connectivity
The plugin is a binary that contains the packaged dependencies so there is no need to install any dependencies to use it.
Parameters and configuration
Parameter
| --conf | Path to configuration file |
Configuration file (--conf)
agents_group_name = < Name of the target group for the created agents >
interval = < Interval in seconds for the agents and for the metrics analysis >
temporal = < Path in which the temporary files will be created >
transfer_mode = < Transfer mode, tentacle or local >
tentacle_client = < Tentacle client path, by default "tentacle_client" > tentacle_ip = < Tentacle client path, by default "tentacle_client" > tentacle_ip = < IP
tentacle_ip = < IP of the target machine for the created agents >
tentacle_port = < Port of tentacle, default : 41121 >
tentacle_opts = < Additional tentacle client options >
data_dir = < (Only enabled if transfer_mode is local) Destination path for each agent's XML, by default "/var/spool/pandora/data_in/" >

prefix = < Prefix for created agents >

host = < proxmox host >
user = < proxmox user >
password = < proxmox password >
port = < proxmox port >

proxmox_token_name = < Proxmox API token name >
proxmox_token_pass = < Proxmox API token password >

scan_nodes = < Enable with 1 to enable generalized node monitoring >
scan_backups = < Enable with 1 to enable generalized backups monitoring >
scan_vms = < Enable with 1 to enable generalized vms monitoring >
scan_lxc = < Enable with 1 to enable generalized lxc monitoring >
scan_data_center = < Enable with 1 to enable generalized data center monitoring >
scan_storage = < Enable with 1 to enable generalized storage monitoring >

discard_nodes = < List with Nodes to discard from monitoring >

# The following parameters are only required for the use of custom fields.

pandora_url = < Url of pandora >
api_pass = < Password for the api >
api_user = < User of the api >
api_user_pass = < Password for the api user >
Example
agents_group_name  = proxmox
interval           = 300
temporal           = /tmp/
transfer_mode      = tentacle
tentacle_client    = tentacle_client
tentacle_ip        = 172.42.42.101
tentacle_port      = 41121
tentacle_opts      = ""
data_dir           = /var/spool/pandora/data_in/

prefix             = Proxmox.

pandora_url        = http://172.42.42.101/pandora_console
api_pass           = 1234
api_user           = admin
api_user_pass      = pandora

host               = 192.168.80.134
user               = root@pam
password           = A34mS!
port               = 8006

proxmox_token_name = token auth
proxmox_token_pass = f230051c-0252-1600-8f32-b65d16cf3181

scan_nodes         = 1
scan_backups       = 1
scan_vms           = 1
scan_lxc           = 1
scan_data_center   = 1
scan_storage       = 1

discard_nodes      = ["Node4","Node7"]
Manual execution
The format of the plugin execution is as follows:
./pandora_proxmox --conf < path to configuration file >For example :
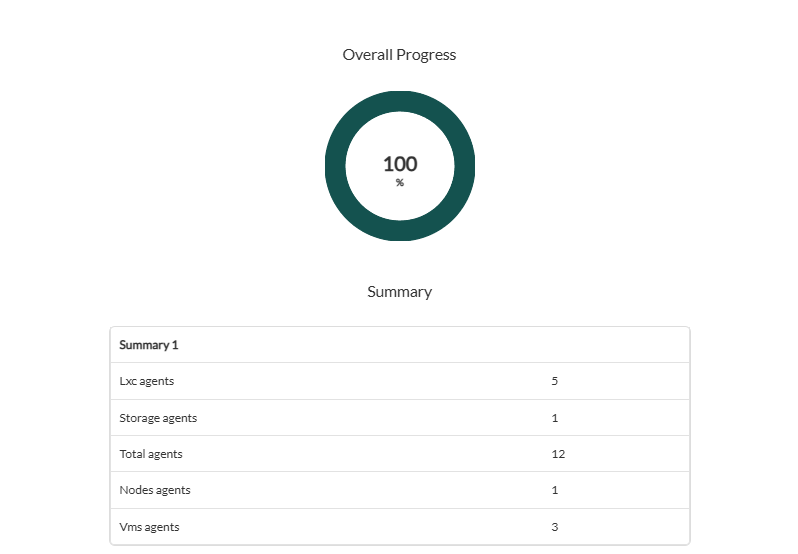
./pandora_proxmox --conf /usr/share/pandora_server/util/plugin/proxmox.confThe execution will return an output in JSON format with information about the execution, and will generate an XML file for each agent of each monitored region that will be sent to the Pandora FMS server by the transfer method indicated in the configuration.
For example:
{"summary": {"Total agents": 5, "Nodes agents": 1, "Vms agents": 2, "Lxc agents": 1, "Storage agents": 3}}Discovery
This plugin can be integrated with Pandora FMS Discovery.
To do so, you must load the ".disco" package that you can download from the Pandora FMS library:
https://marketplace.pandorafms.com/entries/pandorafms.proxmox
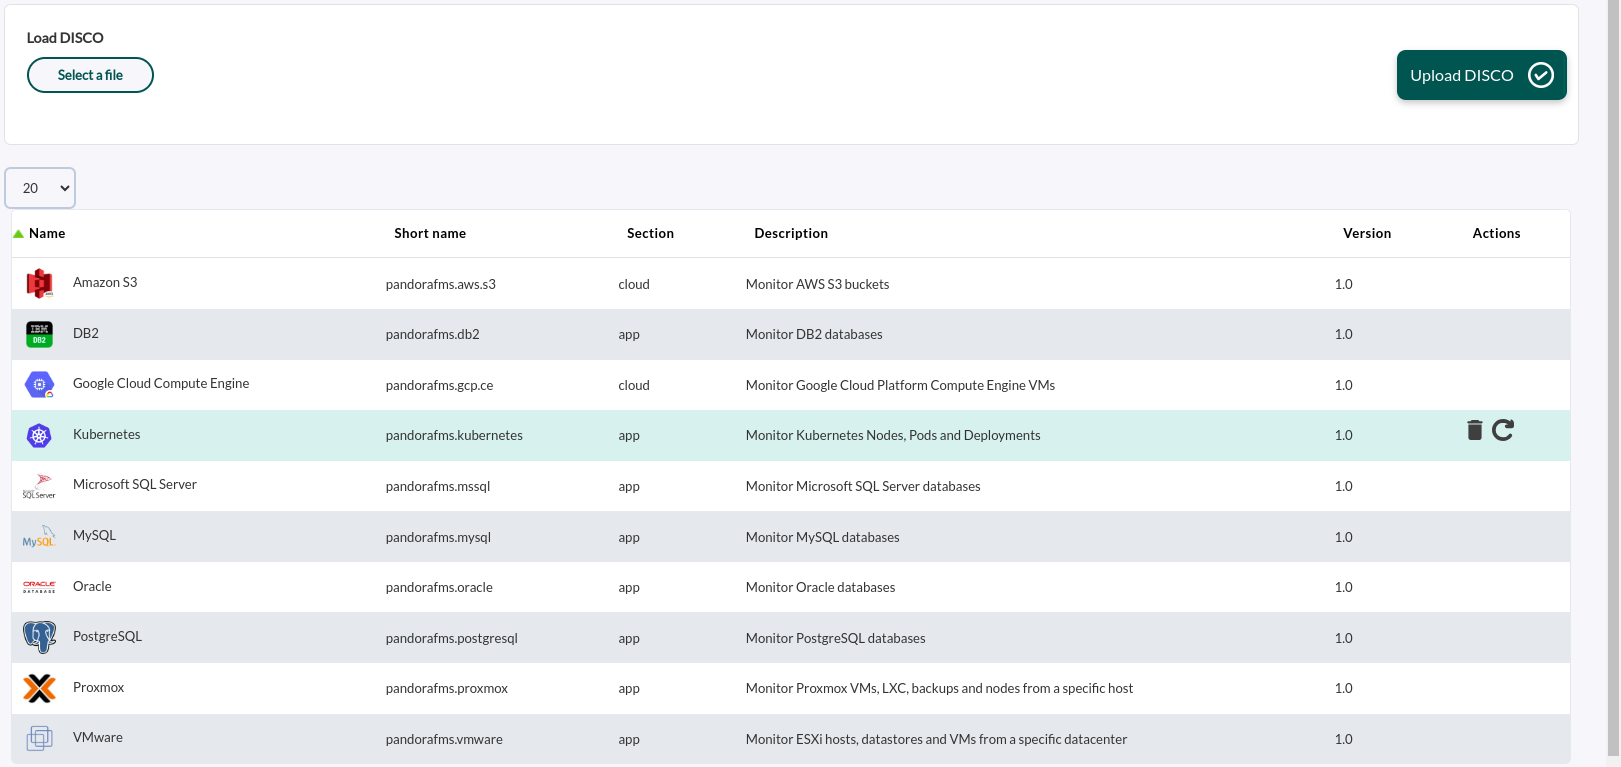
Once loaded, Proxmox environments can be monitored by creating Discovery tasks from the Management > Discovery > Apps section.
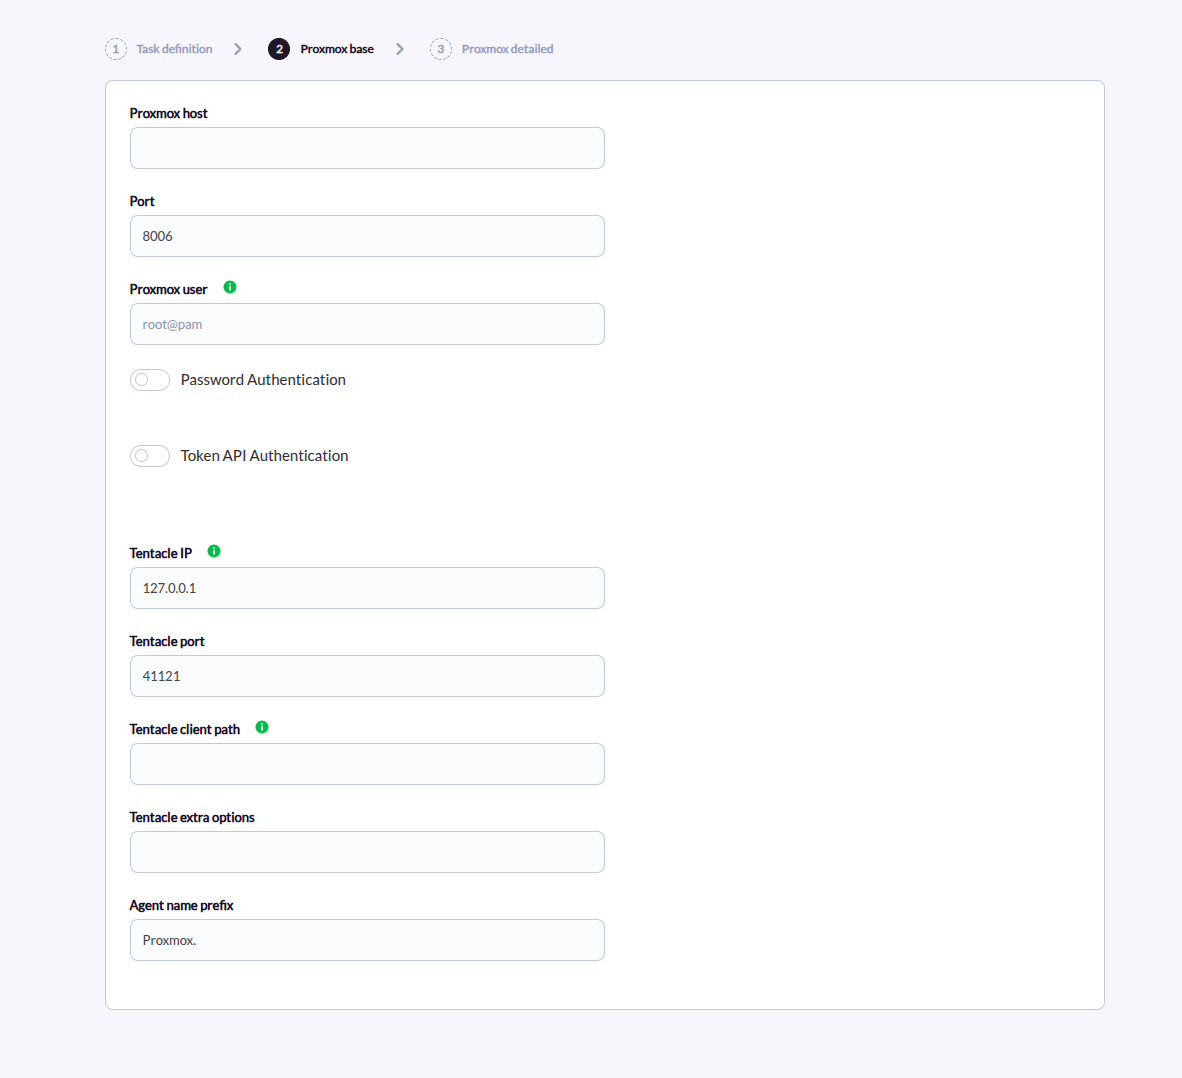
The following minimum data will be requested for each task:
- Proxmox host: Proxmox IP.
- Port: Proxmox port (8006 by default).
- Proxmox user: Proxmox user
- Password Authentication: Click to enable password authentication
- Password: proxmox password
- API token: Authentication: Click to enable authentication via API token
- Token Name: API token name
- Token Password: API token password
- Tentacle IP: Tentacle IP
- Tentacle port: Tentacle port
- Tentacle extra options: Tentacle extra options
- Tentacle client path: Tentacle custom path
- Agent name prefix: Prefix for the name of the generated agents.
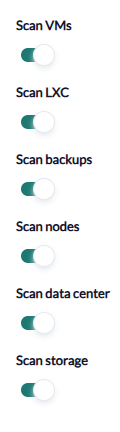
It will also be possible to adjust the task settings to customize the desired monitoring:
- Scan VMs : Activate to enable monitoring of virtual machines.
- Scan LXC: Activate to enable monitoring of LXC containers.
- Scan backups: Activate to enable backup monitoring.
- Scan nodes: Activate to enable node monitoring.
- Scan Data center: Activate to enable data center monitoring.
- Scan Storage: Activate to enable storage monitoring.
The successfully completed tasks will have an execution summary with the following information:
- Total agents : Total number of agents generated by the task.
- Vms agents : Total number of vms agents created by the task.
- LXC agents : Total number of lxc containers agents created by the task.
- Nodes Agents : Total number of node agents created by the task.
- Storage Agents: Total number of storage agents created by the task.
Agent and modules generated by the plugin
The plugin execution will create the following agents and modules:
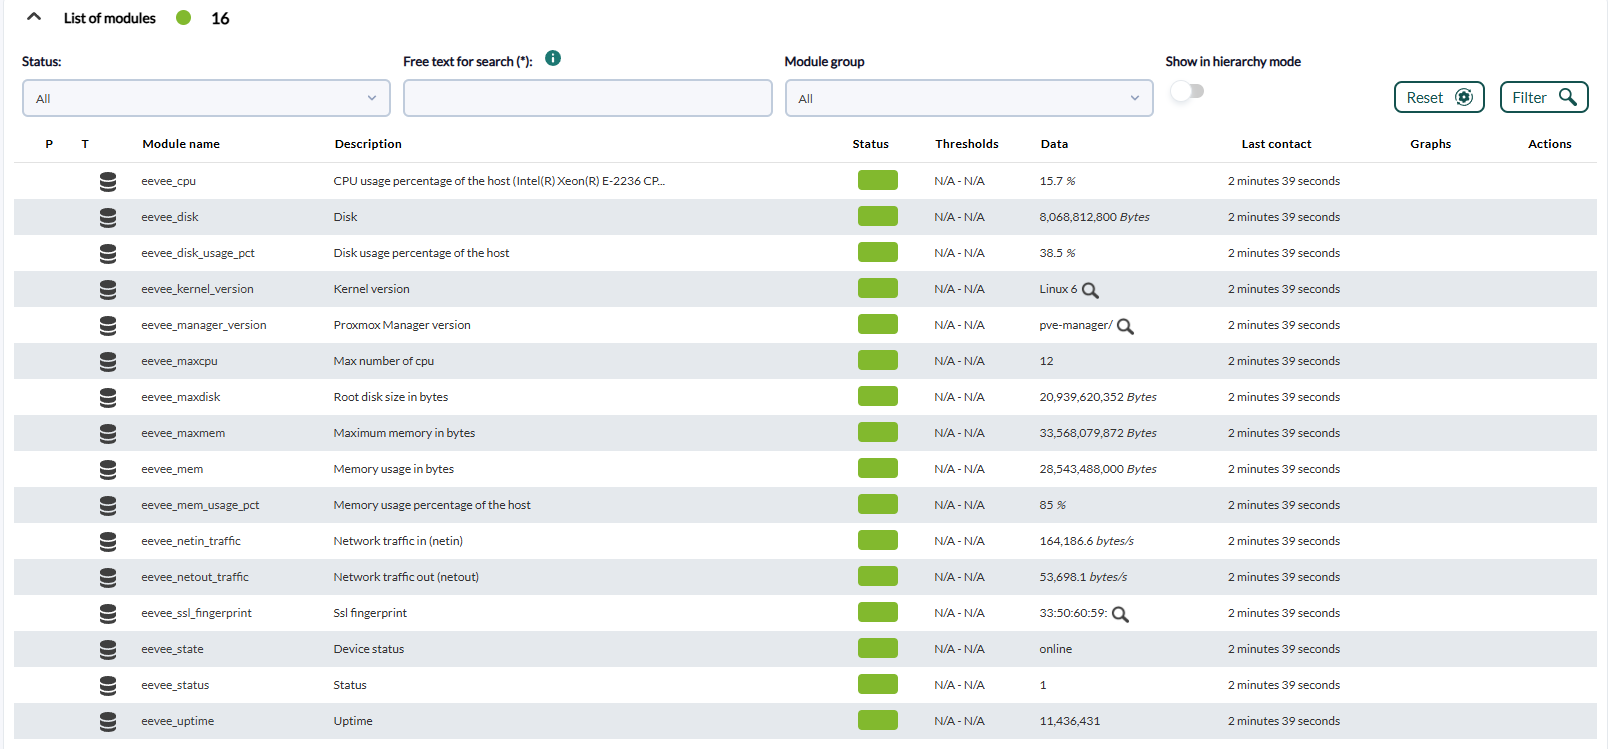
- One agent for each Node with the following modules :
| status |
| state |
| uptime |
| maxdisk |
| maxcpu |
| maxmem |
| disk |
| cpu |
| mem |
| ssl_fingerprint |
| disk_usage_pct |
| kernel_version |
| manager_version |
| mem_usage_pct |
| netin_traffic |
| netout_traffic |
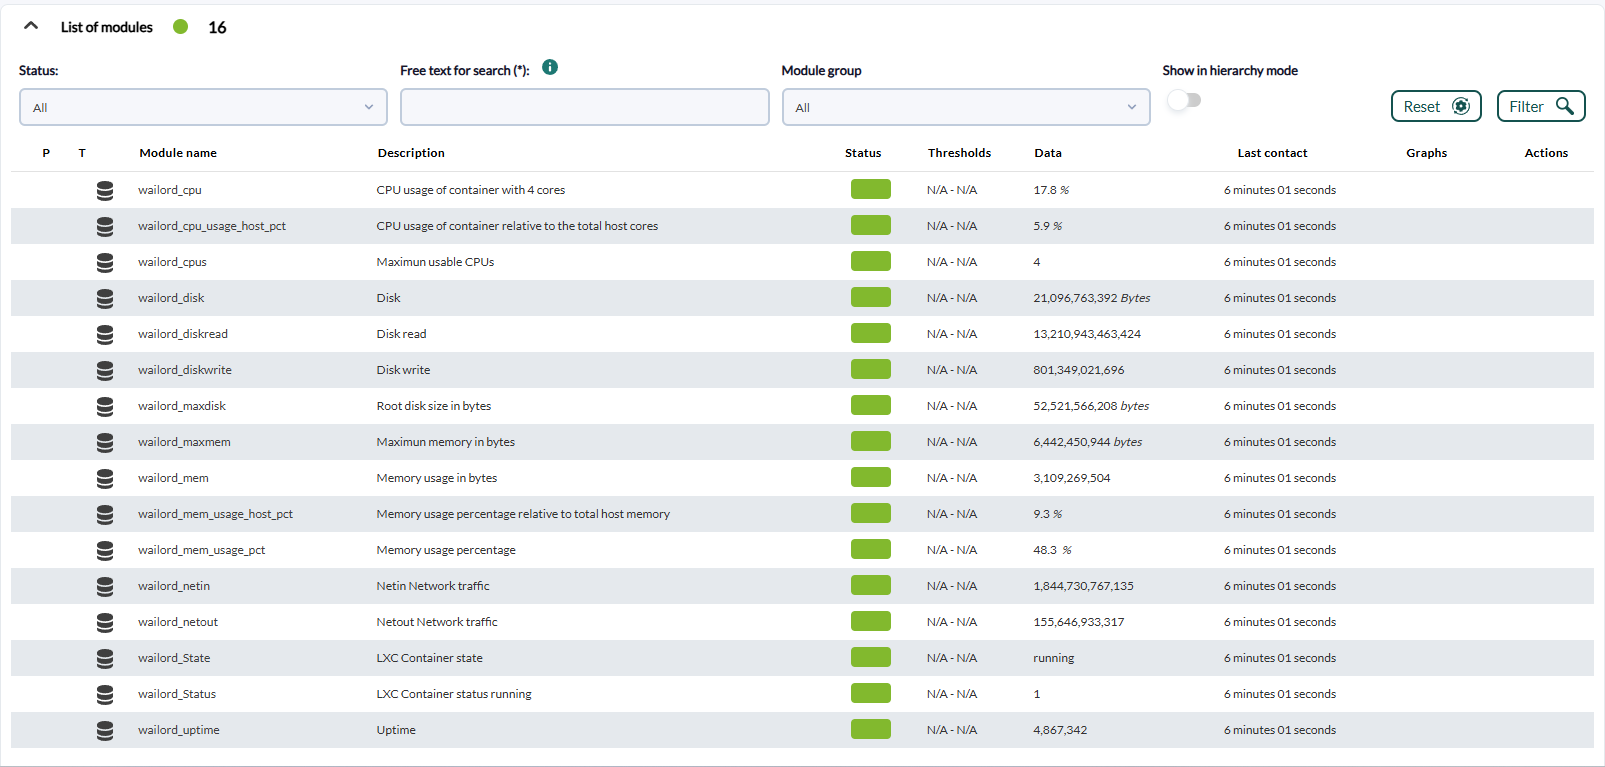
- One agent per virtual machine and per lxc container with the following modules :
Lxc
| status |
| state |
| cpus |
| cpu |
| mem |
| disk |
| diskread |
| diskwrite |
| maxdisk |
| maxmem |
| netin |
| netout |
| uptime |
| men_usage_host_pct |
| men_usage_pct |
| cpu_usage_host_pct |
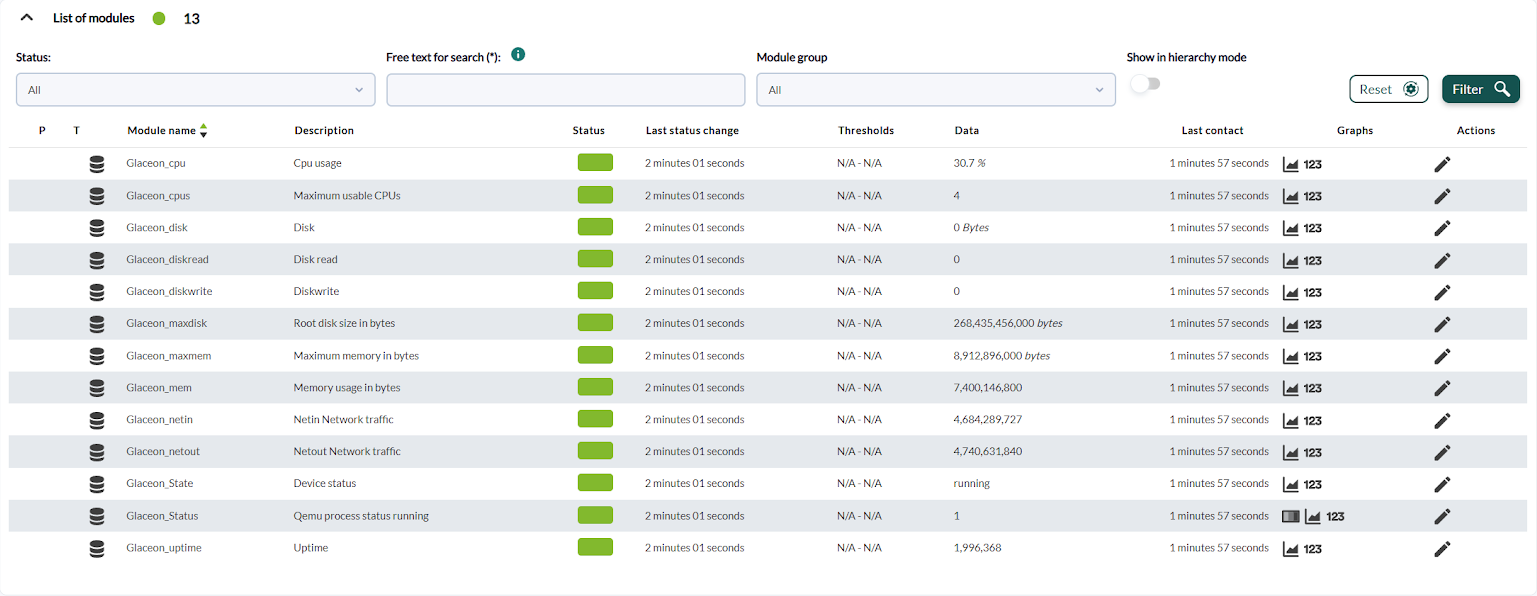
virtual machine (VM)
| status |
| state |
| cpus |
| cpu |
| mem |
| disk |
| diskread |
| diskwrite |
| maxdisk |
| maxmem |
| netin |
| netout |
| uptime |
| men_usage_host_pct |
| men_usage_pct |
| cpu_usage_host_pct |
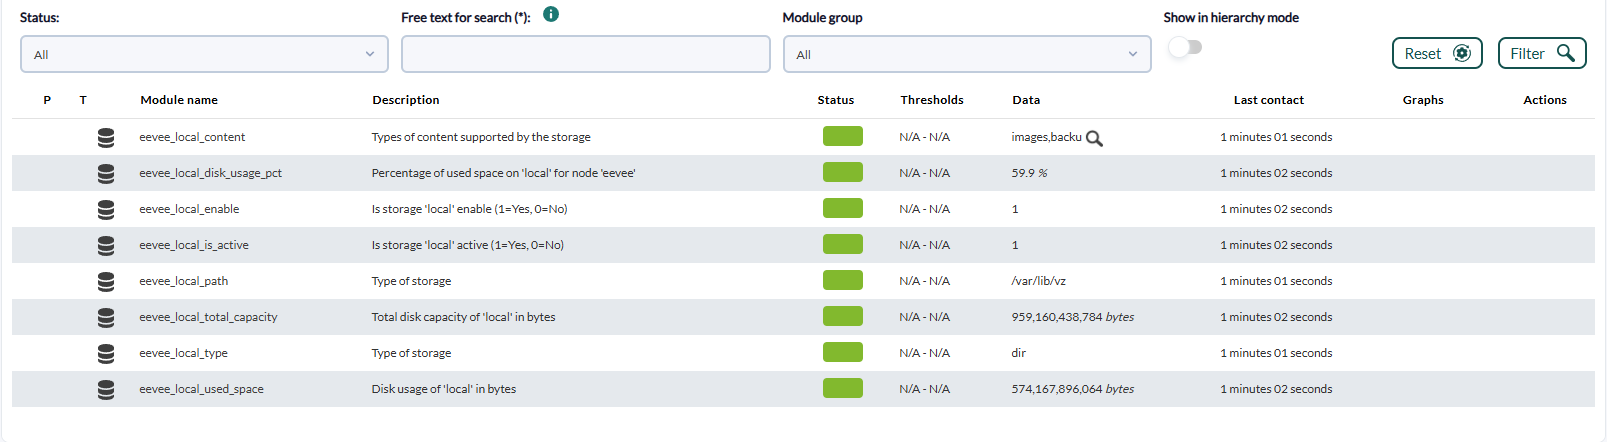
- One agent per storage defined in Proxmox and generate a series of modules:
| content |
| disk_usage_pct |
| enable |
| is_active |
| path |
| total_capacity |
| type |
| used_space |
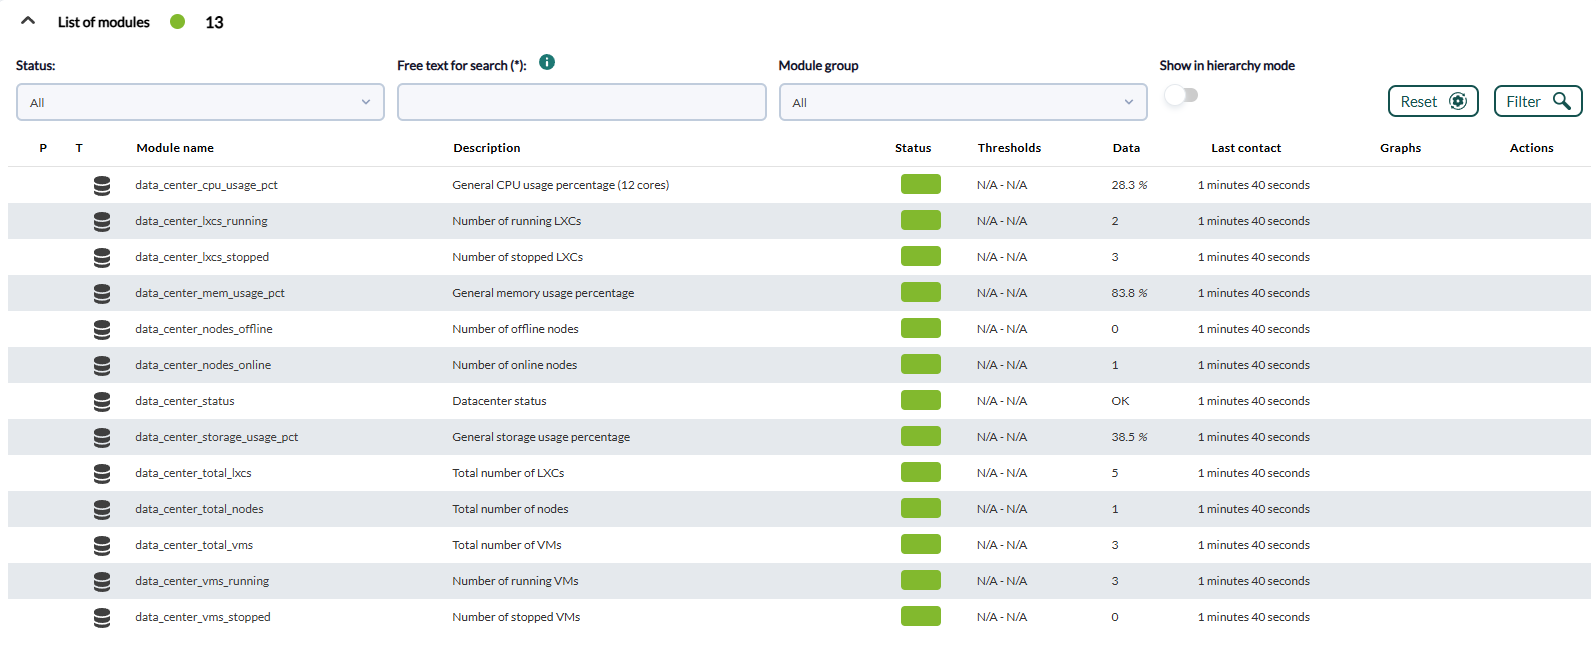
- An agent for data centers: which will have a series of modules associated with the summary
| cpu_sage_pct |
| lxc_running |
| lxc_stopped |
| mem_usage_pct |
| nodes_offline |
| nodes_online |
| status |
| storage_usage_pct |
| total_lxc |
| total_nodes |
| total_vm |
| vm_runnig |
| vm_stopped |
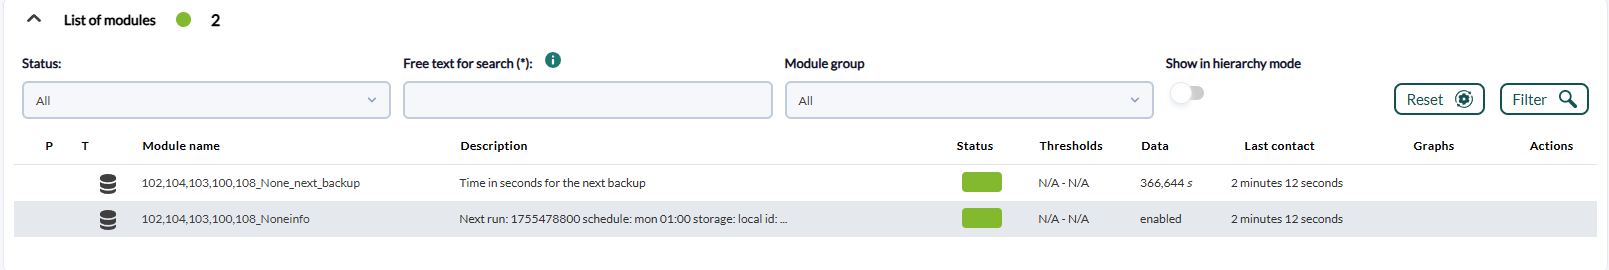
- A backup agent that will have a module for each backup with the following data
(general information):
Name: vmid,node_backup_info.
Description: next_run,schedule,storage,backup_id,repeat-missed
value: enabled or disabled
And also has another module that will show how much time is left for the next backup in seconds:
Name: vmid, node_backup_info
Description: Time in seconds to the next backup
value: seconds left for the next backup\