# Proxmox
# Introduction
Ver. 29-11-2022
Plugin to monitor proxmox, being able to extract API data from nodes, backups, virtual machines, lxc containers and storage.
Type: Server plug-in
# Compatibility matrix
| **Systems where tested** | CentOS 7, Fedora, rocky linux
|
| **Systems where it should work** | Any linux system
|
# Pre requisites
- Pandora FMS Data Server enabled
- Have Pandora FMS Plugin Server enabled.
# Parameters
**Proxmox parameters**
| --host | Ip or proxmox host |
| --user | Name of the proxmox user who will perform the queries |
| --password | Password of the proxmox user who will perform the queries |
| --port | Default 8006 |
| --vm | To obtain data from the virtual machines, 1 to activate 0 to deactivate |
| --lxc | Get data from lxc containers, 1 to activate 0 to deactivate |
| --backups | Extract data from backups, 1 for on 0 for off |
| --nodes | Get data from nodes, 1 to activate 0 to deactivate |
| --discard\_node | Discard a node name for vm and lxc monitoring |
**Pandora configuration parameters**
| --transfer\_mode | Tentacle or local, default : local |
| --tentacle\_port | Tentacle port (default 41121) (optional) |
| --tentacle\_address | Ip of the tentacle server to send the data to (optional) |
| -g,--group | Pandora FMS target group (optional) |
| --data\_dir | Pandora FMS data directory. **By default** it is */var/spool/pandora/data\_in/* (optional) |
| --as\_discovery\_plugin | To be executed in 'discovery' mode, the execution will display a json in the output with information about the monitoring. |
Monitorable backups are at cluster level, backups at vm or lxc container level will be included in a future update.
# Manual execution
```shell
./pandora_proxmox \
--host < host > \
--user < user > \
--password < password > \
[ --port < port > ] \
[ --vm < 1 or 0 > ] \
[ --lxc < 1 or 0 > ] \
[ --backups < 1 or 0 > ] \
[ --nodes < 1 or 0 > ] \
[ --transfer_mode < local o tentacle > ] \
[ --tentacle_port < tentacle_port > ] \
[ --tentacle_address < tentacle_address > ] \
[ -g < group > ] \
[ --data_dir < data dir > ] \
[ --as_discovery_plugin < 1 o 0 > ] \
[ --discard_node < node name > ]
```
**Normal execution**
[](https://pandorafms.com/guides/public/uploads/images/gallery/2023-08/image-1692176723830.png)
**Discovery execution**
[](https://pandorafms.com/guides/public/uploads/images/gallery/2023-08/image-1692176712131.png)
# Configuration in PandoraFMS
**As server plugin**
**Manual installation**
Go to servers > plugins:
[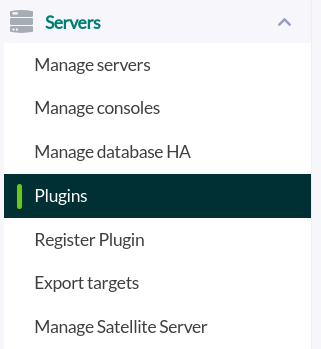](https://pandorafms.com/guides/public/uploads/images/gallery/2023-07/image-1689159088296.png)
Click on "add plugin":
[](https://pandorafms.com/guides/public/uploads/images/gallery/2023-07/image-1689159095782.png)
We put in name and the description that is preferred.
We put as command the execution with the path of the plugin:
```
/path_pandora_proxmox
```
Remember that the recommended path for the use of the server plugins is: /usr/share/pandora\_server/util/plugin/
And in parameters of the plugin we will introduce these followed by the macro "\_field<N>\_", the parameters of connection, --host, --user and --password are obligatory, by default the plugin has activated the extraction of data of lxc\_containers,VMs, nodes and backups, can be deactivated for custom monitorization.
Once this is done, we will click on "create".
Once this is done, the only thing left to do is to call it, so we will go to some agent's view and create an add-in module:
[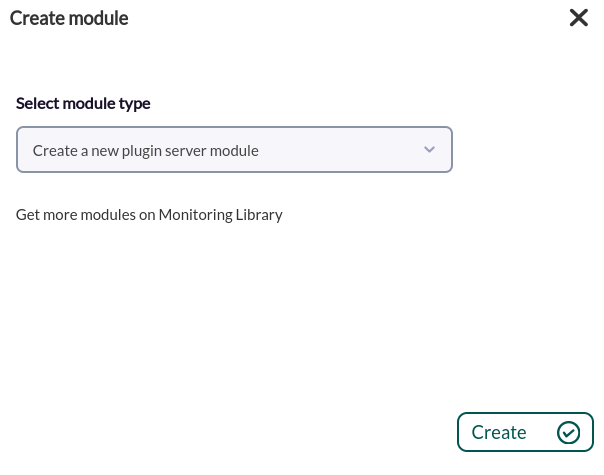](https://pandorafms.com/guides/public/uploads/images/gallery/2023-07/image-1689159120014.png)
We will give it a name and in the section "plugin" we will put the one we have just configured.
Once this is done, click on create.
If the module is shown with 1, it means that it is running correctly.
# Modules generated by the plugin
The plugin with all parameters enabled will return the following:
One agent for each node with the following modules:
| maxdisk |
| uptime |
| status |
| maxcpu |
| disk |
| mem |
| maxmem |
| cpu |
|
One agent for each **virtual machine** and for each **lxc container** of the node with the following modules:
| status |
| netout |
| diskread |
| cpu |
| disk |
| mem |
| netin |
| uptime |
| maxmem |
| maxdisk |
| diskwrite |
| cpus |
A backup agent that will have a module for each backup with the following data (general information):
Name: vmid,node\_backup\_info.
Description: next\_run,schedule,storage,backup\_id,repeat-missed
value: enabled or disabled
And also has another module that will show how much time is left for the next backup in seconds:
Name: vmid, node\_backup\_info
Description: Time in seconds for the next backup
value: seconds left for the next backup