Prometheus
This document describes the Prometheus functionality of PandoraFMS, consisting of the discovery plugin.
- Introduction
- Pre requisites
- Parameters and configuration
- Manual execution
- Discovery
- Agent and modules generated by the plugin
Introduction
This plugin is designed to monitor Prometheus through custom queries that extract key information to evaluate service performance and status. The data obtained is reflected in Pandora FMS in the form of modules that provide statistical values within one or more agents, depending on the configuration.
Pre requisites
- Connectivity to the Prometheus instance
The plugin is a binary that contains the packaged dependencies, so no dependencies need to be installed in order to use it.
Parameters and configuration
Parámeters
| --conf | Path to the configuration file |
Configuration file (--conf)
[CONF]
agents_group = < Group ID for agents >
interval = < Agent creation interval >
prefix = < Prefix for created agents >
agent_name = < Main agent name. Default: Prometheus >
url = < Prometheus instance URL. For example: http://172.0.1.3:9090>
username      = < Username for the instance. Only necessary if basic authentication is configured >
password      = < Password for the instance. Only necessary if basic authentication is configured >
transfer_mode = < Transfer mode for agents. Options: tentacle and local >
tentacle_ip   = < IP address of tentacle >
tentacle_port = < Port of tentacle >
tentacle_opts = < Extra tentacle options >
temporal      = < Temporary file path >

[QUERIES]

< Metric name > = < Custom query >

[THRESHOLDS]

< Metric name > = < Desired thresholds in the module, separated by “|” >

[AGENTS]

< Metric name > = < Name of the new agent. All metrics that do not specify an agent will be included in the main agent >
Example
[CONF]
agents_group  = 17
interval      = 300
prefix        = "Kube-"
agent_name    = Prometheus
username      = admin
password      = admin123
tentacle_ip   = 172.42.42.101
tentacle_port = 41121

[QUERIES]
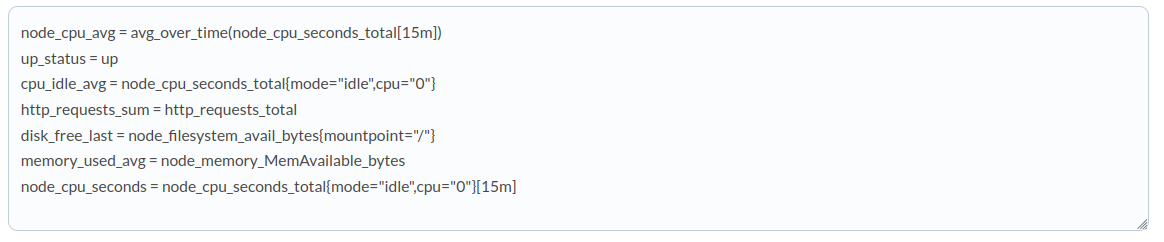
node_cpu_avg = avg_over_time(node_cpu_seconds_total[15m])
up_status = up
cpu_idle_avg = node_cpu_seconds_total{mode="idle",cpu="0"}
http_requests_sum = http_requests_total
disk_free_last = node_filesystem_avail_bytes{mountpoint="/"}
memory_used_avg = node_memory_MemAvailable_bytes
node_cpu_seconds = node_cpu_seconds_total{mode="idle",cpu="0"}[15m]

[THRESHOLDS]
cpu_idle_avg = min_critical 75|min_warning 60

[AGENTS]
node_cpu_seconds = Prometheus cpu
Manual execution
The format for executing the plugin is as follows:
./pandora_prometheus --conf < path to configuration file >For example:
./pandora_prometheus --conf ./pandora_prometheus --conf /usr/share/pandora_server/util/plugin/prometheus.confThe execution will return output in JSON format with information about the execution, and will generate an XML file for each monitored agent that will be sent to the Pandora FMS server using the transfer method specified in the configuration.
Discovery
This plugin can be integrated with Pandora FMS Discovery.
To do so, you must load the “.disco” package, which can be downloaded from the Pandora FMS library:
https://marketplace.pandorafms.com/
Once loaded, Prometheus instances Discovery tasks from the Management > Discovery > App section.
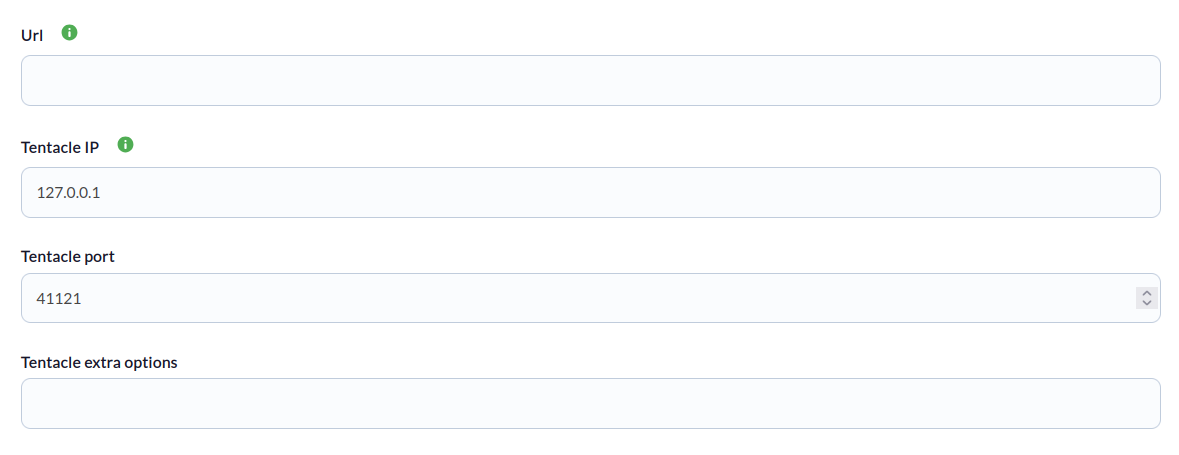
For each task, the following minimum information will be requested:
- Url: Prometheus instance URL
- Tentacle IP: Tentacle address
- Tentacle port: Tentacle port
- Tentacle extra options: Tentacle extra options
On the next page, we will be asked for the following:
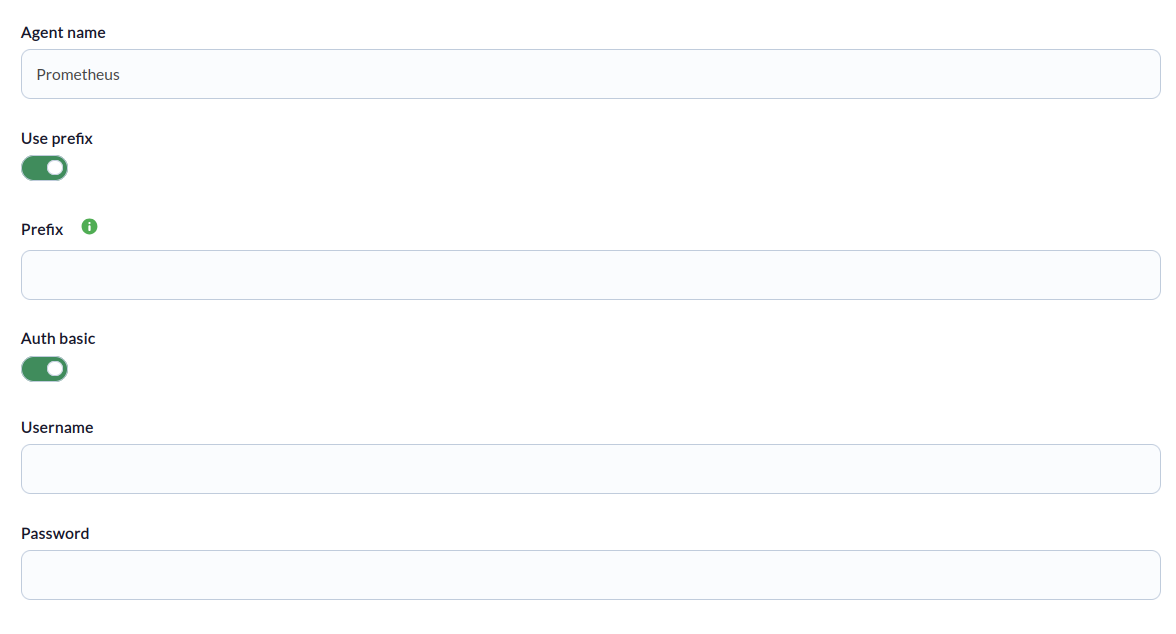
- Agent Name: Name for the principal agent
- Use prefix: Prefix for created agents
- Prefix: Prefix for created agents
- Auth basic: Enable for basic authentication check
- Username: User for the prometheus instance (only required if basic authentication is configured)
- Password: Password for the prometheus instance (only required if basic authentication is configured)

- Custom queries: Here you can define custom queries. The format is one query per line and is as follows: < Metric name > = < Custom query >. For example:

- Define tresholds: Here you can define the thresholds for the modules generated by custom queries. The format is a definition of thresholds per line and is as follows: < Desired thresholds in the module, separated by “|” >. For example:

- Define agents: Here you can define the creation of agents for modules generated by custom queries. The format is one definition per line and is as follows: < Name of the new agent. All metrics that do not specify an agent will be included in the main agent >. For example:

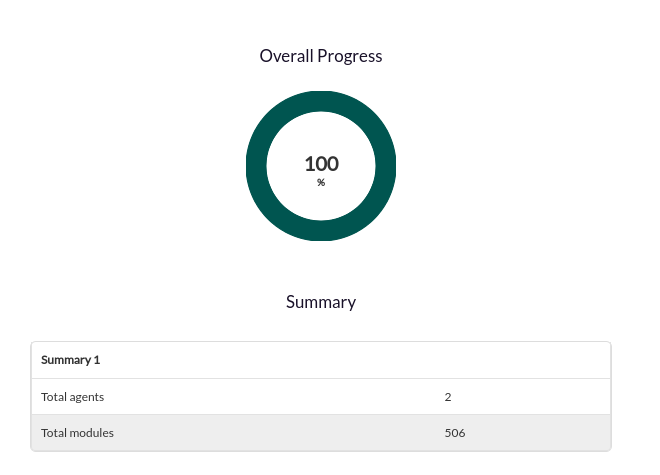
 Successfully completed tasks will have an execution summary with the following information:
- Total agents : Total number of agents generated by the task.
- Total modules: Total number of modules generated by the task.
Agent and modules generated by the plugin
The plugin will create a main agent that will contain all specific metrics that are not assigned to an agent. The plugin will create an agent for different metrics if specified in the configuration.
- If a custom query returns metrics for more than one object, the integration will create a module for each object metric returned in the response.
- If a custom query returns only one metric for the object, the generated module will be generic_data and will contain the value returned by the response.
- If a custom query returns multiple metrics for a single object, the generated module will be generic_data_string and will have a list with the values obtained associated with the timestamp of each value.