Pour pouvoir réaliser ce type de surveillance, il est impératif que le protocole SNMP soit configuré sur le périphérique distant. Cela nécessite généralement d'être activé avec une configuration minimale permettant la consultation des données.
Les périphériques SNMP permettent de configurer les adresses IP autorisées à effectuer des requêtes ainsi que la *communauté* avec laquelle ces requêtes seront réalisées.La plupart des périphériques réseau (*routeurs*, *switches*) possèdent la *communauté* `public` par défaut.
Pour cette surveillance, un agent sera créé via le menu **Management** **→ Resources → Manage agents → Create agent**, avec la configuration suivante : [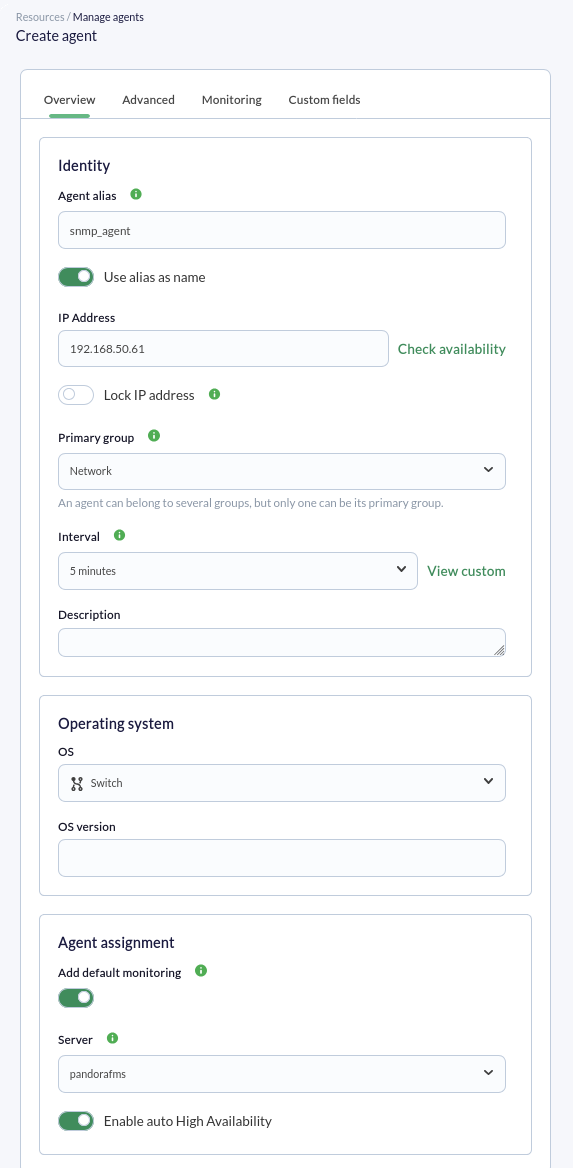](https://pandorafms.com/guides/public/uploads/images/gallery/2026-01/pfms-snmp-agent-image-010.png) Les champs importants sont **IP Address**, où sera inscrite l'adresse IP du périphérique SNMP distant à vérifier. *Généralement, cette adresse IP est utilisée automatiquement lors de la création des modules*, mais il convient de toujours vérifier que cette adresse IP a réellement été utilisée dans chaque module. Dans le champ **Add default monitoring** (activé par défaut), nous verrons cette caractéristique en action : deux modules seront créés, l'un pour vérifier la connectivité, dans ce cas avec le *switch*, et la latence ou temps de connexion (vitesse). Appuyez sur le bouton **Create** pour enregistrer. Une fois l'agent créé, nous allons sur sa vue principale (onglet **Main**) et, en quelques instants, nous verrons si nous avons une connexion avec le périphérique ; si nécessaire, il est possible de forcer la vérification et d'actualiser les données (boutons **Force checks** et **Refresh data**) : [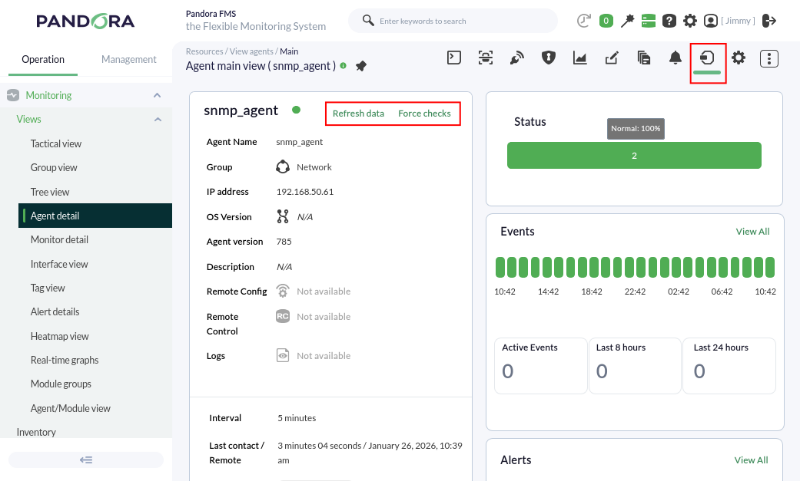](https://pandorafms.com/guides/public/uploads/images/gallery/2026-01/pfms-snmp-agent-image-020.png) Nous allons maintenant dans l'onglet **Manage** qui permet d'accéder via le menu déroulant à l'option **SNMP interface wizard** (cette option est également disponible dans le premier onglet en partant de la gauche) : [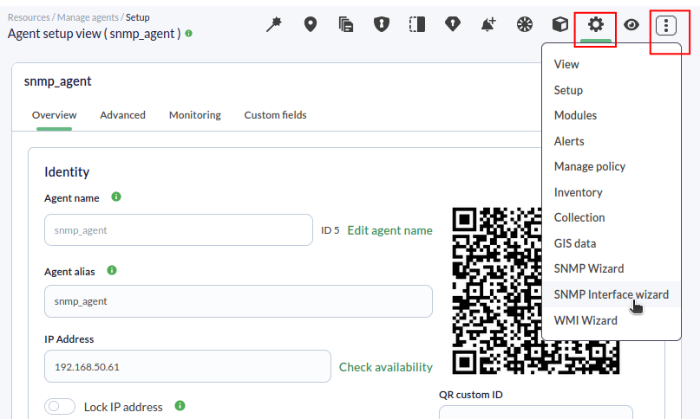](https://pandorafms.com/guides/public/uploads/images/gallery/2026-01/pfms-snmp-agent-image-030.png) En accédant à l'assistant SNMP pour les interfaces réseau, la boîte de dialogue suivante s'affichera, où l'adresse IP a déjà été insérée (champ **Target IP**), extraite des données générales de l'agent, et où un identifiant de type SNMP stocké précédemment a été sélectionné (champ **Import from credential store**) : [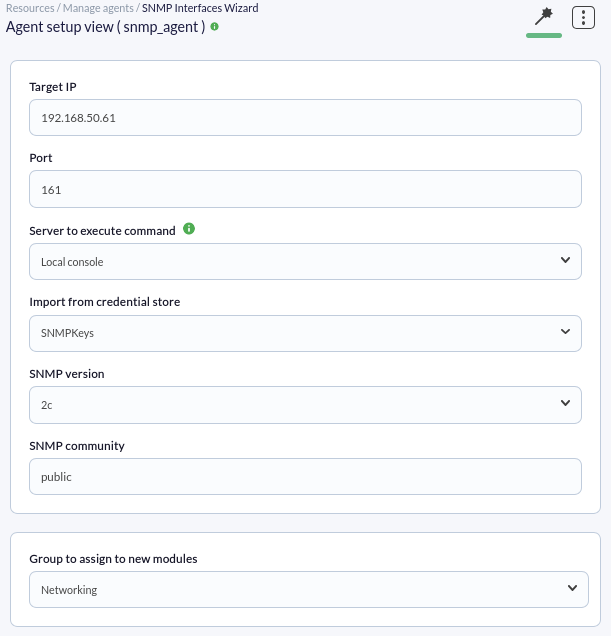](https://pandorafms.com/guides/public/uploads/images/gallery/2026-01/pfms-snmp-agent-image-040.png) Cet identifiant stocké apporte également les valeurs de la version SNMP et de sa *communauté*. Enfin, nous sélectionnons le groupe **Networking** pour assigner les nouveaux modules et nous appuyons sur le bouton **SNMP walk**. Cela peut prendre un certain temps selon la complexité du périphérique ; à la fin de l'exploration, nous porterons notre attention sur le tableau qui permet d'ajouter les vérifications générales aux interfaces réseau détectées. [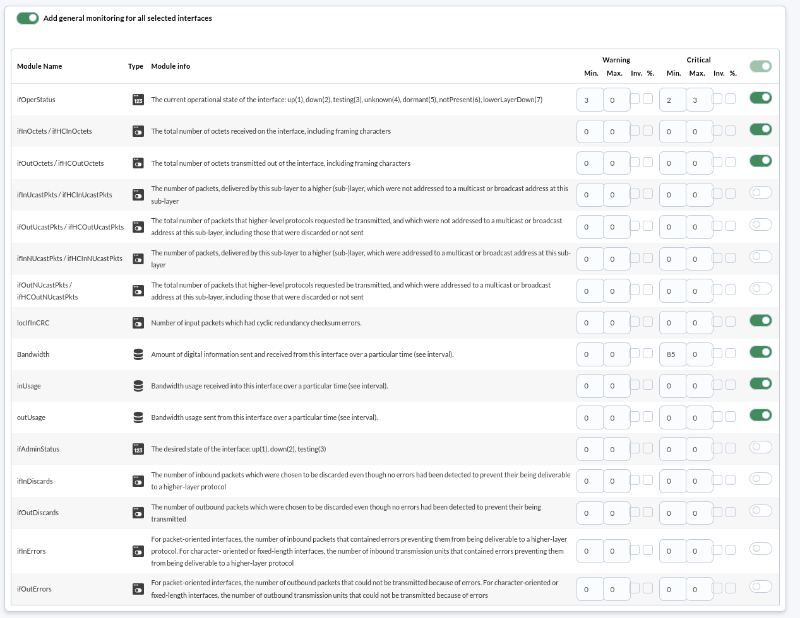](https://pandorafms.com/guides/public/uploads/images/gallery/2026-01/pfms-snmp-agent-image-050.png) Nous laisserons les valeurs déjà cochées et nous appuyerons sur le bouton **Create modules**, suite à quoi une boîte de dialogue présentera un résumé des modules : [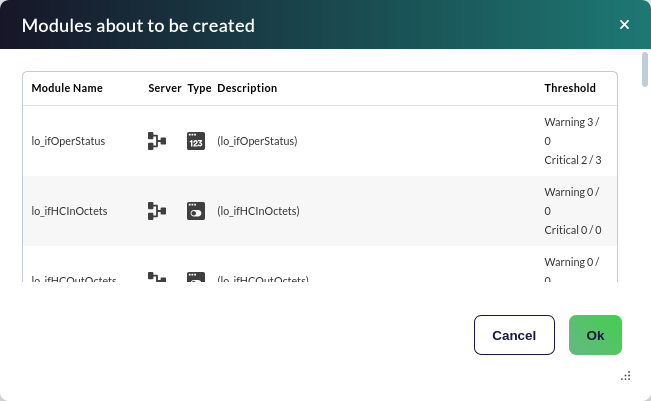](https://pandorafms.com/guides/public/uploads/images/gallery/2026-01/pfms-snmp-agent-image-060.png) En appuyant sur le bouton **Ok**, les modules seront créés dans l'agent.Les modules de trafic réseau sont de type *incremental*, c'est-à-dire que leur valeur correspond à la différence entre l'échantillon d'information qui vient d'être collecté et le précédent. Il affiche un « taux » (dans ce cas en octets/sec), **de sorte qu'un certain temps est nécessaire (entre 1 ou 2 intervalles de l'agent)** avant de pouvoir afficher des valeurs cohérentes.
Une fois la surveillance effectuée pendant suffisamment de temps, nous allons dans le menu **Operation → Monitoring → Views → Monitor detail** et dans **Filters**, nous recherchons le groupe d'agent et l'état normal : [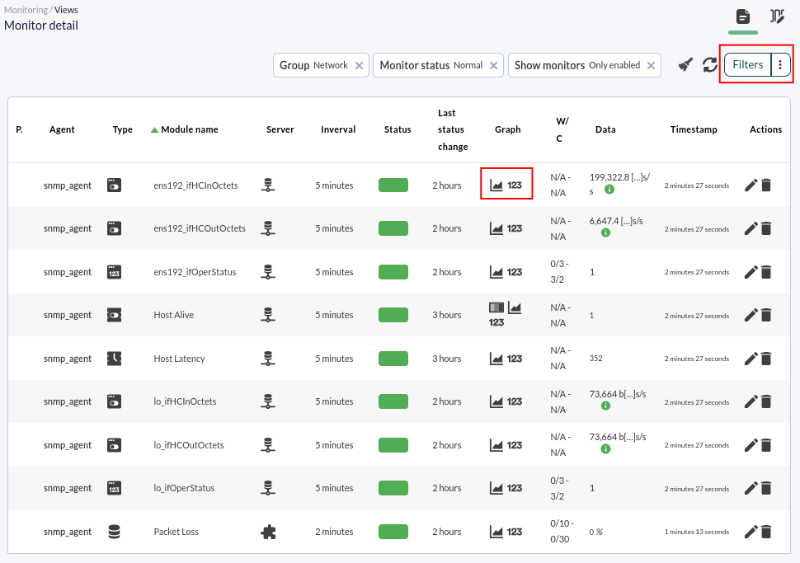](https://pandorafms.com/guides/public/uploads/images/gallery/2026-01/pfms-snmp-agent-image-070.png) Voyons un graphique de seulement l'une des métriques individuelles : [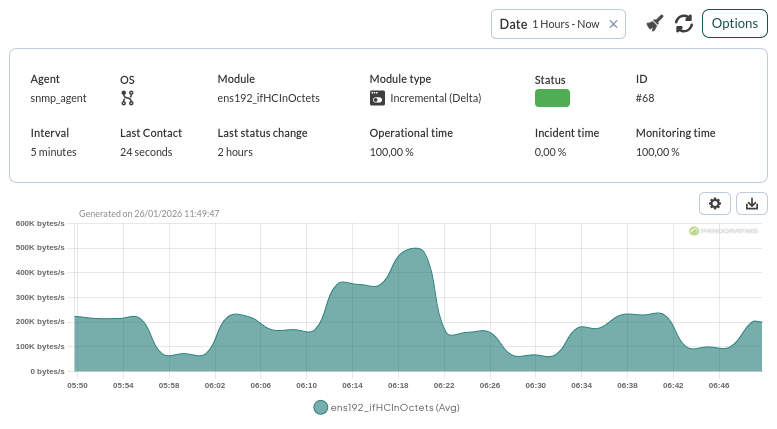](https://pandorafms.com/guides/public/uploads/images/gallery/2026-01/pfms-snmp-agent-image-080.png) Nous pouvons également utiliser la vue des interfaces **Interface information (SNMP)**, située sous la vue générale de l'agent, pour visualiser confortablement les informations de trafic entrant/sortant de chaque interface : [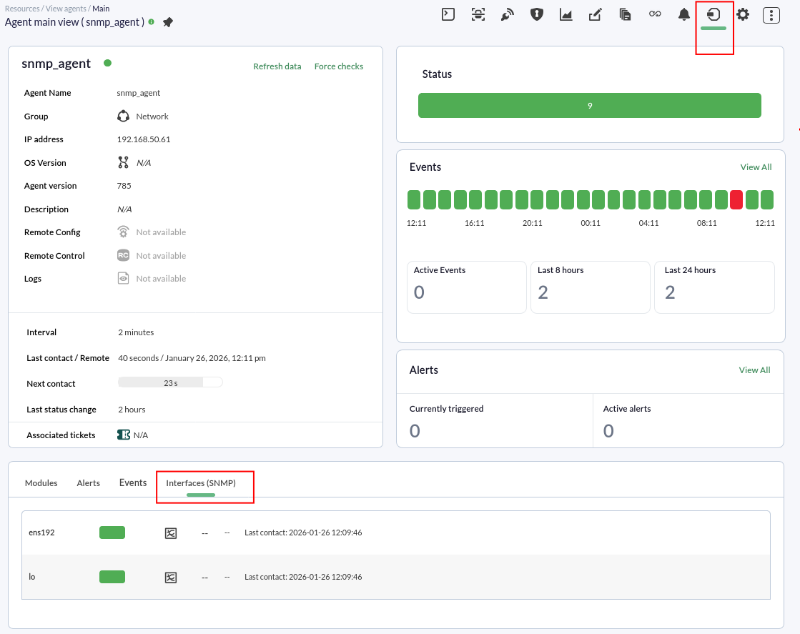](https://pandorafms.com/guides/public/uploads/images/gallery/2026-01/pfms-snmp-agent-image-090.png) En cliquant sur l'icône de graphique d'une interface ([](https://pandorafms.com/guides/public/uploads/images/gallery/2020-11/image-1604424478824.png)), nous verrons plus de détails (dans **Options**, il est possible de modifier la période de temps) : [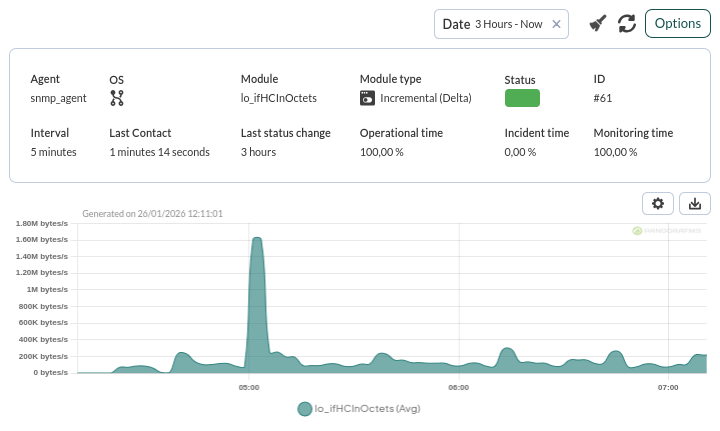](https://pandorafms.com/guides/public/uploads/images/gallery/2026-01/pfms-snmp-agent-image-110.png)Vous n'obtenez pas les résultats expliqués dans ce chapitre ? Accédez à la section d'[aide](https://pandorafms.com/guides/public/books/premiers-pas-avec-pandora-fms/page/21-ou-chercher-en-cas-de-probleme) ou de [support](https://pandorafms.com/guides/public/books/premiers-pas-avec-pandora-fms/page/22-assistance)