PostgreSQL
This document describes the PostgreSQL functionality of PandoraFMS discovery.
- Introduction
- Prerrequisites
- Parameters and configuration
- Manual execution
- Discovery
- Agents and modules generated by the plugin
Introduction
The purpose of this plugin is to monitor PostgreSQL databases, through queries that will extract information about data that is key to knowing the performance and status of the databases, such as the number of connections, number of queries, status of restarts, ratio fragmentation and cache. These data will be reflected in PandoraFMS, in modules that will provide the statistical value, within an agent that will represent each database.
This plugin is developed to be used with Pandora FMS Discovery, so unlike other plugins it does not generate agents by XML, but rather everything discovered is returned in the JSON output of the plugin.
Prerrequisites
This plugin makes remote connections to the databases to be monitored, so it is necessary to ensure connectivity between the Pandora FMS server and said databases.
Parameters and configuration
Parameters
| --conf | Path to configuration file |
| --target\_databases | Path to the configuration file that contains the database targets |
| --target\_agents | Path to the configuration file that contains the agent targets |
| --custom\_queries | Path to the configuration file containing the custom queries |
Configuration file (--conf)
agents_group_id = < ID of the group in which the agents will be created >
interval = < Agent monitoring interval in seconds >
user = <Connection user>
password = <Password>
threads = < Number of threads that will be used to create agents >
modules_prefix = <Modules Prefix>
execute_custom_queries = < Enable with 1 to enable the use of custom queries >
analyze_connections = < Enable with 1 to enable connection monitoring >
engine_uptime = <Enable with 1 to enable runtime monitoring>
query_stats = < Enable with 1 to enable query statistics monitoring >
fragmentation_ratio = < Enable with 1 to enable fragmentation ratio statistics monitoring >
cache_stats = < Enable with 1 to enable cache statistics monitoring >
scan_databases = < Enable with 1 to discover the databases available on each PostgreSQL target >
agent_per_database = < Enable with 1 to create a separate agent for each discovered database >
db_agent_prefix = < Prefix for the names of the per-database agents >
entities_list = < Path to the persistent discovered entities file >
enable_entities_interval = < Enable with 1 to periodically revalidate the entities file >
entities_interval = < Entities file revalidation interval in seconds >
check_storage_stats = < Enable with 1 to enable storage statistics for discovered databases >
check_query_performance = < Enable with 1 to enable query performance statistics >
check_connection_stats = < Enable with 1 to enable per-database connection statistics >
check_transaction_stats = < Enable with 1 to enable transaction activity statistics >
check_table_stats = < Enable with 1 to enable structural table statistics >
check_advanced_perf = < Enable with 1 to enable advanced performance metrics >
Note: Credentials can also be provided through the credentials token, using a Base64-encoded JSON with the same format as Pandora FMS Custom credentials from the Credential store. When defined, it takes precedence over user and password.
credentials = < Base64-encoded JSON with the "user" and "password" fields >
Example
agents_group_id = 10
interval = 300
user = sa
password = HHgD85V@
threads = 1
modules_prefix =
execute_custom_queries = 1
analyze_connections = 1
engine_uptime = 1
query_stats = 1
fragmentation_ratio = 1
cache_stats = 1
scan_databases = 1
agent_per_database = 1
db_agent_prefix =
entities_list = /tmp/postgresql_entities_list.txt
enable_entities_interval = 1
entities_interval = 300
check_storage_stats = 1
check_query_performance = 1
check_connection_stats = 1
check_transaction_stats = 1
check_table_stats = 1
check_advanced_perf = 1
List of target databases (--target_databases)
The content of the file will be a list of PostgreSQL targets separated by commas or lines. Blank lines and lines starting with # are ignored. The following formats are supported for each target:
-
IP:PORT\DATABASE— Monitor only the specified database. -
IP:PORT|db1;db2;db3— Monitor several specific databases of the target. -
IP:PORT!|db1;db2— Exclude the listed databases (requiresscan_databasesto be enabled). -
IP:PORT— Ifscan_databasesis enabled, all databases of the target will be discovered; otherwise only the instance will be monitored.
Example
172.17.0.3:5432\postgres
172.17.0.4:5432|pandora;metadatos
172.17.0.5:5432!|template0;template1
# This line is a comment and will be ignored
172.17.0.6:5432
List of target agents (--target_agents)
The content of the file will be a list of agent name bases, separating each agent by commas or lines. These agent names will be used to dump the information from each target database into the corresponding indicated agent name, rather than letting the plugin generate the agent names automatically.
The position of each agent name in the listing must match the position of the target database in its own listing, that is, the name for the first target database will be the first name in this listing, taking into account that blank lines are ignored.
Example
agente1,,agente3
agente4
agente5,agente6,agente7,,agente9
Custom queries (--custom_queries)
A module must be introduced for each personalized query that is intended to be monitored. The modules must follow a structure, which is the following:
check_begin --> Module opening label
name --> Module name
description --> Description of the module.
operation --> Operation type
datatype --> Module type
min_warning --> Configuration of the minimum warning threshold
max_warning --> Configuration of the maximum warning threshold
str_warning --> Warning string configuration
warning_inverse --> Activate the inverse interval with 1 for warning threshold
min_critical --> Setting the minimum critical threshold
max_critical --> Setting the maximum critical threshold
str_critical --> Critical string configuration
critical_inverse --> Activate inverse interval with 1 for critical threshold
module_interval --> This interval is calculated as a multiplier of the agent interval.
target --> Custom query
target_databases --> Database agents in which the module will be created
target_scope --> Application scope: "instances" (instance only), "databases" (databases only) or "all" (default)
check_end --> Module closing tag
Important notes on custom queries:
- Only
SELECTqueries are allowed. Any other query is discarded with a notice in the plugin output. - The reserved word
$__self_dbnamewill be replaced with the name of the database in which the query is being executed (orpostgreswhen run at instance level). It can be used in bothtargetandname. - The key
sqlis also accepted as an alias oftarget. - If
target_scopeis not specified, it defaults toall(backwards compatible). - If
target_databasesis not specified, it defaults toall(backwards compatible). - The resulting
nameafter the$__self_dbnamesubstitution will be prefixed withmodules_prefixand, when applicable, with the corresponding database name.
Example
check_begin
name Select 1
description Number of invalid objects
operation value
datatype generic_data
min_warning 5
target SELECT 1 FROM dual
target_databases all
check_end

check_begin
name NumeroConexiones
description Number of connections
operation value
datatype generic_data
min_warning 5
target SELECT COUNT(*) AS NumeroConexiones FROM pg_stat_activity
target_databases pandora
target_scope databases
check_end

check_begin
name $__self_dbname.files_table
description Invalid objects (detail)
operation full
datatype generic_data
target SELECT COUNT(*) AS NumeroRegistros FROM files
target_databases pandora
check_end
Manual execution
The plugin execution format is as follows:
./pandora_postgresql \
--conf < path to configuration file > \
--target_databases < path to the configuration file containing the target databases > \
[ --target_agents < path to agent configuration file > ] \
[ --custom_queries < path to the configuration file containing the custom queries > ]
Example:
./pandora_postgresql \
--conf /usr/share/pandora_server/util/plugin/postgresql.conf \
--target_databases /usr/share/pandora_server/util/plugin/targets.conf \
--target_agents /usr/share/pandora_server/util/plugin/target_agents.conf \
--custom_queries /usr/share/pandora_server/util/plugin/custom_queries.conf
Discovery
This plugin can be integrated with Pandora FMS Discovery.
To do so, you must load the ".disco" package that you can download from the Pandora FMS library:
https://pandorafms.com/library/
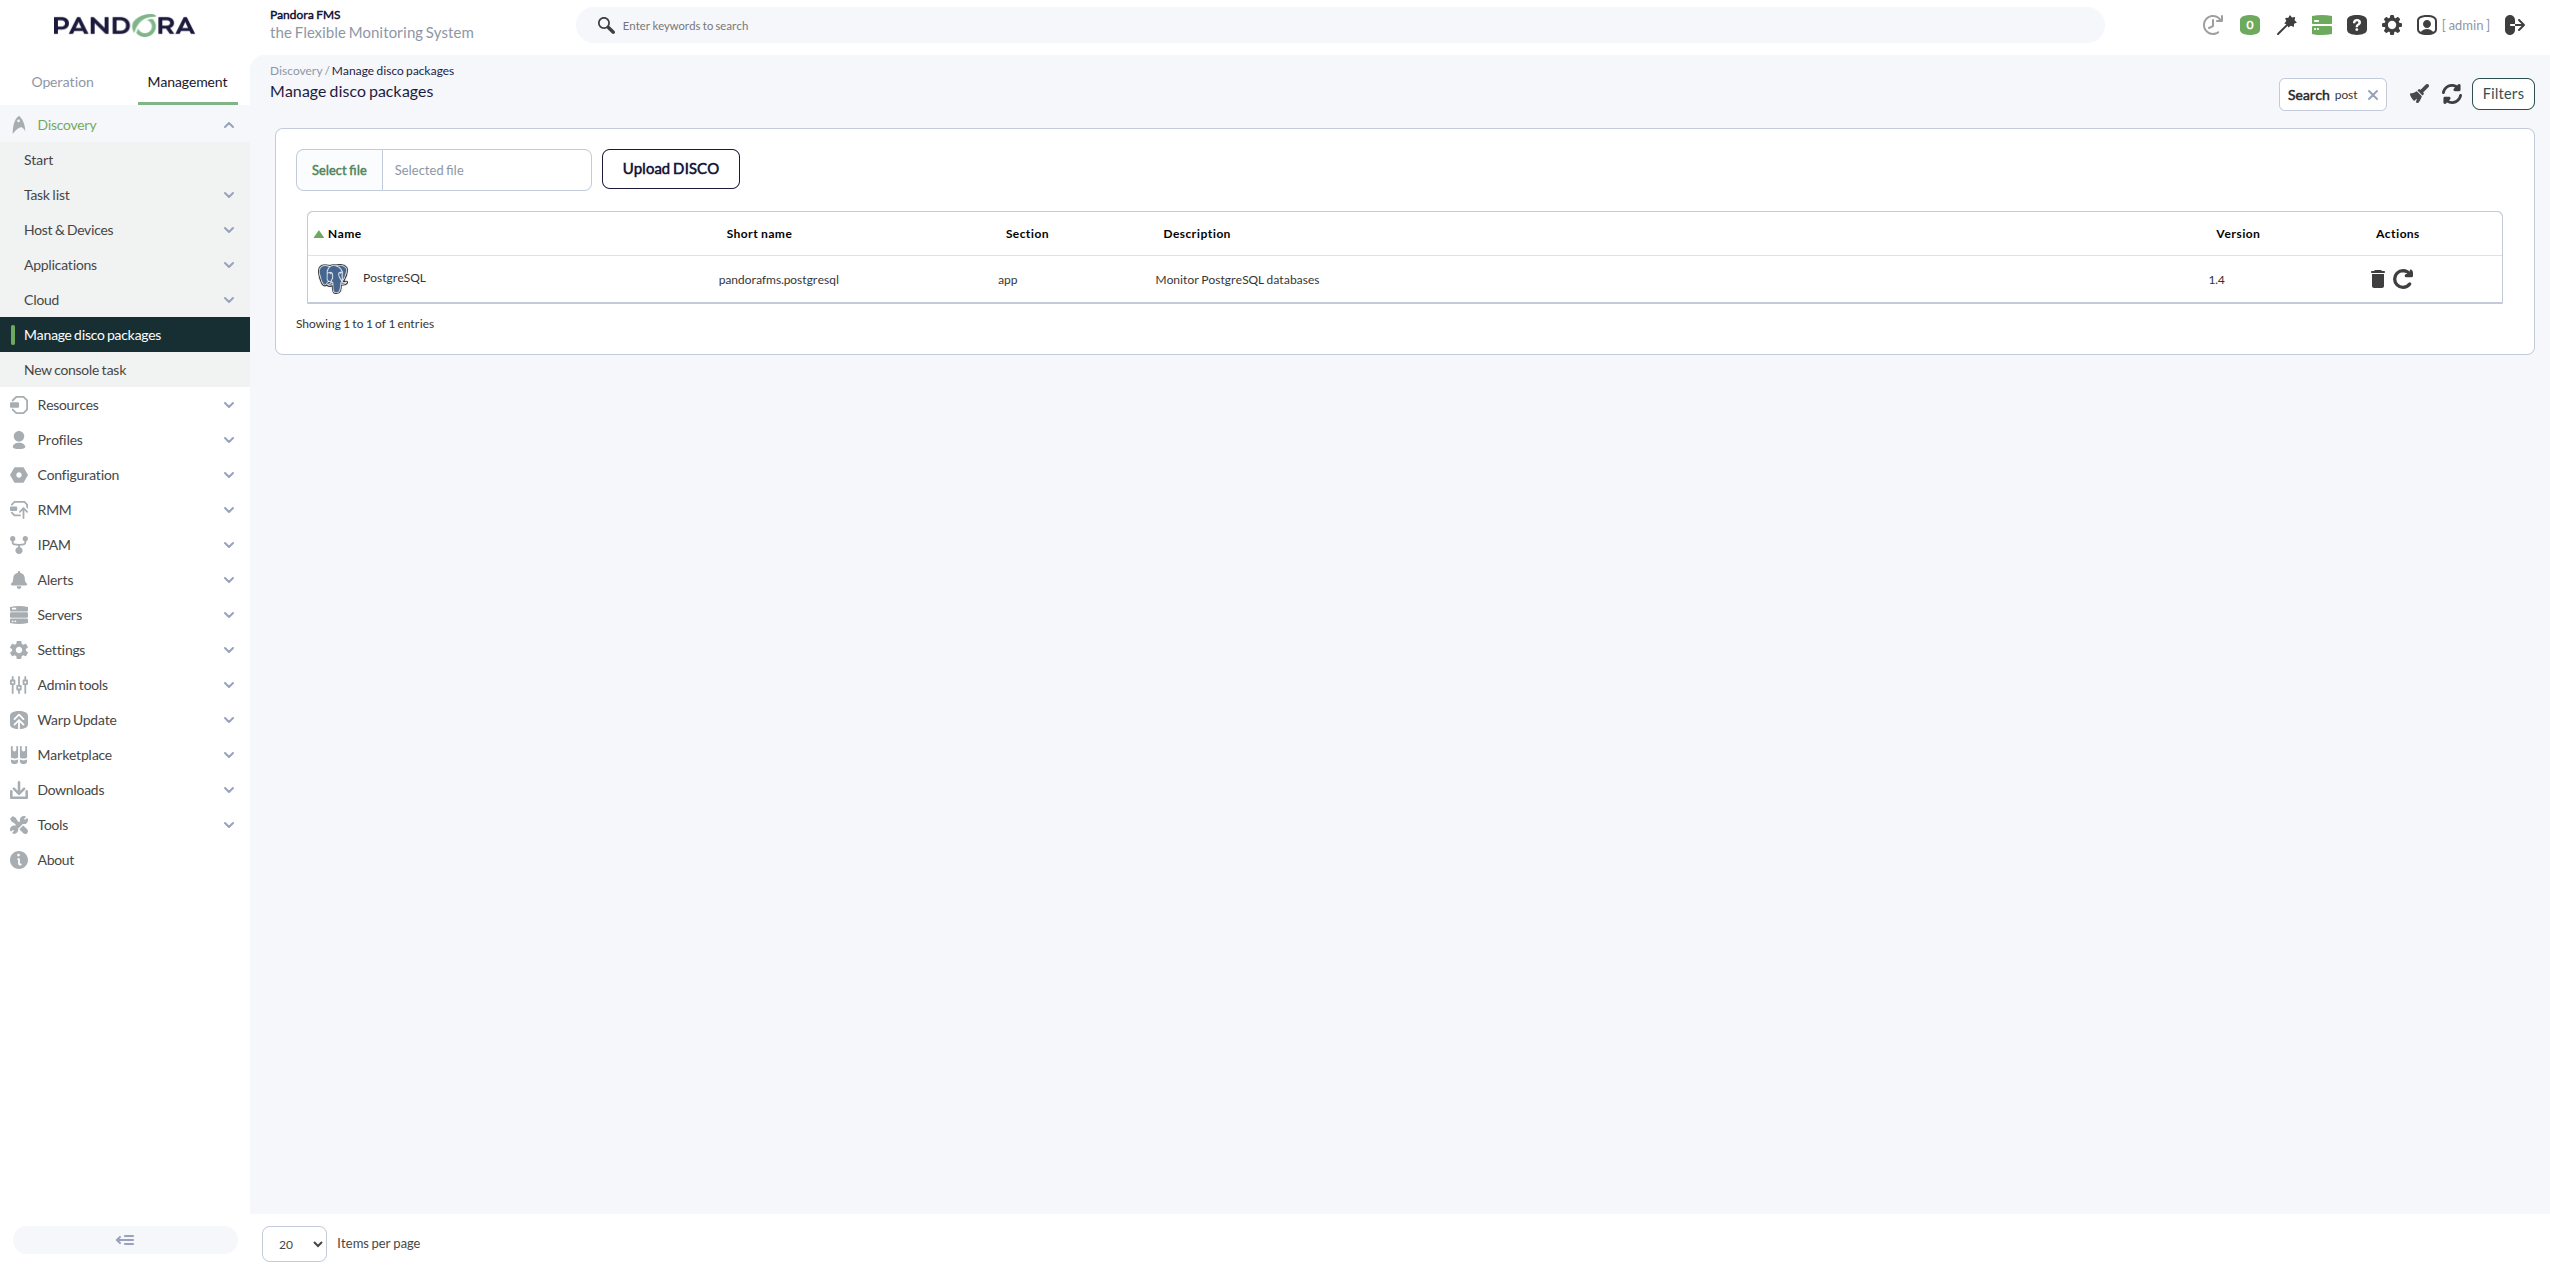
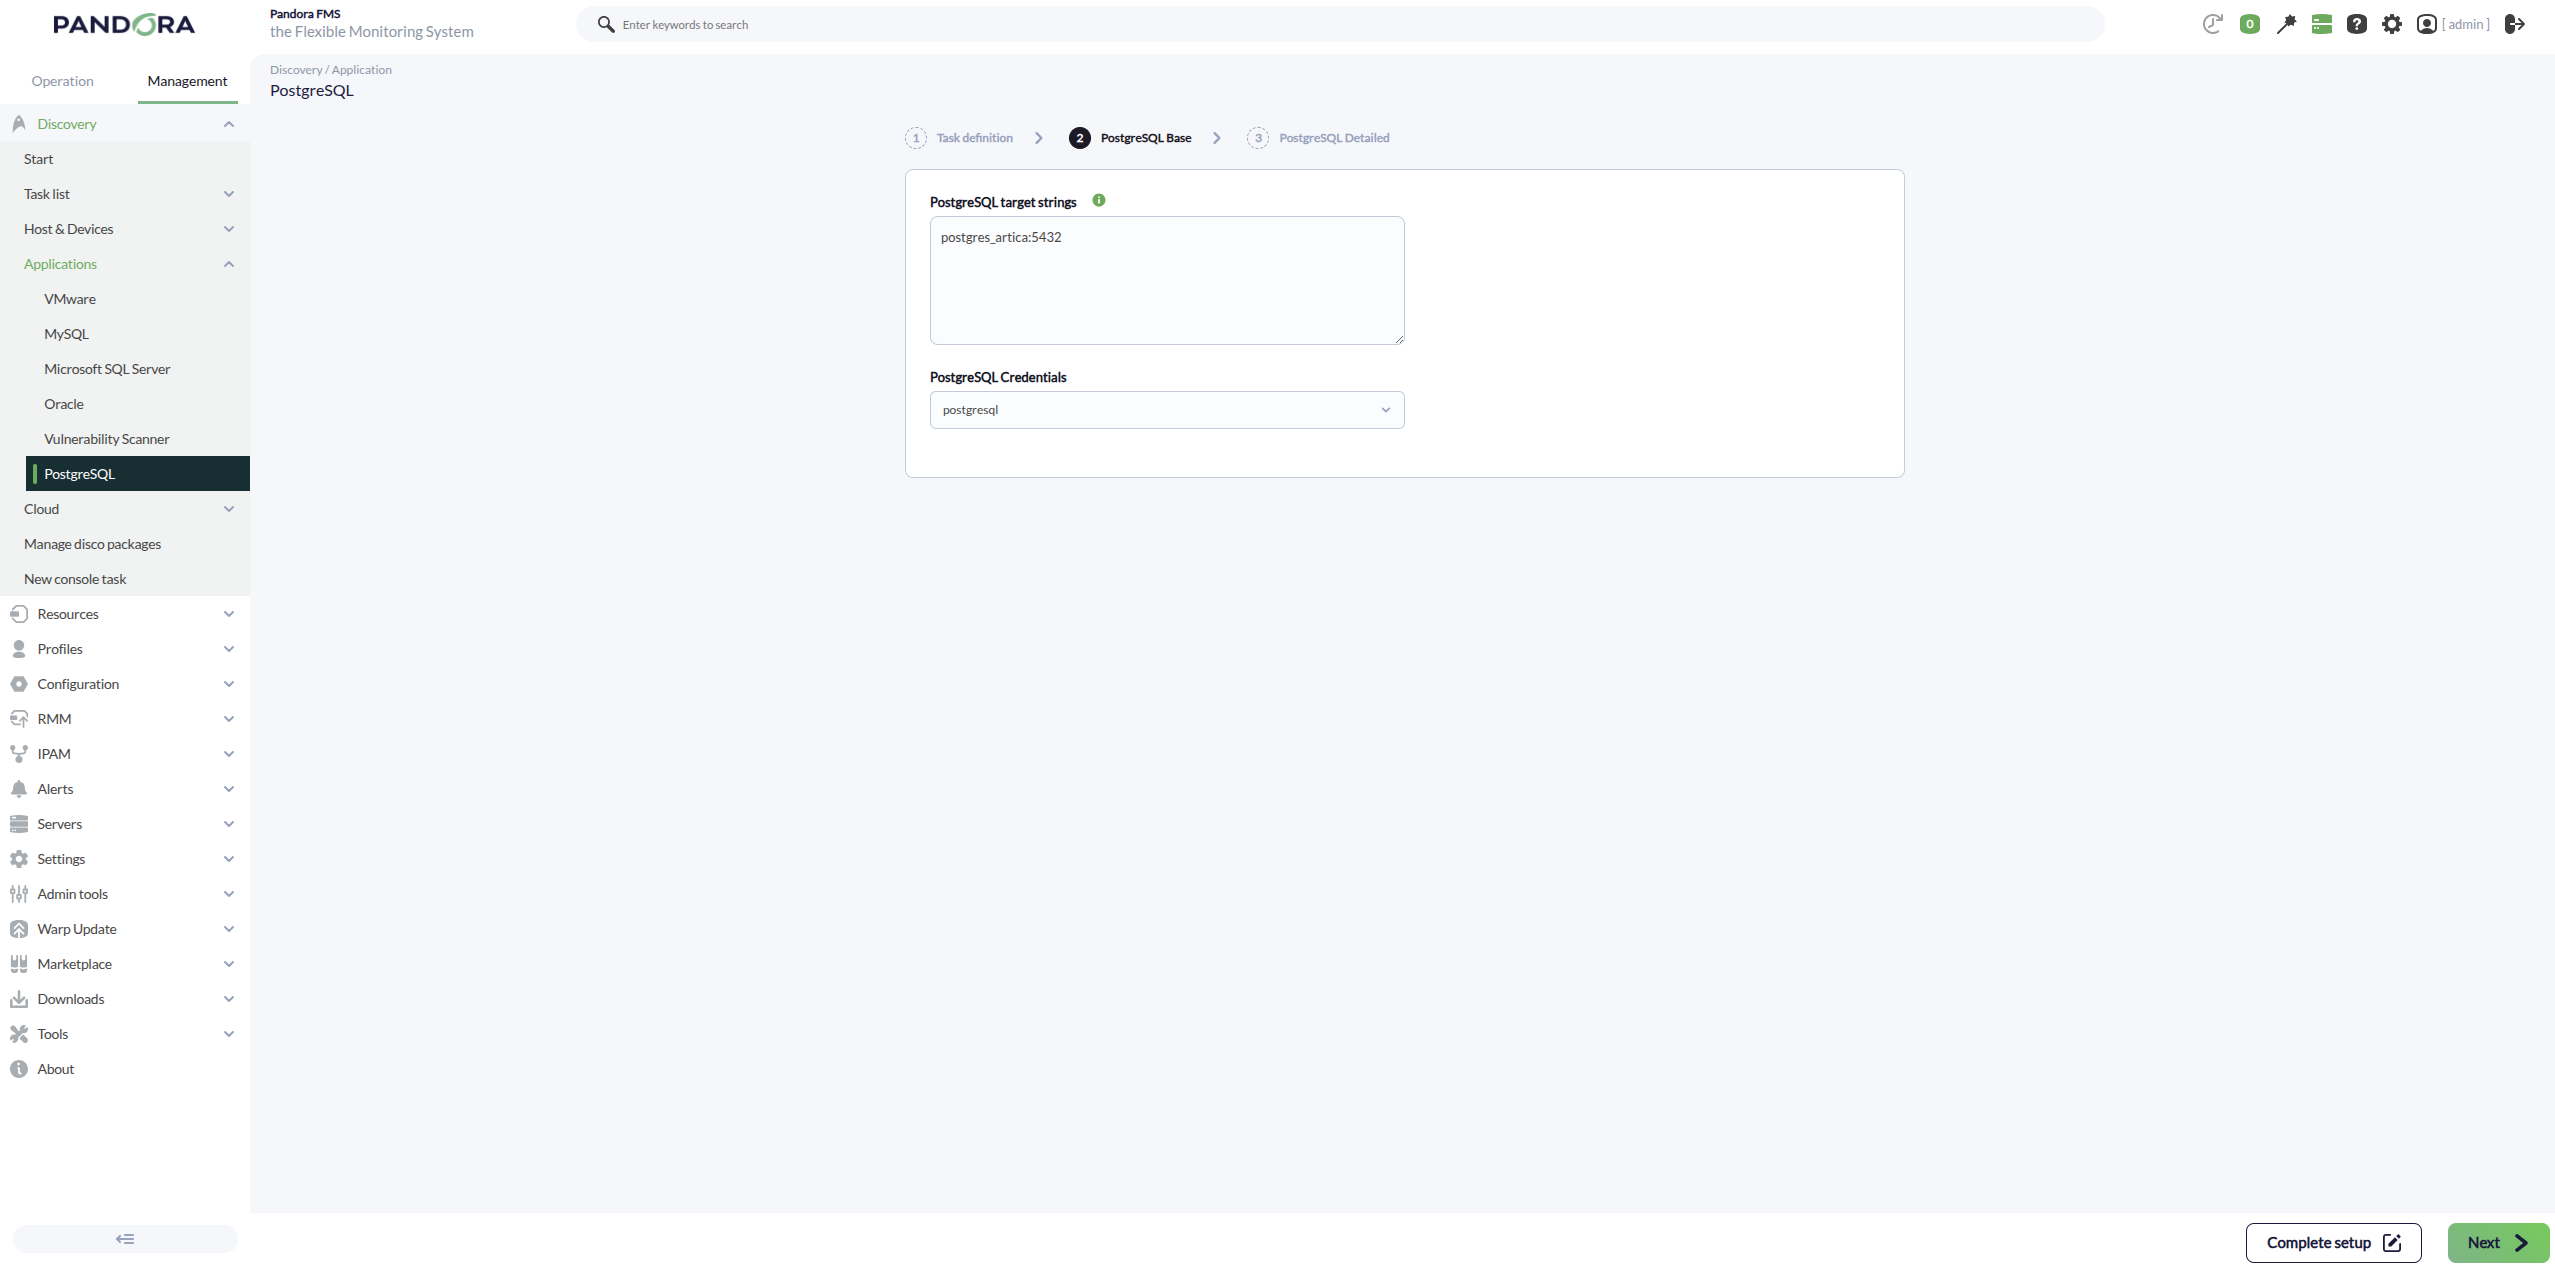
Once loaded, PostgreSQL environments can be monitored by creating Discovery tasks from the Management > Discovery > Applications section.
The following minimum data will be requested for each task:
-
PostgreSQL target strings: List of PostgreSQL targets to be monitored by the task. It will be a comma-separated or line-separated list. Each PostgreSQL target can be defined using the format
IP:PORTorIP, also allowing explicit selection or exclusion of databases (see List of target databases). - PostgreSQL Credentials: Custom connection credentials used to access the PostgreSQL targets. A credential previously created in Management > Configuration > Credential store must be selected.
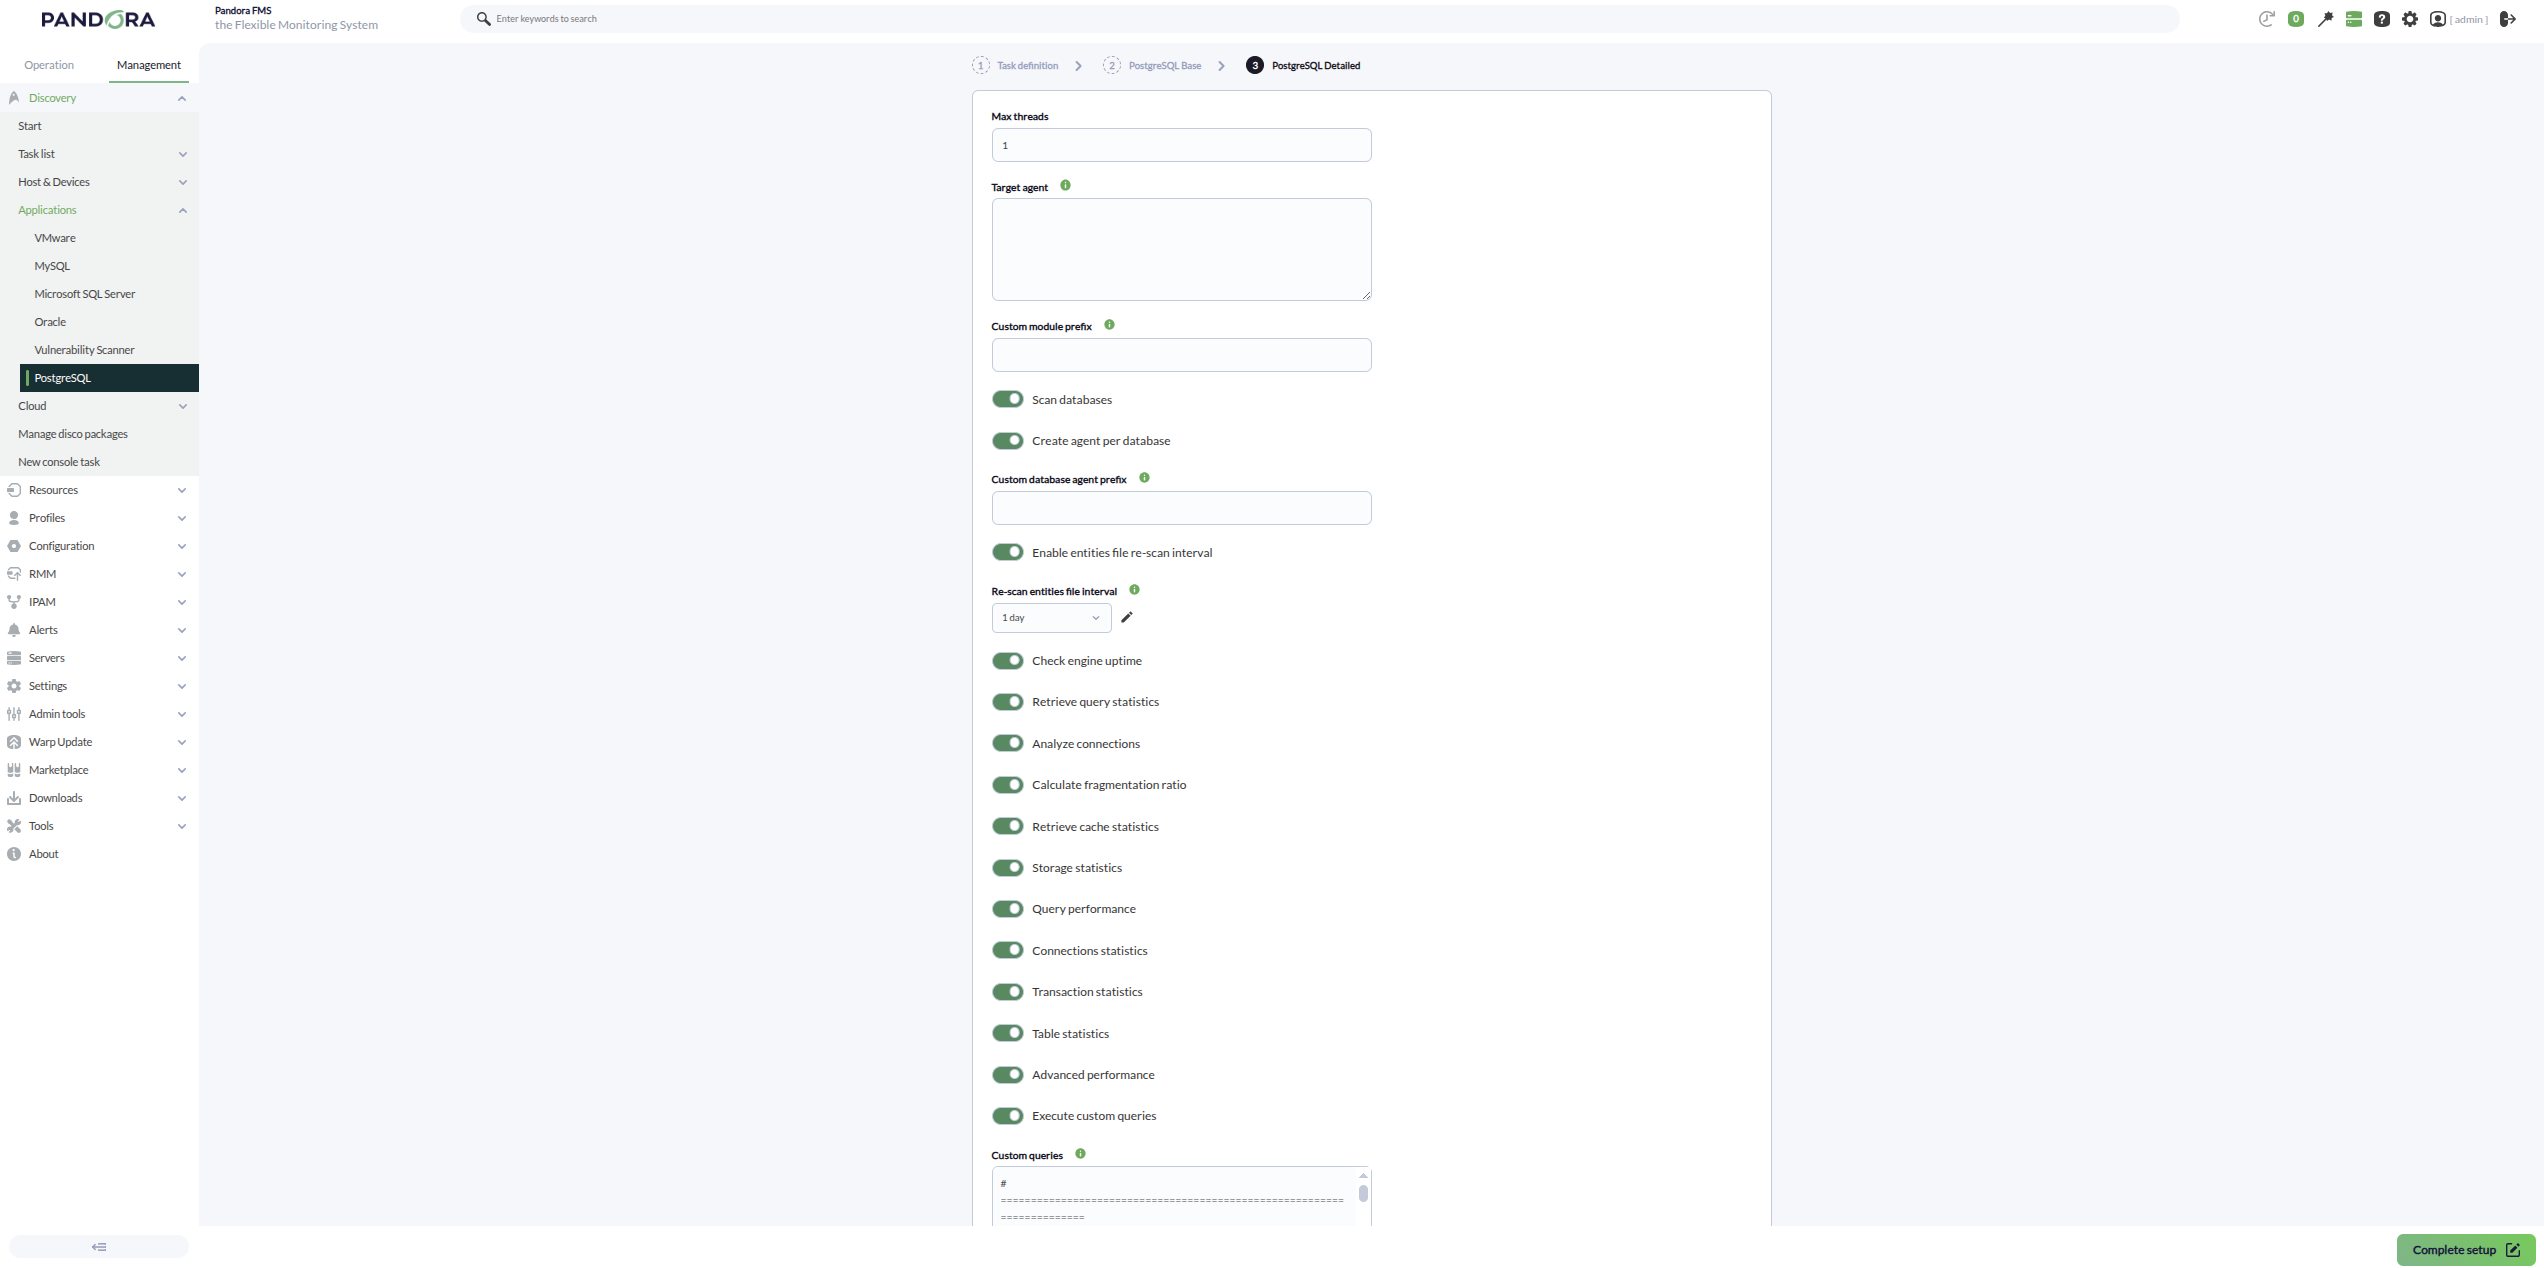
You can also adjust the task configuration to customize the desired monitoring:
- Max threads: To optimize execution time, multiple threads can be configured to monitor the task agents. Keep in mind that setting multiple threads may increase CPU usage.
- Target agent: List of target agents for the PostgreSQL targets to monitor. If an agent name is not specified for a target, its IP or FQDN will be used as the agent name.
- Custom module prefix: Text included as a prefix for all generated module names.
- Scan databases: If enabled, the plugin will discover the databases available on each PostgreSQL target.
- Create agent per database: If enabled, a separate agent will be created for each discovered database.
- Custom database agent prefix: Text included as a prefix for generated database agent names.
-
Enable entities file re-scan interval: If enabled, the plugin will use a persistent discovered entities file to validate previously detected databases, even if they are no longer present in the current scan. This way, if a database disappears from the scan, its
connectionmodule can transition to a critical state instead of being silently dropped. - Re-scan entities file interval: Interval used to revalidate the discovered entities file.
- Check engine uptime: If enabled, engine uptime monitoring will be performed.
-
Retrieve query statistics: If enabled, instance-level query statistics will be monitored:
-
queries: Number of active queries within the configured interval. -
insert: Number of active INSERT queries. -
delete: Number of active DELETE queries. -
update: Number of active UPDATE queries.
-
-
Analyze connections: If enabled, instance connection usage will be monitored:
-
session usage: Percentage of connection usage compared to the configured maximum.
-
-
Calculate fragmentation ratio: If enabled, fragmentation ratio statistics will be monitored:
-
fragmentation ratio: Estimated average fragmentation ratio.
-
-
Retrieve cache statistics: If enabled, instance cache statistics will be monitored:
-
allocated buffer cache: Total allocated shared buffers. -
backend used buffer cache: Buffers used by backend processes. -
checkpoints buffer cache: Buffers written by checkpoints. -
cleaned buffer cache: Buffers cleaned by the background writer.
-
-
Storage statistics: If enabled, storage metrics for discovered databases will be monitored:
-
database size: Total database size. -
tables size: Total space used by tables. -
indexes size: Total space used by indexes. -
temp bytes: Temporary data written to disk. -
temp files: Number of temporary files created.
-
-
Query performance: If enabled, query performance statistics will be monitored:
-
long queries: Number of active queries running longer than the configured interval. -
oldest query age: Execution time of the oldest active query. -
sequential scans: Number of sequential scans. -
index scans: Number of index-based scans. -
cache hit ratio: Database cache hit ratio.
-
-
Connections statistics: If enabled, per-database connection statistics will be monitored:
-
active connections: Number of active connections. -
idle connections: Number of idle connections. -
total connections: Total number of open connections.
-
-
Transaction statistics: If enabled, transaction activity will be monitored:
-
transactions: Total executed transactions. -
commits: Committed transactions. -
rollbacks: Rolled back transactions. -
rollback ratio: Rolled back transactions ratio. -
deadlocks: Detected deadlocks. -
conflicts: Detected database conflicts.
-
-
Table statistics: If enabled, structural table statistics will be monitored:
-
table count: Total number of user tables. -
index count: Total number of user indexes. -
live tuples: Estimated active rows. -
dead tuples: Estimated obsolete rows pending cleanup. -
fragmentation ratio: Estimated table fragmentation ratio.
-
-
Advanced performance: If enabled, advanced performance metrics will be monitored:
-
blocks read: Blocks read from disk. -
blocks hit: Blocks retrieved from cache.
-
- Execute custom queries: If enabled, custom queries can be executed against the PostgreSQL instance and discovered databases.
-
Custom queries: Configuration block used to define custom queries to be executed. It supports the
target_scopefield (instances,databasesorall) and the reserved word$__self_dbnameto dynamically build the module name and the query depending on the database in which it is executed.
Discovery behavior:
- A main agent will always be created for each PostgreSQL target.
- If Scan databases is enabled, the databases of the target will be discovered.
- If Create agent per database is enabled, a separate agent will be created for each discovered database. Otherwise, the database modules will be created on the main agent using the database name as prefix.
- The connection module will always be created for each discovered database, even if no other tokens are enabled.
- The POSTGRESQL connection module will always be created on the main (instance) agent to reflect the global availability of the instance.
- When Enable entities file re-scan interval is enabled, previously detected databases are persisted in the entities file, so that if they no longer appear in the current scan, the plugin will keep generating their
connectionmodule (which can transition to a critical state) instead of removing them silently.
Successfully completed tasks will provide an execution summary with the following information:
- Total agents: Total number of agents generated by the task.
- Targets up: Total number of targets successfully connected.
- Targets down: Total number of targets that could not be reached.
Agents and modules generated by the plugin
The plugin will create a main agent for each configured PostgreSQL target. That agent will contain the following modules depending on the enabled configuration.
The POSTGRESQL connection module is always generated, regardless of the enabled tokens, and reflects the overall availability of the instance.
| POSTGRESQL connection | **PostgreSQL instance availability.** It will be 1 if the connection to the instance was successfully established and 0 otherwise. |
If engine_uptime is enabled:
| restart detection | **It will be 0 if an unexpected restart has been detected, and 1 otherwise.** This allows detection of unexpected PostgreSQL service restarts that may affect database availability or interrupt service continuity. |
If query_stats is enabled:
| queries | **Number of active queries.** Allows monitoring of the current query workload on the PostgreSQL instance. |
| insert | **Number of active INSERT queries.** Useful for evaluating current write activity and insert workload. |
| delete | **Number of active DELETE queries.** Helps identify active deletion operations that may impact performance. |
| update | **Number of active UPDATE queries.** Allows monitoring of active data modification operations. |
If analyze_connections is enabled:
| session usage | **Percentage of connection usage compared to the configured maximum.** Useful for identifying connection saturation or resource exhaustion scenarios. |
If cache_stats is enabled:
| allocated buffer cache | **Total allocated shared buffers.** Represents the amount of memory reserved by PostgreSQL for data caching. |
| backend used buffer cache | **Buffers used by backend processes.** Helps evaluate memory usage generated by active processes. |
| checkpoints buffer cache | **Buffers written by checkpoints.** Useful for analyzing checkpoint disk synchronization activity. |
| cleaned buffer cache | **Buffers cleaned by the background writer.** Helps evaluate cache cleanup activity. |
If fragmentation_ratio is enabled:
| fragmentation ratio | **Estimated average fragmentation ratio.** High values may indicate wasted storage space or degraded performance. |
If scan_databases is enabled, the plugin will discover the databases available on the PostgreSQL target.
The connection module will always be created for each discovered database.
If agent_per_database is enabled, a separate agent will be created for each discovered database. Otherwise, database modules will be created within the main agent using the corresponding database name as prefix.
If Storage statistics is enabled:
| database size | **Total database size.** Useful for monitoring storage growth. |
| tables size | **Total space used by tables.** Helps evaluate storage consumed by data structures. |
| indexes size | **Total space used by indexes.** Useful for identifying excessive index growth. |
| temp bytes | **Temporary data written to disk.** May indicate expensive sorting or temporary processing operations. |
| temp files | **Number of temporary files created.** Useful for identifying temporary workload pressure. |
If Query performance is enabled:
| long queries | **Long-running active queries.** Useful for detecting slow or problematic queries. |
| oldest query age | **Execution time of the oldest active query.** Helps identify long-running operations or blocking scenarios. |
| sequential scans | **Number of sequential scans.** High values may indicate missing indexes. |
| index scans | **Number of index scans.** Useful for evaluating effective index usage. |
| cache hit ratio | **Database cache hit ratio.** Helps evaluate memory access efficiency. |
If Connections statistics is enabled:
| active connections | **Number of active connections.** Reflects current user or application activity. |
| idle connections | **Number of idle connections.** Helps detect unused but open sessions. |
| total connections | **Total number of open connections.** Provides overall connection consumption visibility. |
If Transaction statistics is enabled:
| transactions | **Total executed transactions.** Reflects general transactional activity. |
| commits | **Committed transactions.** Indicates successfully completed operations. |
| rollbacks | **Rolled back transactions.** May indicate failures or canceled operations. |
| rollback ratio | **Rollback ratio.** Helps identify abnormal transactional behavior. |
| deadlocks | **Detected deadlocks.** Useful for identifying locking conflicts. |
| conflicts | **Detected database conflicts.** Helps evaluate concurrency issues. |
If Table statistics is enabled:
| table count | **Total number of user tables.** Structural inventory of the database. |
| index count | **Total number of user indexes.** Useful for structural monitoring. |
| live tuples | **Estimated active rows.** Reflects useful stored data volume. |
| dead tuples | **Estimated obsolete rows pending cleanup.** Useful for identifying VACUUM requirements. |
| fragmentation ratio | **Estimated table fragmentation ratio.** Helps evaluate storage health. |
If Advanced performance is enabled:
| blocks read | **Blocks read from disk.** Useful for measuring physical storage access. |
| blocks hit | **Blocks retrieved from cache.** Useful for measuring memory access efficiency. |
The plugin will also create a module for each custom query defined in the configuration file. Custom queries with target_scope=instances will be assigned to the main (instance) agent, while those with target_scope=databases will be assigned to the corresponding database agents.
In PostgreSQL 17 and later versions, the modules "backend used buffer cache", "checkpoints buffer cache", and "cleaned buffer cache" are not available.