Plugin openshift.
Plugin to monitor openshift.
- Introduction
- Compatibility
- Pre requisites
- Parameters
- Manual execution
- Configuration in Pandora FMS
- Modules generated by the plugin
- Possible problems
- Error control
Introduction
Ver. 10-02-2022
With this plug-in we will be able to view data and monitor our openshift nodes and pods.
Type: Server plug-in
Compatibility
| Systems where tested |
CentOS 7, Fedora |
| Systems where it should work |
Any linux system |
Pre requisites
- Have openshift CLI(oc) installed.
Information about cli installation can be found in the official documentation:
https://docs.openshift.com/container-platform/4.9/cli_reference/openshift_cli/getting-started-cli.html
- Have a project created in openshift.
- The openshift user account must have cluster-reader permissions.
The cli commands to add permissions are as follows (these must be given from a privileged account)
Add a role to a user :
oc adm policy add-role-to-user <role> <user_name>Remove a role from a user :
oc adm policy remove-role-from-user <role> <user_name>Add a role to a user for all projects:
oc adm policy add-cluster-role-to-user <role> <user_name>Remove a user role for all projects:
oc adm policy remove-cluster-role-from-user <role> <user_name>Example :

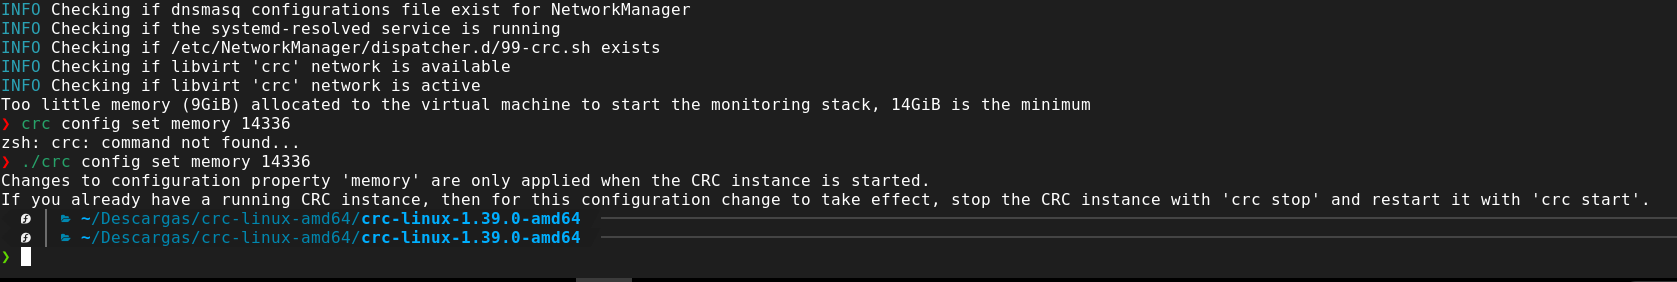
./crc config set enable-cluster-monitoring trueExample:

To be able to have enabled a minimum of 14 gb is requested, so if we have configured the environment with less, and we activate the cluster-monitoring option we will have to add more to the machine, the minimum is 14336 in mb.
The command to specify the memory is :
./crc config set memory 14336Example:
- Have the perl tools plugin in a folder called PandoraFMS.
- Have installed the Pandora software agent
Parameters
The plugin makes use of the following parameters:
| cli | Path of the openshift oc binary |
| user | Your user name |
| password | Your password |
| ip | Ip of your environment (complete route with port) |
| project | openshift project |
| mode | xml sending mode (leave tentacle as default) |
| tentacle ip | Ip of pandora to send data to |
| tentacle port | Tentacle port number (default: 41121) |
| agent_openshift | To enable this agent, it creates modules with the number of deployments, services...etc. Leave it to 1 to enable it. |
| agent_node | To enable one agent per node. Leave on 1 to enable it. |
| agent_pod | To enable one agent per pod. Leave on 1 to enable it. |
| agent_pod_stats | To enable an agent with the metrics of each pod. Leave on 1 to enable it. |
| agent_deployment | To enable one agent per deployment. Leave on 1 to enable it. |
| agent_imagestreams | To enable an agent with modules for each imagestreams, the number of imagestreams is determined with top_imagestreams_count. Set to 1 to enable it. |
| agent_csv |
To enable an agent to create a module to monitor cluster service version. |
| agent_component_status | To enable an agent to create a module to monitor component status. |
| agent_operators | To enable an agent to create a module to monitor operators. |
| agent_replication_controller | To enable an agent that will create a module for each replication controller in our environment. Leave to 1 to enable it. |
| agent_apiservice | To enable an agent that will create a module for each service of our API. Leave to 1 to enable it. |
| agent_services | To enable an agent that will create a module for each service in our environment. Leave to 1 to enable it. |
| top_imagestream_count | Number of imagestreams to monitor in your environment. Default 11. |
| prefix | Customized name for the created agents |
| as_server_plugin | If it is to be used as a server plugin, set it to 1 to activate it, if it is used as an agent plugin, set it to 0. |
You will have to edit the conf by setting the required value.
Example:
# oc cli config
cli=/home/alejandro/Descargas/cli/oc
user=developer
password=developer
ip=https://<ip>:6443/
project=prueba
# transfer configuratios
mode=tentacle
tentacle_ip=192.168.1.200
tentacle_port=41121
# enabled metrics block
agent_openshift=1
agent_node=1
agent_pod=1
agent_pod_stats=1
agent_deployment=1
agent_imagestreams=1
agent_apiservice=1
agent_services=1
agent_replication_controller=1
agent_component_status=1
agent_csv=0
agent_operators=1
top_imagestreams_count=11
# define
as_server_plugin=1
prefix=prueba
Manual execution
The plugin can be executed manually by calling the perl plugin and the conf file:
<path pandora_openshift.pl> <pandora_openshift.conf>If the conf option, as_server_plugin is set to 1 it will show a number on the screen, specifically a 9 if everything is correct.

If it is executed with as_server_plugin at 0 it will not return anything by terminal, unless there is some error that will paint a module in xml with the part that fails in the description.
Configuration in Pandora FMS
As agent plugin
To be able to monitor from Pandora FMS with the plugin, we must call it from the conf of the software agent that is in the following path :
/etc/pandora/pandora_agent.confwe will call it in the last line of the conf with the command module_plugin , followed by the path of the perl plugin and the path of the conf file.
module_plugin perl <path .pl> <path .conf>This can also be done from the console if remote configuration is enabled.
As a server plugin
Installation from console
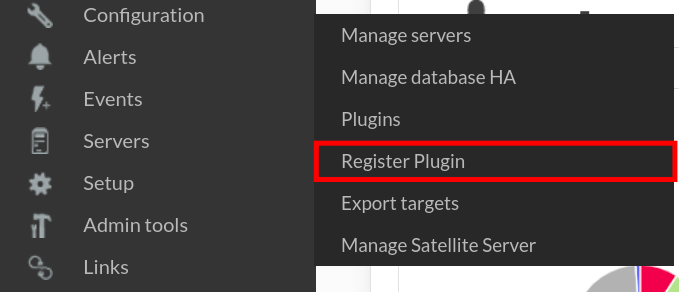
To register the plugin, from the console, go to the "register plugin" section.
Click on select file.

The .pspz2 file to be uploaded will be selected.

A message will appear informing that you have successfully registered.

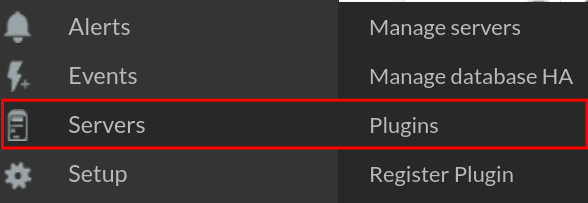
Once the plugin is registered, we will see it in the plugins section.
You can access the plugin menu by clicking on the plugin title.

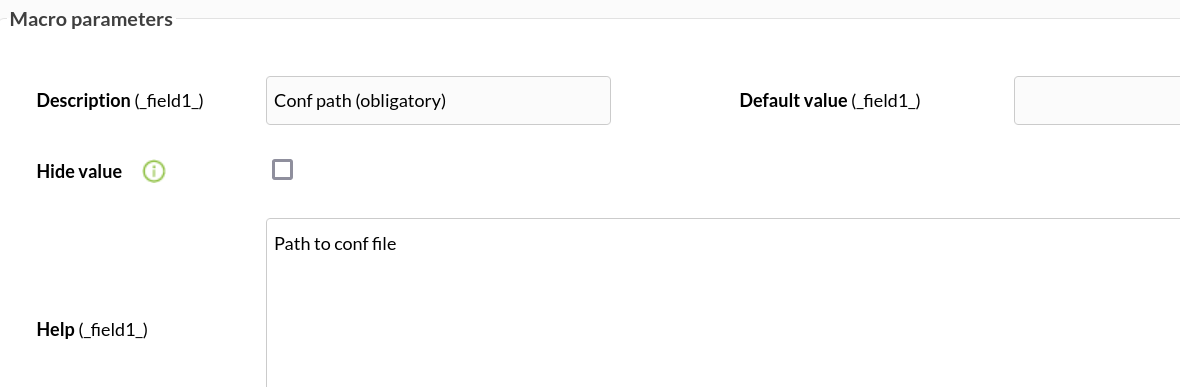
In parameters we will see the macro used by the plugin, this is not necessary to touch it
In the Default value field, we must enter the path to our .conf file.
Manual installation
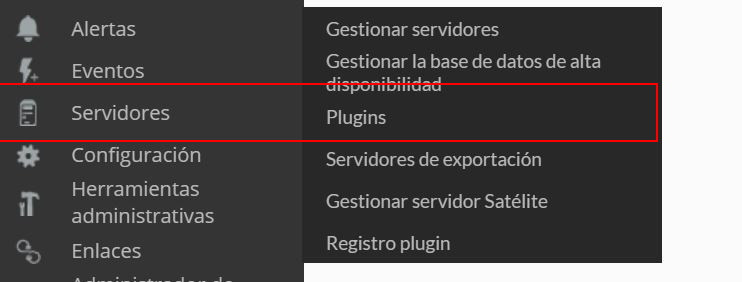
Go to servers > plugins:
Click on add:

We put the name and description of your choice:

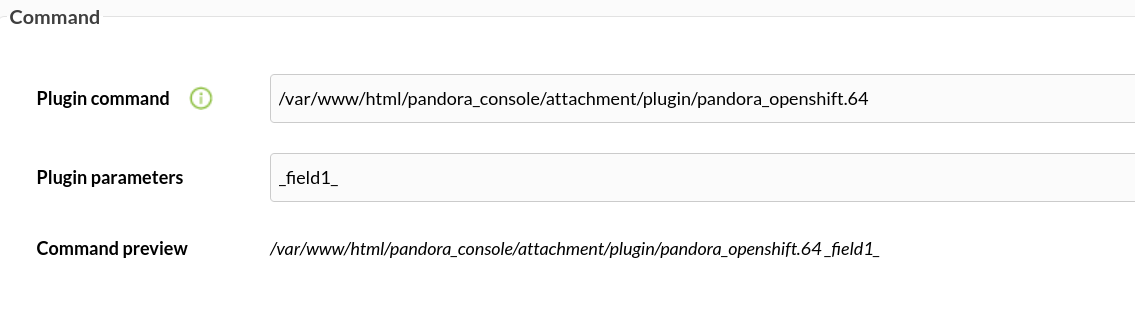
We enter as command the execution with the path of the plugin:
/path_pandora_openshift path_pandora_openshift.conf
Modules generated by the plugin
The plugin will generate :
* prefix is a conf parameter that we can customize by adding any name we want.
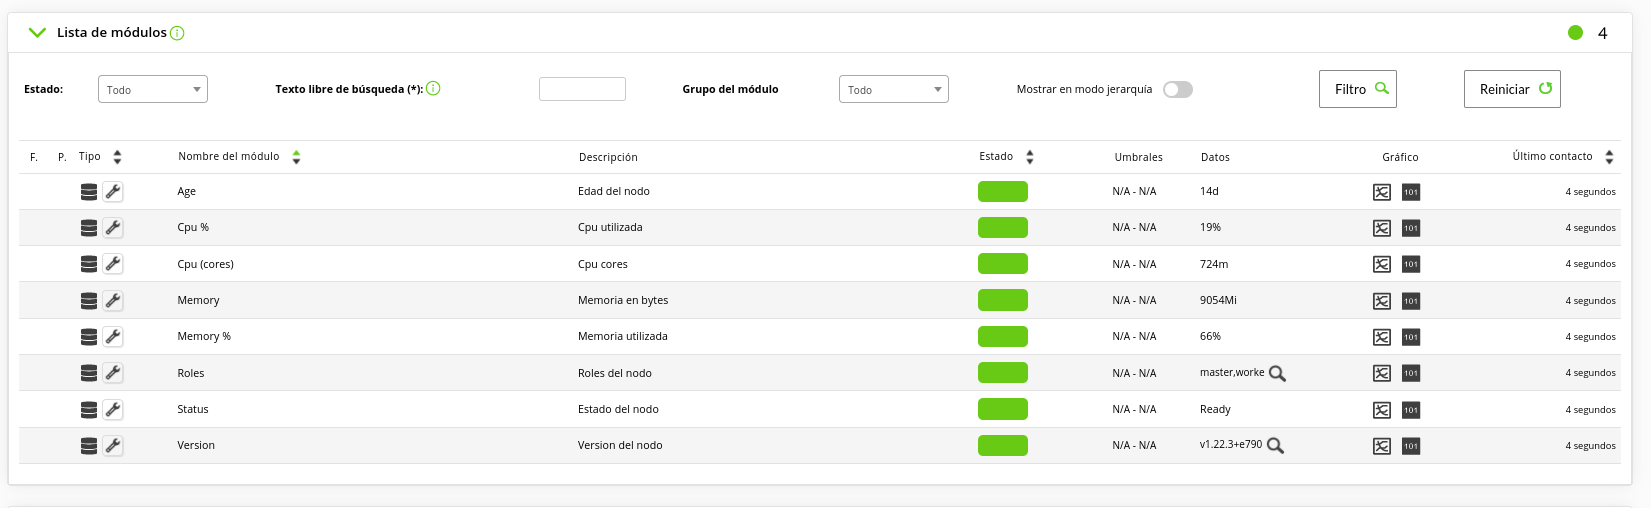
- One agent for each node of the environment with name : prefix_OS_Node_<node name>.
Each node agent will have the following modules :
| Status |
| Roles |
| Age |
| Versión |
| cpu cores |
| cpu % |
| memory bytes |
| memory % |
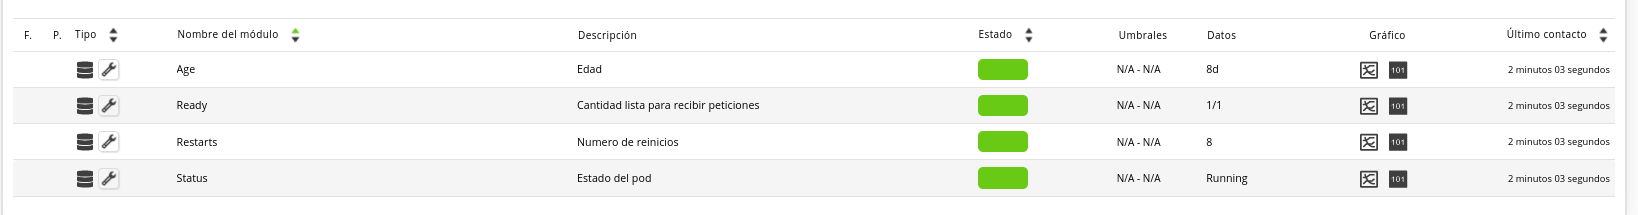
- One agent for each pod in the environment with name : prefix_OS_Pod_<pod name>.
Each pod agent will have the following modules:
| Status |
| Restarts |
| Ready |
| Age |
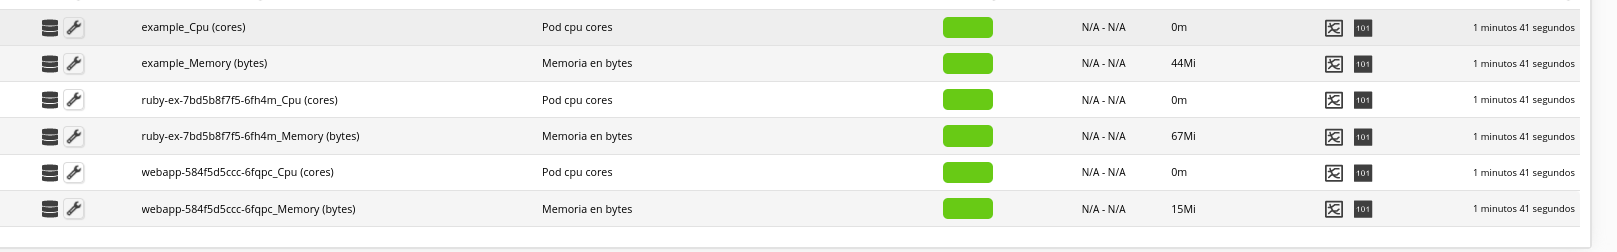
- An agent with name: prefix_OS_POD_Stats
It will create a cpu(cores) module and a memory module for each pod.
| <nombre-pod>_Cpu (cores) |
| <nombre-pod>_Memory (bytes) |
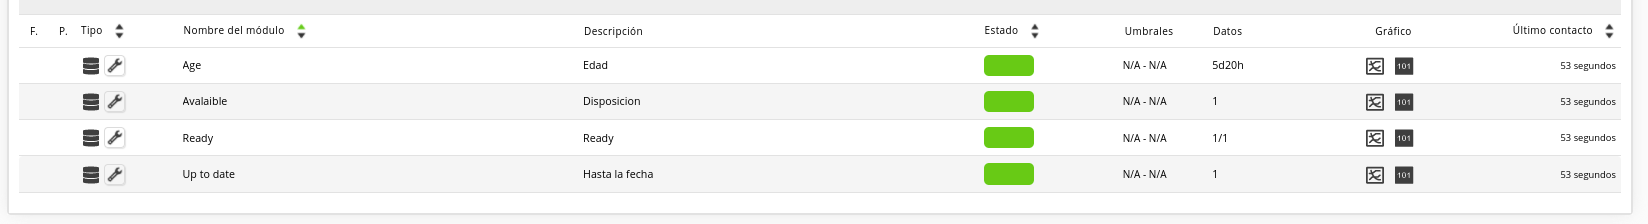
- One agent for each deployment with name :prefix_ OS_Deployment_<deployment-name>.
Each Deployment agent will have the following data :
| Age |
| Avalaible |
| Ready |
| Up to date |
- An agent named "prefix_OS_Imagestreams_stats" with modules for each imagestream in our environment (the number is configured in the .conf).
The agent OS_Imagestreams_stats will contain the following modules for each Imagestream:
| <nombre imagestream> - storage |
| <nombre imagestream> - images |

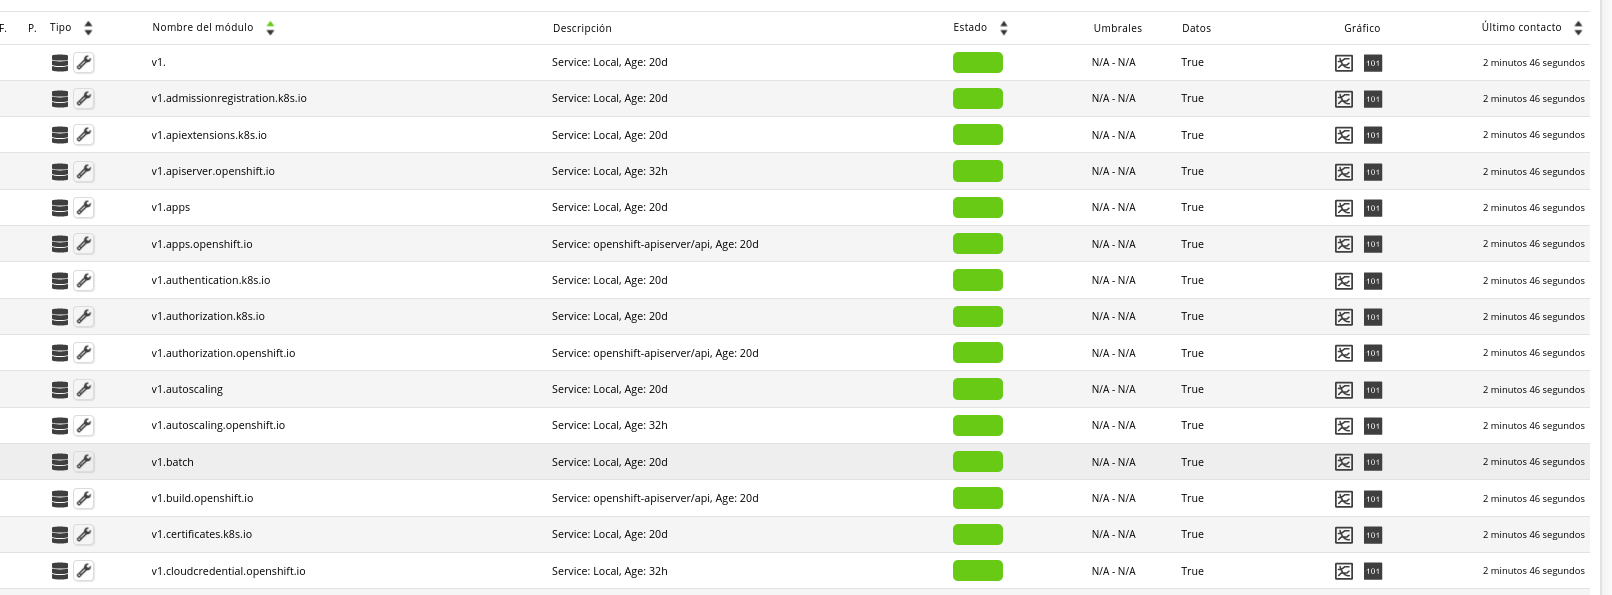
- An agent with name "prefix_OS_Api_service" with modules for each element of our api.
| Elemento API |
- An agent named "prefix_OS_Replication controllers with the following modules for each replication controller:
| <Replication controller nombre> Desired |
| <Replication controller nombre> Current |
| <Replication controller nombre> Ready |
| <Replication controller nombre> Age |

- An agent named "prefix_OS_Services" with a module for each service in our environment.
| Servicio |

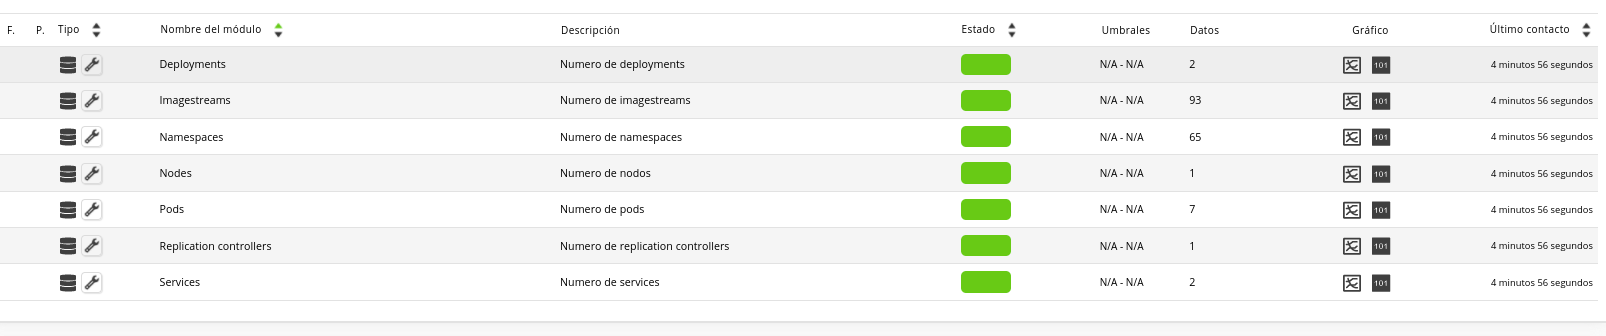
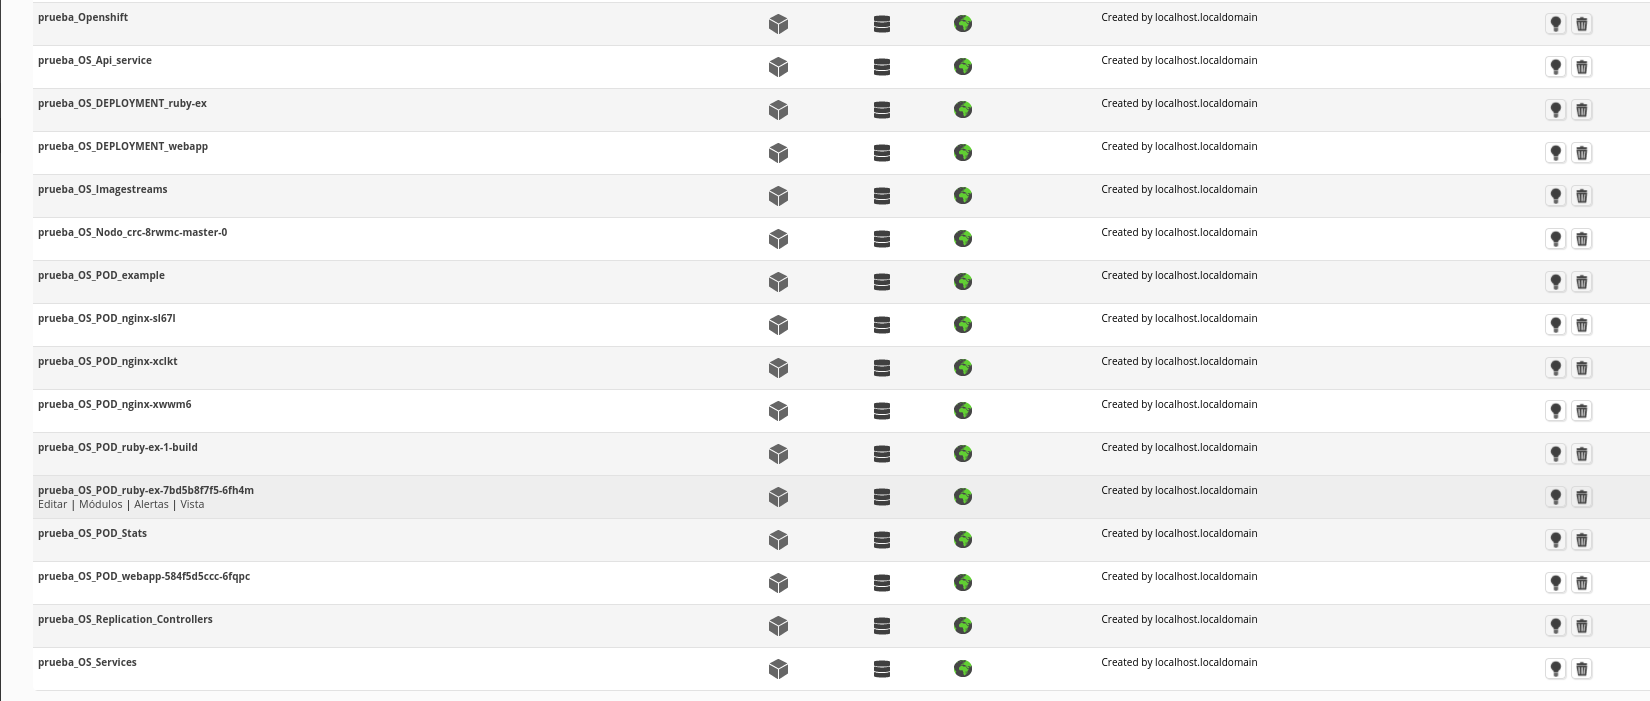
- In addition, the plugin will generate an agent called "prefix_Openshift" with modules that will indicate the number of certain elements in our environment.
The Openshift agent will contain the following modules:
| Services |
| Deployments |
| Namespaces |
| Nodes |
| Pods |
| Imagestreams |
| Replication controllers |
Example of agent view after plugin execution
Possible problems
Error from server (ServiceUnavailable)
Error from server (ServiceUnavailable): the server is currently unable to handle the request (get nodes.metrics.k8s.io)
Error from server (ServiceUnavailable): the server is currently unable to handle the request (get pods.metrics.k8s.io)
This error occurs because the commands that take the metrics from the nodes and pods cannot be invoked.

Most likely it is because the metric server or the monitoring option in the openshift environment is disabled, or has been disabled. Make sure the server is running, you can see more data about this error from the openshift console which will indicate if there is a problem with monitoring.
Permissions
The plugin has internal openshift CLI commands that need permissions to run from the pandora agent.
It is recommended to give permissions to both the perl plugin and the conf with :
chmod 755 pandora_openshift.pl
chmod 755 pandora_openshift.conf
At the same time, the cli binary must also have the correct permissions, in this case root:root so that the pandora agent can execute it.
chown root:root /path_oc
chmod 755 /path_oc
Error control
The plugin works modularly, so if for some reason it fails to send the data, through terminal commands we can see where it is failing. We will be able to see that part of the environment that we are getting the data is having problems to send the data (pods, nodes, deployments, etc).
With the parameter as_server_plugin of the conf to 0
Executing the plugin by terminal, if any part fails when sending the data it will print a module and in the description we will see which agent is the one that fails.
<path pandora_openshift.pl> <path pandora_openshift.conf>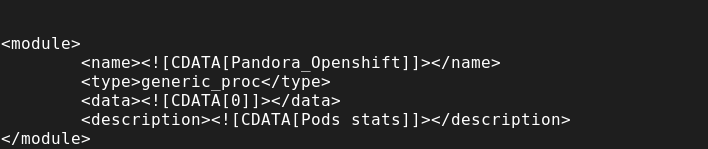
In this example we have painted a module in xml by terminal that tells us in the description that it has had problems with the pod_stats agent.
With the parameter as_server_plugin of the conf to 1
If we execute manually the plugin by terminal with the option as_server_plugin to 1, this will paint by terminal a number, this number indicates in which part the plugin has failed.
| 9 | You have executed everything perfectly |
| 8 | Failed in openshift agent |
| 7 | Failed in replication controllers agent |
| 6 | Failed agent services |
| 5 | Agent api services failed |
| 4 | Failed in the imagestreams agent |
| 3 | Failed in deployments agents |
| 2 | You have failed in the agent pod stats |
| 1 | Failed in pod agents |
| 0 | Failed in node agents |