Pandora UX
Plugin that allows standard execution of pre-recorded PDR and PWR sessions.
Introduction
Plugin that allows the standard execution of pre-recorded PDR and PWR sessions.
General parameters
Parameters
| Nombre | Description |
| -exe | Directory to the binary of your automation utility or test tool. It is also possible to select the internal mode: ** Windows only: PDR - complex desktop check tool. ** windows & linux: PWR - complex web check tool (with Selenium). ** requires curl in the PATH: stats - fast web server performance monitoring. ** linux only: goliat - web checks based on Pandora Webserver |
| -args (opcional) | Arguments for the automation tool |
|
Script(s) to be executed.
|
|
| -folder (opcional) | Directory in which the screenshots will be stored |
| * PWR: defines the name of the transaction. * PWD: name of the phase, you can define as many as you need. example: -name phase1,phase2,phase3 should match with the defined scripts |
|
| -pwr_port(opcional) | PWR server listening port 4444 by default, requires -exe PWR |
| -pwr_host(opcional) | Host on which the PWR server is located Localhost by default, requires -exe PWR |
| -pwr_browser(opcional) | Browser in which PWR checks will be executed *Firefox by default, requires -exe PWR |
| -pwr_classic(opcional) | Use the old libraries Test::WWW::Selenium PandoraFMS::WebDriver, requires -exe PWR, default 0 |
| -pwr_override_global_phase_time (opcional) |
Substitute the value of the global module time, by the sum of all phases. If the token is set to 1, the sum of all phases will be used as the module value. |
| -retries (opcional) | Maximum number of retries in case of error |
| -ss_config (opcional) | Configuration of the screenshots: X,Y,Width,Height example: -ss_config 0,0,0,100,100 will get a 100x100 image from coordinates 0,0 [Windows only]: activate the -ss_config parameter to capture the active window. |
| -checkpoint (opcional) | Create a new control screenshot |
| -s(opcional) | Substitution macro, replaces each instance of _text_ with the configured value. It is possible to use now+1 as the value to insert the current day. You can set as many macros (-s) as you need, followed by formatting (-f) if is needed: -s macro1=value1 -f format1 -s macro2=value2 -f format2 |
| -f(opcional) | Format for date type macros uses std notation: example: -f "%y%m%d" with date 2016, Sep 13 to get 160913. |
| Uses the errorlevel output for checks in case of failure. It is checked by default in case the plugin returns any '[error]' phase. |
|
| -max_differences(opcional) | Specifies the maximum percentage difference between the control image and those obtained as a result of the test. By default it is set to the numerical value 0.5. |
Email configuration
| -to (opcional) | Destination email address to be sent in case of error |
| -from (opcional) | Email sender |
| -subject (opcional) | Email subject |
| -content (opcional) | Email content |
| -smtp_gw (opcional) | smtp server gateway, 127.0.0.1 by default |
| -smtp_port (opcional) | Smtp server port. 25 by default |
PandoraFMS modules configuration
| -t name (opcional) | (PDR mode only) enables and configures a name for the "global" transaction. From all check modules will be associated to the global transaction module, named 'UX XXXX name'. transaction module, called 'UX XXXX name'. |
| -interval (opcional) | Set a module interval for the modules resulting from the test |
| -g (opcional) | Configures a module group for the modules resulting from the test |
| -post (opcional) | Command to be executed at the end of the check, e.g. kill firefox: -post "taskkill /F /IM firefox.exe" -post "killall firefox". |
| -tag_list x (opcional) | Add x (comma separated) tags to the generated modules, example: tag1,tag2,... |
Extra fields
| -exit_on_fail (opcional) | Immediately terminate the transaction if it is not possible to connect to the server. PWR. 0 by default |
| -phase_snapshot (opcional) | Generates one screenshot per phase. 0 by default. |
| -classic_mode (opcional) | The token set to 0 always updates the latency. The token to 1 only updates the latency if the check is successful. the check has been successful. 0 by default. |
| -v (opcional) | Activates verbose mode |
| -agent (opcional) | Defines the execution as a server plugin, configures the name of the agent in which the output modules will be stored. where the output modules will be stored |
| -agent_group (opcional) | If the "agent" token is defined and a new agent is created, it configures the group to which it will belong. |
| -interval (opcional) | If the "agent" token is defined and a new agent is created, it configures the interval it will have. it will have. 300 by default |
| -tentacle_ip (opcional) | tentacle server ip. 127.0.0.1 by default |
| -tentacle_port (opcional) | Tentacle server port. 41121 by default |
| -tentacle_opts (opcional) | Extra tentacle server options |
| -local_folder (opcional) | Tentacle local directory. /var/spool/pandora/data_in by default |
| -mode (opcional) | [local|tentacle] transfer mode, "local by default". |
Session automation
Execution of PWR sessions
Standard execution
To launch pre-recorded PWR sessions, we will indicate that the working mode is PWR (with the -exe parameter), and the file containing the session guidelines. With the -script parameter which receives html(v2) and .side(v3) files:
pandora_ux_x64.exe -exe PWR -script tests\std.sideOptionally, we can indicate the directory where we will save the screenshots in case of failure in the check and the ip and port where the selenium hub that will perform the check is hosted.
pandora_ux_x64.exe -exe PWR -script tests\std.side –folder C:\sondas\ -pwr_host 192.168.80.40 –pwr_port 4445The following modules will be returned:
UX_Time_project_name
UX_Status_project_name
If there is any phase with error, the following module will also be created:
UX_Snapshot_project_name
It will show a snapshot of the web at the time of the error as long as it is running on the same machine where the Selenium server is running.
Example of output with successful execution:
<module>
<name><![CDATA[UX_Status_std.side]]></name>
<type>generic_proc</type>
<data><![CDATA[1]]></data>
<description><![CDATA[Test OK]]></description>
</module>
<module>
<name><![CDATA[UX_Time_std.side]]></name>
<type>generic_data</type>
<data><![CDATA[16.317]]></data>
<description><![CDATA[Test OK]]></description>
</module>
Example of output with failed execution:
<module>
<name><![CDATA[UX_Status_std.side]]></name>
<type>generic_proc</type>
<data><![CDATA[0]]></data>
<description><![CDATA[Failed to execute verifyText]]></description>
</module>
<module>
<name><![CDATA[UX_Time_std.side]]></name>
<type>generic_data</type>
<data><![CDATA[15.463]]></data>
<description><![CDATA[Failed to execute verifyText]]></description>
</module>
<module>
<name><![CDATA[UX_Snapshot_std.side]]></name>
<type>async_string</type>
<data><![CDATA[data:image/png;base64,
iVBORw0KGgoAAAANSUhEUgAA…JRU5ErkJggg==]]></data>
<description><![CDATA[Image (last error)]]></description>
</module>
Transaction-based execution
If the check has been recorded with additional transaction-based information, the system itself will generate the necessary modules to identify each of the phases indicated.
pandora_ux_x64.exe -exe PWR -script tests\std.html –folder C:\sondasThe following modules will be returned per phase*:
- UX_Time_project_name.phase_#order
- UX_Status_project_name.phase_#order
If there is any phase with error, the following module will also be created:
- UX_Snapshot_project_name.phase_#order.
It will show a snapshot of the web at the time of the error.
Global snapshot modules identified with the following names will also be returned:
- UX_Global_Time_project_name.
- UX_Global_Status_Project_Name
- UX_Global_Snapshot_project_name
Will display a snapshot of the web at the time of the error.
*#order represents the number corresponding to the order in which it has been declared (1, 2, 3...).
PDR session execution
Standard execution
To launch pre-recorded PDR sessions, we will indicate that the working mode is the path to the file pdr.cmd, the argument of this file "-r", the file containing the session guidelines (-script), the directory where to store the screenshots (-folder) ending in '-'.
In the following execution the screenshot is also customized to collect only the active window:
pandora_ux_x64 -exe C:\PDR\pdr.cmd -args -r -script C:\pandora_ux\calculadora.sikuli -folder C:\pandora_ux\ -ss_config activeThe following modules will be returned:
- UX_Time_project_name
- UX_Status_project_name
- UX_Control_Snapshot_project_name*
If there is any phase with error, the following module will also be created:
- UX_Snapshot_project_name.
It will show an image of the active window (with -ss_config active) at the time of the error.
Example of output with successful execution:
<module>
<name><![CDATA[UX_Status_calculadora.sikuli]]></name>
<type>generic_proc</type>
<data><![CDATA[1]]></data>
<description><![CDATA[C:\pandora_ux\calculadora.sikuli
completed
Control snapshot rebuilt
]]></description>
<tags>UX</tags>
<module_group>UX</module_group>
</module>
<module>
<name><![CDATA[UX_Time_calculadora.sikuli]]></name>
<type>generic_data</type>
<data><![CDATA[20.204]]></data>
<description><![CDATA[C:\pandora_ux\calculadora.sikuli
execution
completed
Control snapshot rebuilt
]]></description>
<tags>UX</tags>
<module_group>UX</module_group>
<module_parent>UX_Status_calculadora.sikuli</module_parent>
</module>
<module>
<name><![CDATA[UX_Control_Snapshot_calculadora.sikuli]]></name>
<type>async_string</type>
<data><![CDATA[data:image/png;base64,
IBCAIAAAAOCnfhAAAAAXNSR…/4x79e/7757f8H2C00s1C73yMAAAAASUVORK5CYII=]]></data>
<description><![CDATA[Control image rebuilt]]></description>
<tags>UX</tags>
<module_group>UX</module_group>
<module_parent>UX_Status_calculadora.sikuli</module_parent>
</module>
* Only in the first run
Example of output with failed execution:
<module>
<name><![CDATA[UX_Status_std.html]]></name>
<type>generic_proc</type>
<data><![CDATA[0]]></data>
<description><![CDATA[Failed to execute verifyText]]></description>
<tags>UX</tags>
<module_group>UX</module_group>
</module>
<module>
<name><![CDATA[UX_Time_std.html]]></name>
<type>generic_data</type>
<data><![CDATA[15.463]]></data>
<description><![CDATA[Failed to execute verifyText]]></description>
<tags>UX</tags>
<module_group>UX</module_group>
<module_parent>UX_Status_std.html</module_parent>
</module>
<module>
<name><![CDATA[UX_Snapshot_std.html]]></name>
<type>async_string</type>
<data><![CDATA[data:image/png;base64,
iVBORw0KGgoAAAANSUhEUgAA…JRU5ErkJggg==]]></data>
<description><![CDATA[Image (last error)]]></description>
<tags>UX</tags>
<module_group>UX</module_group>
<module_parent>UX_Status_std.html</module_parent>
</module>
Transaction-based execution
If we have recorded different processes with PDR and we have tested that they work by playing them continuously, we will execute as follows:
pandora_ux_x64.exe -exe C:\PDR\pdr.cmd -args -r -t calculadora_trans -script C:\PDR\calc.sikuli,C:\PDR\savecalc.sikuli,C:\PDR\savefile.sikuli
-folder C:\PDR\ -ss_config active
As can be seen, we will simply indicate the path of the new script in the -script parameter separated by a comma from the previous script and we will use the -t parameter with the name of the transaction that will encompass the different phases. If we had a process with more phases we would follow the same logic; for example:
pandora_ux_x64.exe -exe C:\PDR\pdr.cmd -args -r -t proceso_transaccional -script C:\PDR\script1,C:\PDR\script2,C:\PDR\script3,C:\PDR\script4 -folder C:\PDR\ -ss_config activeThe line to add to the agent configuration file, for this case, will be the following:
module_plugin pandora_ux_x64.exe -exe C:\PDR\pdr.cmd -args -r -t calculadora_trans -script C:\PDR\calc.sikuli,C:\PDR\savecalc.sikuli,C:\PDR\savefile.sikuli -folder C:\PDR\ -ss_config active -checkpoint -post "taskkill /F /IM calc.exe"Thanks to the -checkpoint parameter we will be able to see screenshots of the final result of each phase in the Pandora FMS console.
The following modules per phase* will be returned:
- UX_Time_project_name.phase_#order.
- UX_Status_project_name.phase_#order
If there is any phase with error, the following module will also be created:
- UX_Snapshot_project_name.phase_#order.
It will show a snapshot of the web at the time of the error.
Global snapshot modules identified with the following names will also be returned:
- UX_Global_Time_project_name.
- UX_Global_Status_Project_Name
- UX_Global_Snapshot_project_name
Will display a snapshot of the web at the time of the error.
*#order represents the number corresponding to the order in which it has been declared (1, 2, 3...).
 Remark: Error captures will only be displayed when the UX client (PWR) and the PWR server are running on the same machine. Otherwise, the directory where the images are delivered by the PWR server must be accessible by the client in order to display the image in Pandora.
Manual execution
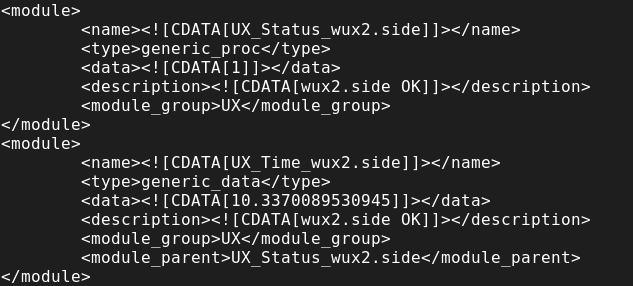
If the plugin is executed via terminal, an xml will be displayed (if the agent parameter is not used, which is the one that must be used to use the plugin in server mode).
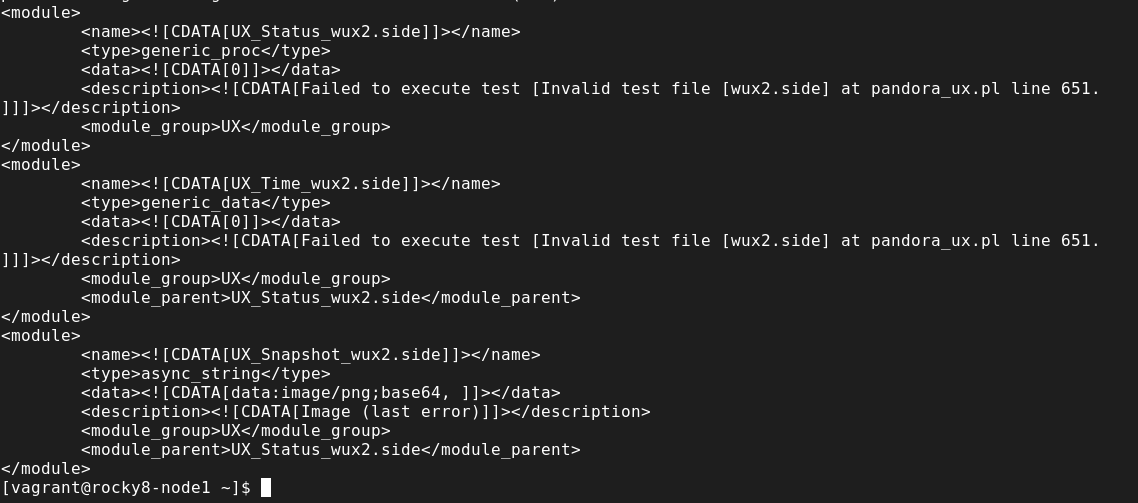
If something fails in the transaction, an extra module named "Ux_Snapshot_<file transaction>" will be created which will show the image of the part where the transaction failed. With the -folder parameter you can choose the folder where the image will be saved.
Example XML successful plugin execution
Example XML failed plugin execution
Configuration in PandoraFMS
Example running the plugin as an agent plugin
https://pandorafms.com/guides/public/link/816#bkmrk-para-usar-este-plugi
To use this plugin in agent mode, you should call the plugin with a command with the parameters that you are using, this can be done from the pandora_agent.conf file located in "/etc/pandora". Although if the remote configuration is enabled, it can be done from the console.
To call the plugin use the module_plugin parameter followed by the command at the end of the file:
Example:
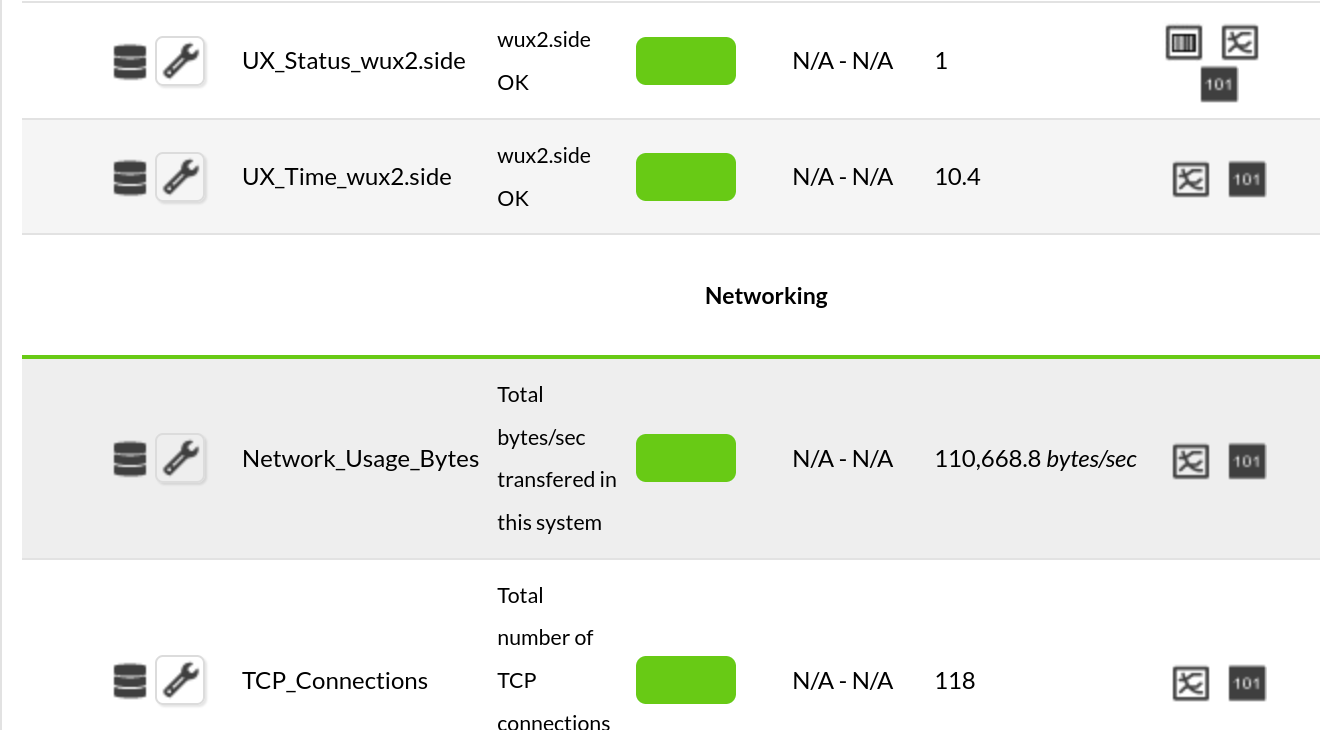
module_plugin /pandora_ux.64 -exe pwr -script wux2.side -pwr_port 4444 -pwr_host 172.42.42.1In the next interval that the agent is updated, the modules inside the EndPoint in which we are calling it will appear.
Example running the plugin as a server plugin
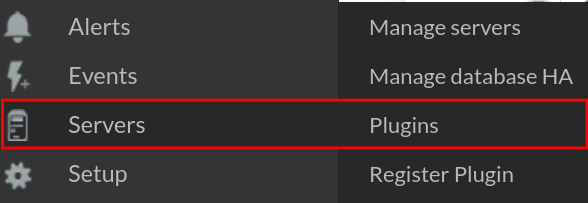
Go to servers > plugins:
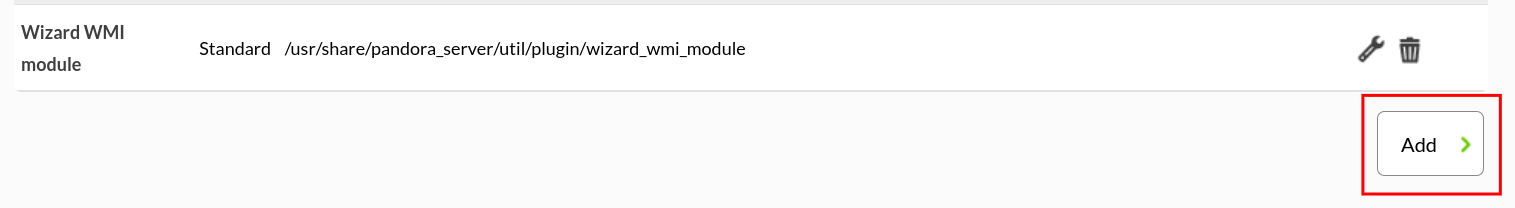
Click on add:
The name and description of your choice is given:

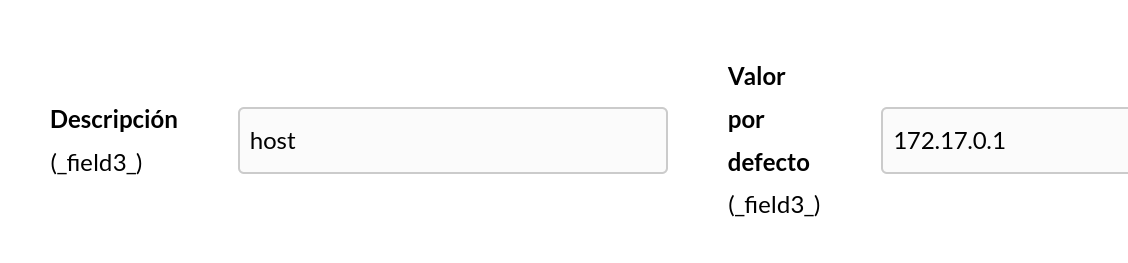
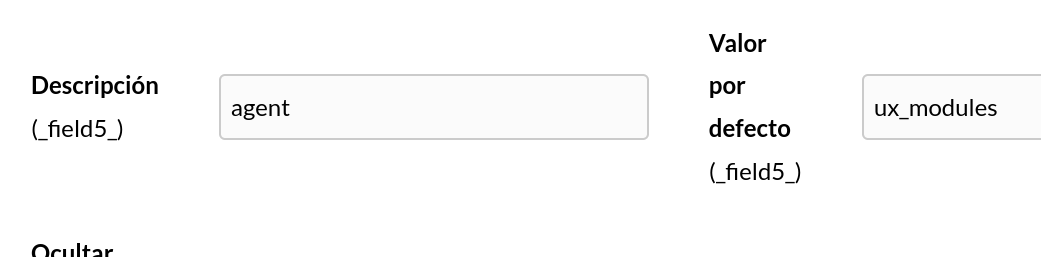
Below in "plugin command" you must enter the path where we have the UX plugin. In plugin parameters we will enter all the parameters we want to use to customize the plugin execution followed by the _field_ macro that will allow us to store the values of these parameters below.
* If you are going to use the plugin as a server plugin, you must use the agent parameter, since this makes the plugin execution show a basic value with which we can see the status of the execution instead of an xml that is what we would use if we want to use the plugin in agent mode.

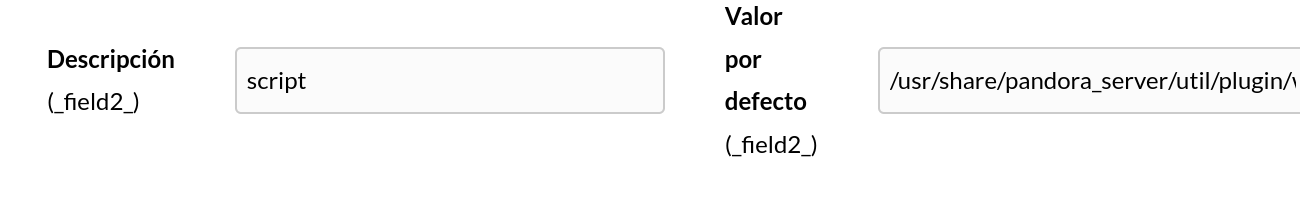
A description can be added to each macro to identify it followed by a value.
Macro _field1_

Macro _field2_
Macro _field3_
Macro _field4_

Macro _field5_
Once this is done, you can see in the command preview this command, and by executing it via terminal you can see if the data entered are correct.

If it is introduced by terminal it should show a 1 if everything has gone correctly with the transaction.
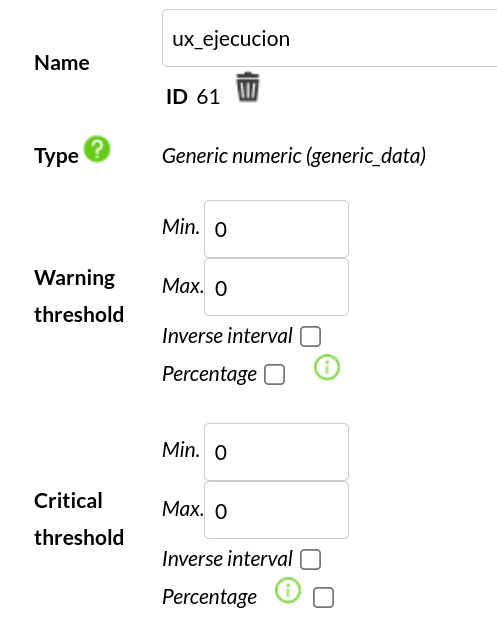
Once these steps are done and the plugin is configured to the user's whim, a module must be created, which will show the status of the plugin execution, for this it is required to go to an agent and create a new plugin server module.

The module will be given the name of your choice.
And in the plugin label the plugin that has just been created will be selected, you can see how the parameters that we have entered by the macros appear below.
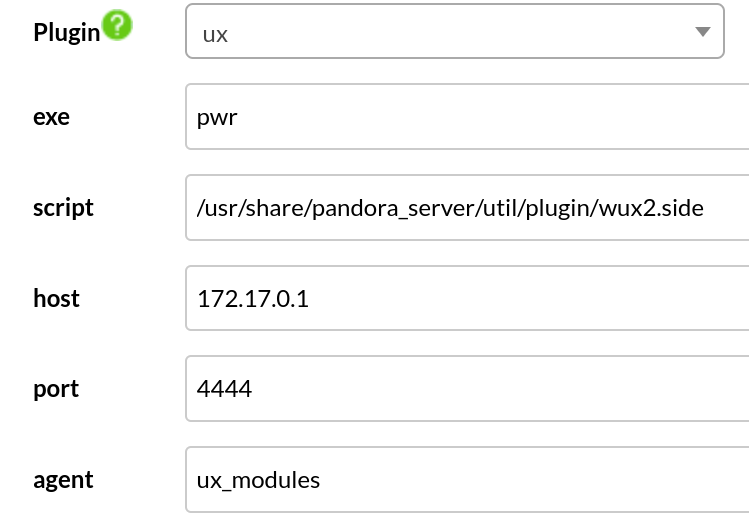
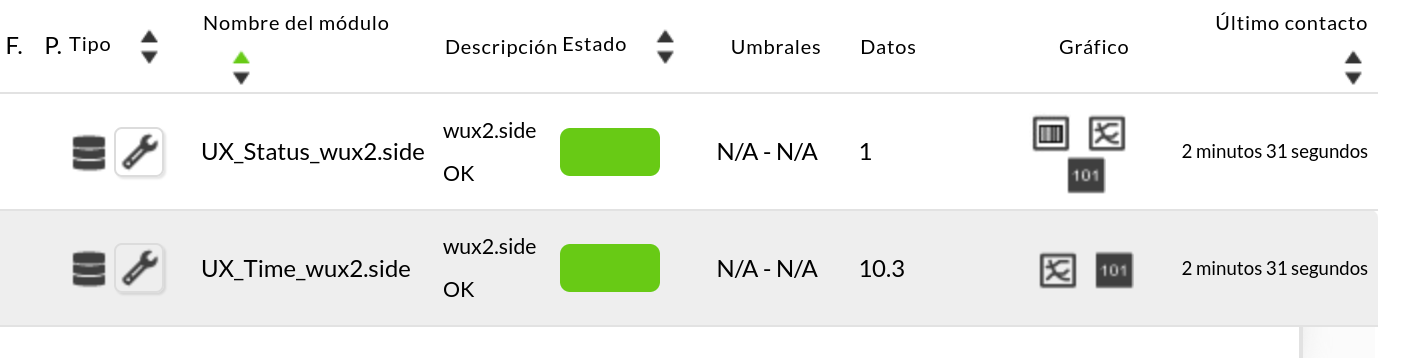
Once this is done the module must be created and it will appear in the modules view with 1 if the plugin execution is not having problems.

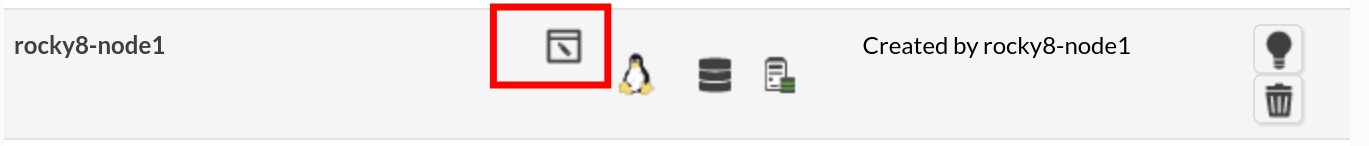
You can see that an agent has been created with the name given by parameter.
And within this you can see the modules with the status of the transaction.