Pandora FMS Plugin JMX
Plugin for monitoring application servers based on JMX technology
- Introduction
- Compatibility matrix
- Prerequisites
- Configuration
- Manual execution
- Configuration in Pandora
- Modules generated by the plugin
Introduction
View.
Plug-in for monitoring application servers based on JMX technology.
Type: Server plug-in
Compatibility matrix
Developed using IBM WebSphere 8.5.5.13, and Weblogic 12.1.3.0.0.0 using agent
WAR Jolokia 1.5.0
Compatible with:
| Websphere |
| Weblogic |
| Tomcat |
| WebSphere |
| JBoss |
| Kafka |
Prerequisites
It is required to deploy the Jolokia application on the application server we want to monitor.
monitor.
On the machine that will run the plugin, the jmx4perl libraries must be installed.
A series of basic checks are performed "by default", although they can be
can be suppressed or customised.
An "open" interface is available to specify queries to Mbeans,
allowing you to manage the monitoring of Java resources.
A connection to the Tentacle service associated to your Pandora FMS server is required (for local executions of the plugin) under
local executions of the plugin) under the following conditions:
● If you have as_server_plugin enabled.
If you have agent_per_instance enabled.
Deployment of this plugin by binaries does not require any special requirements.
Requires the PandoraFMS::PluginTools.pm library.
This library is available with the installation of Pandora FMS OpenSource package.
You can download the latest version from:
https://github.com/pandorafms/pandorafms/blob/develop/pandora_server/lib/PandoraFMS/PluginTools.pm
Configuration
JOLOKIA INSTALLATION
Download the Jolokia agent from the official website: https://jolokia.org/download.html
Jolokia Agent Securisation (WAR)
You can assign security policies to restrict both access and use of the options available in the Jolokia agent.
These restrictions can be specified in a policy XML file. This file is divided into sections with which you can control various parameters:
IP-based restrictions
General access can be allowed based on the IP address of an HTTP client. This restriction is specified in the<remote> section, it will contain <host> elements. The source can be an IP address, a hostname, or a network in CIDR format.
The following example allows access from localhost and all clients on the network
10.0.0.0/16:
<remote>
<host>localhost</host>
<host>10.0.0.0/16</host>
</remote>Command Restrictions
You can restrict the commands that will be allowed to be executed in a general way, by specifying which commands are allowed. To do this, use the <commands> section by specifying each command with a <command> element.
The following example enables the commands READ, LIST, SEARCH and VERSION . The other commands ( WRITE, EXEC ) would not be available:
<commands>
<command>read</command>
<command>list</command>
<command>version</command>
<command>search</command>
</commands>There are restrictions on mbeans queries and request sources. Full help is available at the following link: https://jolokia.org/reference/html/security.html
https://pandorafms.com/guides/public/link/233#bkmrk-ejemplo-de-pol%C3%ADtica-
Example security policy
This example allows connection from localhost and network 10.0.0.0.0/16. The available commands are also limited to READ,LIST,VERSION and SEARCH.
<?xml version="1.0" encoding="UTF-8"?>
<restrict>
<remote>
<host>127.0.0.1</host>
<host>localhost</host>
<host>10.0.0.0/16</host>
</remote>
<commands>
<command>read</command>
<command>list</command>
<command>version</command>
<command>search</command>
</commands>
<http>
<method>post</method>
</http>
</restrict>Inclusion of a security policy
To repackage a policy in the WAR file of the Jolokia agent, you must follow these steps
following steps:
# Donwload war agent
$ jolokia
Note: You can download it manually from: http://search.maven.org/remotecontent?filepath=org/jolokia/jolokia-war/1.5.0/jolokiawar-1.5.0.war
# Download the sample policy template
# in the local directory as "jolokia-access.xml".
$ jolokia download --policyNote : If you received errors when executing the previous steps, you can download the sample policy from http://www.jolokia.org/templates/jolokia-access.xml.
Edit the policy and place the jolokia-war-VERSION.war file and the jolokia-access.xml file in the same directory.
# Repack the to add the policy file 'jolokia-access.xml' form the cwd
$ jolokia repack --policy jolokia.warYou should receive an output similar to the following:
$ jolokia repack --policy jolokia-war-1.5.0.war
* Adding policy WEB-INF/classes/jolokia-access.xml to
jolokia-war-1.5.0.war
You can perform a verification of the contents of the WAR file with the following command:
# Show current state (policy file include: yes/no)
$ jolokia jolokia.warJolokia on WebSphere
To install the proxy on IBM Websphere. Perform the following steps:
Select from the side menu:
Applications > New Application
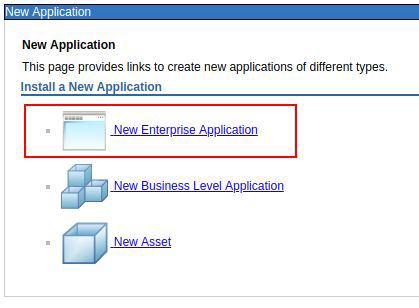
Select the Jolokia WAR file.

Press next .
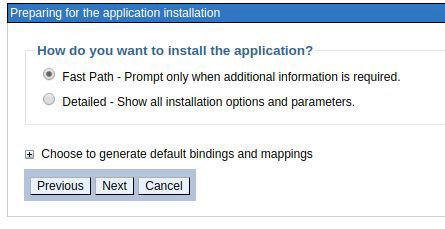
Keep the default options and press next.
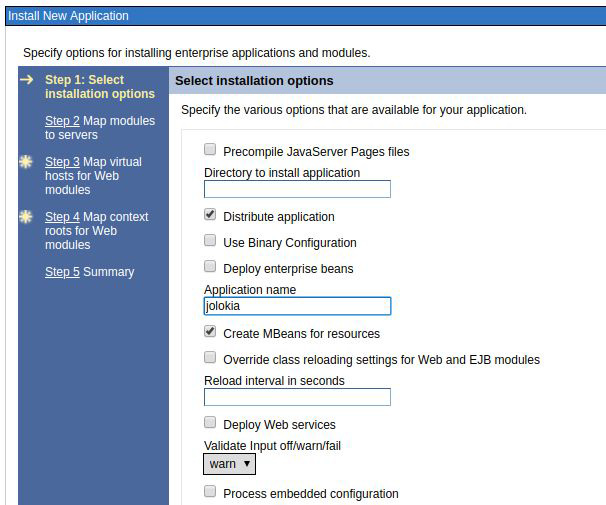
Modify the name of the application to "jolokia", no further changes are necessary on this screen. Press next.

Select the check box to map the new application to the desired server. Click next.

Select the check box to map the default virtual host. Click Next.
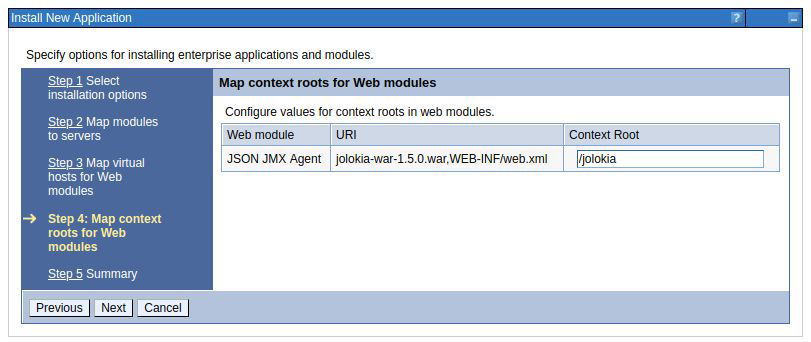
Set the root context of the application to /jolokia.
Press next.
Check the summary. Press finish.

Verify in the presented log that the application has been installed successfully. If so, press "Save directly to master configuration".
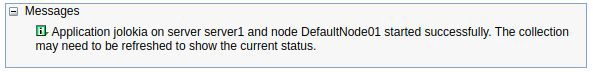
The application is now deployed. We will have to start it to be able to interact with it from the JMX plugin.
You should receive a message that the application has started successfully:
You can validate the installation of Jolokia at the following link:
https://localhost:9443/jolokia
You should receive an output in JSON format with general information about the Jolokia agent.

Jolokia on WebSphere with security enabled
To use the JMX plugin for data extraction from security-enabled IBM WebSphere environments, it will be necessary to make modifications to the Jolokia application (Jolokia file).
enabled environments, modifications to the Jolokia application (WAR file) are required.
WAR FILE).
Enable role-specific security mapping
This step adds the information for the role mapping to the jolokia.war file, which we will subsequently
later deployed on our application server.

IBM WebSphere Application Server Configuration
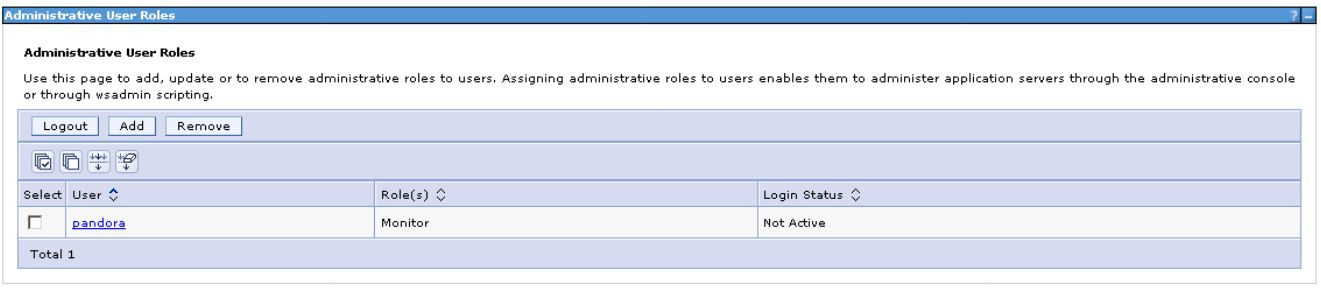
You will need to create a user with monitoring permissions. Users and groups > Manage users > Create user

And assign it the specific role "Monitor": Users and Groups > Manage User Roles > Add
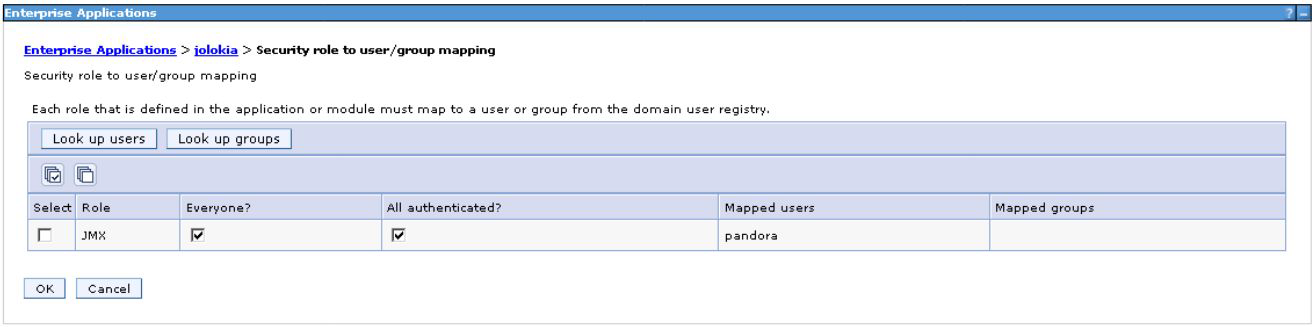
Once the user has been created and the correct role has been assigned, we carry out the mapping in the Jolokia application configuration:
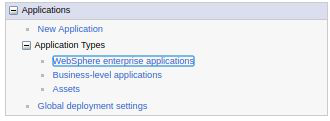
Applications > Company applications > Jolokia > Security role mapping to user/group.
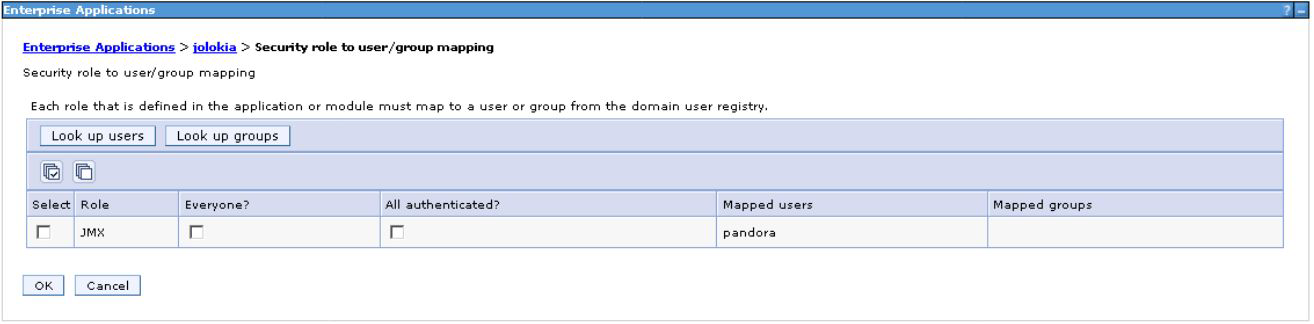
Once the configuration is done, save the changes and restart the Jolokia application.
NOTE : It has been confirmed that in older versions of IBM WebSphere, there is a need to perform the user mapping by adding the ALL group to the mapping with the supervisor role
mapping of users by adding the ALL group to the mapping with supervisor role:
https://pandorafms.com/guides/public/link/233#bkmrk-los-cambios-a-realiz
The changes to be made are:
Activate "all" and "all authenticated" in the JMX - user mapping in the configuration of
Jolokia configuration:
Link the requests of the "All" group in group management:

Jolokia on Weblogic
Previous steps
To ensure full functionality of the JMX plugin in Weblogic, you should check a number of previous configurations. If you decide to skip these steps, monitoring may be limited.
Note : If your monitoring needs are limited to application listing, status, number of invocations, resource consumption and general application server status, you can ignore this section.
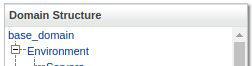
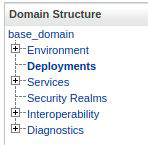
Access the server configuration screen at:
Base Domain > Environment > Servers

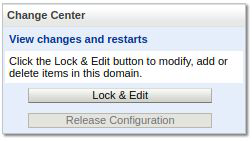
Press Lock and Edit to enable editing of the configuration:
Click on the server where the Jolokia application will be deployed:

Habilite IIOP

Press save .
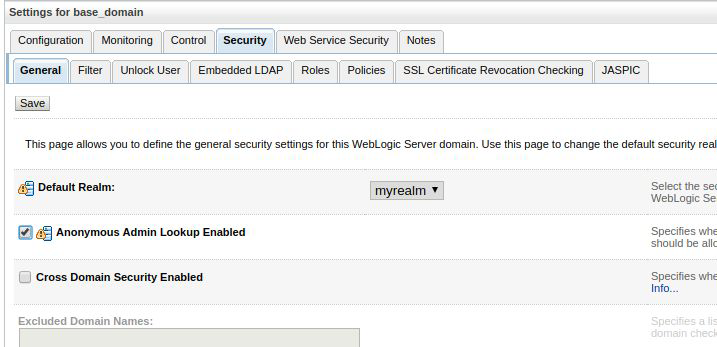
Select Base Domain from the menu
On the Security tab, enable Anonymous Admin Lookup:
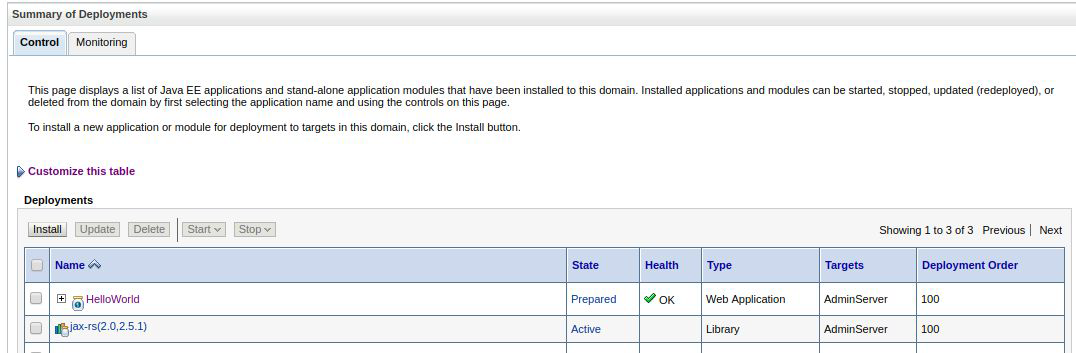
Deployment of Jolokia
On the screen that appears, select the Install option.
Select the upload your file(s) link to display the file upload form:
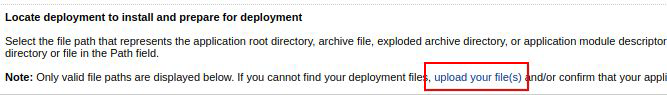
Select the Jolokia WAR file from your computer and press next :
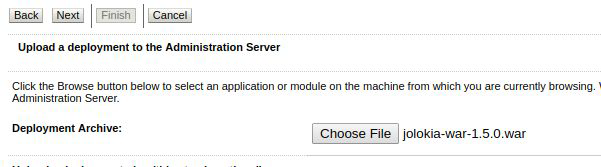
The location will be populated with the WAR file upload path. Press next
to start the installation process.

Select the custom role security model and press next .
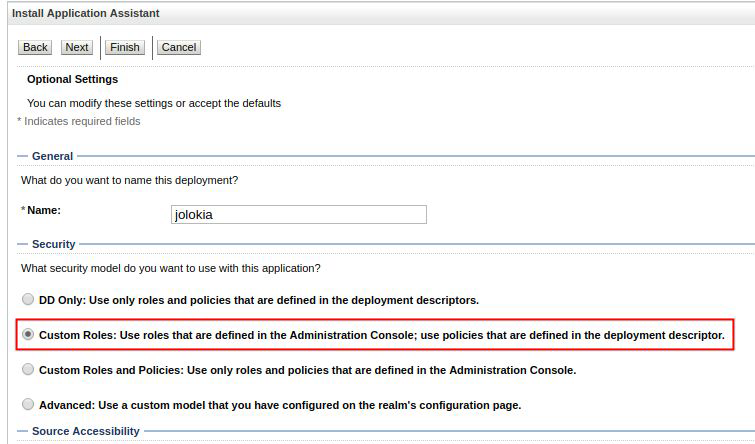
Update the name of the deployment and keep the proposed configuration.
Press Next .
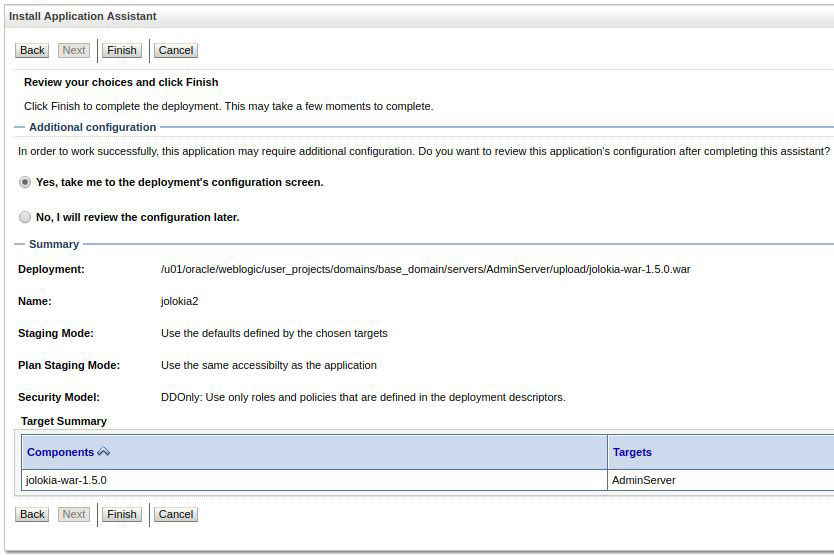
Click Finish .
At this step, the application is deployed on the JMX application server. In
the Configuration tab, select the entry point from where the service will be served, by configuring the
service, configuring the "root context":

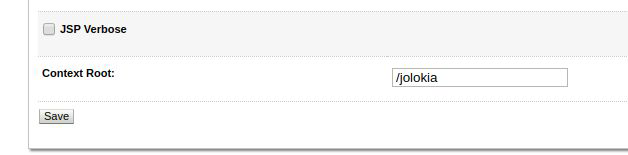
Press save to save your changes.
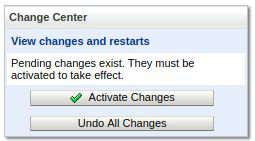
https://pandorafms.com/guides/public/link/233#bkmrk-presione-activar-cam
Press Activate changes to apply the changes.
Once the changes have been applied, the Jolokia application will be displayed ready to be started.
to be started:
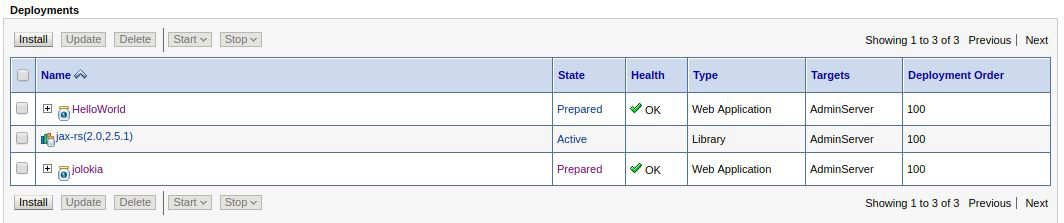
Select the checkbox and click start > Start all requests

After the start-up process, the application will appear as Active .

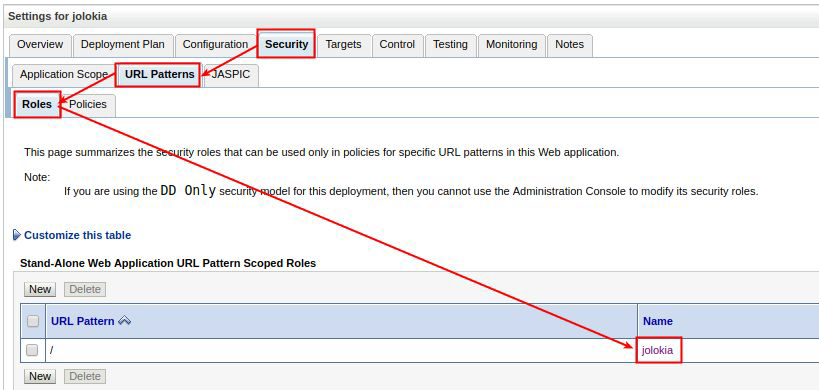
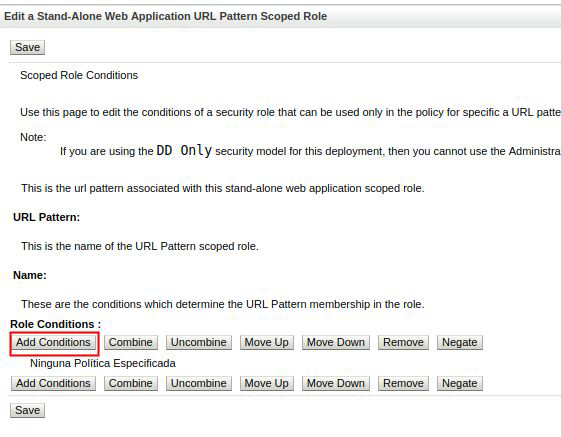
Edite el rol de seguridad de la aplicación para agregar las condiciones de acceso que desee (permitir grupos, usuarios, etc.)
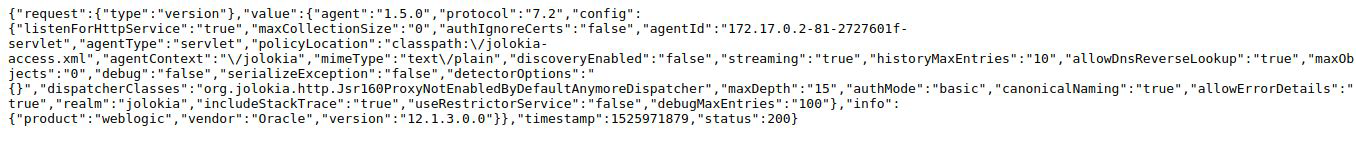
You can validate the installation of Jolokia at the following link:
https://localhost:7001/jolokia
You should receive an output in JSON format with general information about the Jolokia agent.
Jolokia in Apache Kafka
To monitor an Apache Kafka server, the JVM agent Jolokia is required instead of the WAR agent. Just download it from the official website:
https://jolokia.org/download.html
Get the PID of the Apache Kafka server:
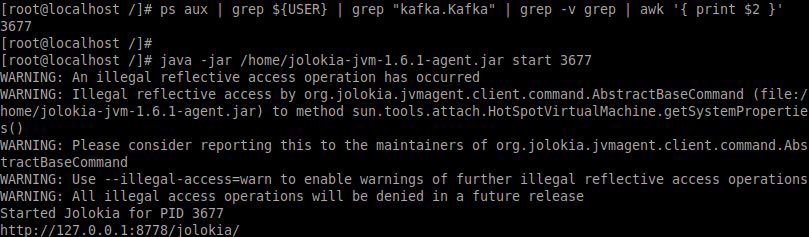
And we relate the JVM agent to the server by means of the server with
$ java –jar agente.jar start pidYou can validate the installation of Jolokia at the following link:
http://localhost:8778/jolokia/
JMX4PERL INSTALLATION
On the computer where you will run the JMX plugin you will need to install the necessary Perl libraries:
JMX::Jmx4Perl
JMX::Jmx4Perl::Alias
JMX::Jmx4Perl::RequestTo install the libraries you need an internet connection and CPAN.
# cpan install JMX::Jmx4PerlAlthough the following applications are extremely useful for exploring the mbean of our application servers, it is possible that they may conflict because of libraries or packages yet to be installed.
jmx4perl
check_jmx4perl
j4pshj4psh
https://pandorafms.com/guides/public/link/233#bkmrk-en-un-entorno-de-pro
In a production environment we recommend ignoring suggestions for additional applications and installing only the JMX::Jmx4Perl library.
Do not respond to all requests to install additional components:
Install 'jmx4perl' ? (y/n) [y ]n
Install 'check_jmx4perl' ? (y/n) [y ]n
Install 'cacti_jmx4perl' ? (y/n) [y ]n
Install 'j4psh' ? (y/n) [y ]nManual execution
To run the plugin, configure the configuration file according to the instructions above.
instructions.
Running the plugin:
Code version without deployed libraries:
perl -I PandoraFMS pandora_plugin_jmx.pl jmx.confWhere, PandoraFMS is a directory containing the PluginTools.pm library.
Note: If you have the PandoraFMS (opensource) libraries deployed, it is not necessary to include the -I PandoraFMS argument.
Configuration in Pandora
CONFIGURATION
The configuration file of the JMX monitoring plugin is divided into blocks:
Connection data
########################################################################
## Connection data
########################################################################
## URL endpoint of the target server
## Tomcat (example)
#server_url http://localhost:8080/jolokia
## Websphere (example)
#server_url http://localhost:49163/jolokia
## Weblogic (example)
#server_url http://192.168.70.237:7001/jolokia
## Product; product id of an specific technology
## (tomcat, jboss, weblogic, websphere, etc). By default the plugin uses autodetection
#product weblogic
## Timeout in seconds for an HTTP request (By default 180)
# timeout 180server_url
Indicates the url address where the Jolokia application is deployed.
product
It is recommended to define this field, as the autodetection process may take some time. Indicate the product to be monitored: tomcat, jboss, weblogic, websphere, etc.
Debug
########################################################################
## Others
########################################################################
## Plugin log output will be fully verbose (with debug information)
#debug 1debug
Set the value of this field to 1 to see detailed information in the plugin execution log. Default in /tmp/pandora_jmx_plugin.log
Scope of monitoring
########################################################################
## Monitoring checks
########################################################################
## Server info checks
server_info
## OS info checks
os_info
## Monitor deployed web applications
webapp_info
## Include also monitoring for internal applications (console, consolehelp,...)
#include_internal_webapps 0
## This list will be used later by "servlets_list_info"
## check like a white list (only the following servlets will be checked)
## Tomcat monitoring
#use_only_servlets_begin
#WebModule=//localhost/examples,name=HelloWorldExample
#WebModule=//localhost/host-manager,name=HTMLHostManager
#WebModule=//localhost/examples,name=wsSnake
#use_only_servlets_end
## Websphere monitoring
#use_only_servlets_begin
#WebModule=DefaultCell01,name=jolokia_war
#WebModule=DefaultCell01,name=Helloworld_war
#use_only_servlets_end
## Weblogic monitoring
#use_only_servlets_begin
#WebModule=WL_PROXY,name=JspServlet
#use_only_servlets_end
# Servlets info
# (by default all Servlets deployed in the App server; will use use_only_servlets list
to restrict target Servlets checked)
#servlets_list_info
## Servlet monitoring, retrieve attributes from detected servlets
#servlet_attributes startTime loadTime,servletClass,requestCount,loadOnStartupYou can configure the plugin to report the information you need:
server_info
Generate modules with JMX server information (1) or not (0).
os_info
Add OS monitoring modules (1) or not (0).
webapp_info
Monitor the applications deployed on the JMX server (1) or not (0). If you combine this parameter with agent_per_instance , as many agents will be created as applications you have deployed. This functionality has been tested with Weblogic only.
may not behave as expected with other application servers.
include_internal_webapps
Include in the list of monitored web applications, the internal applications of the JMX server (1) or not (0).
servlets_list_info
Servlet-based monitoring allows us to receive information about servlet availability. You can configure specific servlets to monitor by specifying:
use_only_servlets_begin
This will restrict servlet monitoring to the servlets specified line-by-line after this tag.
use_only_servlets_end
Indicates the end of the servlet definition.
Note: If you use servlets_list_info and do not define the use_only_servlets block, all available servlets will be parsed.
Inclusion of custom mbeans
########################################################################
## Request of specifics attributes
########################################################################
# Example 1: Get an specific parameter ("used") from "HeapMemoryUsage" attribute from
the MBean "java.lang:type=Memory"
mbean_check_begin
mbean_check_name MemoryUsed
mbean_check_type generic_data
mbean_check_module_group Module group
mbean_check_description In Bytes
mbean java.lang:type=Memory
attribute HeapMemoryUsage
path used
mbean_check_end
# Tomcat server specific checks
#include jmx.tomcat.conf
# Websphere server specific checks
#include jmx.websphere.conf
# Weblogic server specific checks
#include jmx.weblogic.conf
# Kafka server specific checks
#include jmx.kafka.confYou can define your own checks to retrieve specific information from mbeans. To do so, define as many check blocks as you need:
mbean_check_begin
Specifies the start of a specific mbean check definition block.
mbean_check_name
Is the module name as it will appear in Pandora FMS.
mbean_check_type
It indicates the type of data that will be assigned to the module in Pandora FMS.
mbean_check_module_group
You can customize the module group that will be applied to the monitors generated by the mbean data extraction.
mbean_check_description
It is the module description as it will appear in Pandora FMS.
mbean
Configure here the mbean to query.
path
Indicate the path where the mbean you want to check is hosted.
mbean_check_wmin
Specify the lower limit of the Warning threshold for the module.
mbean_check_wmax
Specifies the upper limit of the Warning threshold for the module.
mbean_check_wstr
Specifies the text as the Warning threshold for modules of type string.
mbean_check_winv
Reverses the direction of the Warning thresholds for the module.
mbean_check_cmin
Specifies the lower limit of the Critical threshold for the module.
mbean_check_cmax
Indicates the upper limit of the Critical threshold for the module.
mbean_check_cstr
Specifies the text as the Critical threshold for modules of type string.
mbean_check_cinv
Reverses the direction of Critical thresholds for the module.
mbean_check_end
Specifies the end of a specific mbean check definition block.
https://pandorafms.com/guides/public/link/236#bkmrk-macro-de-detecci%C3%B3n-d
mbean _jokeritem_ dynamic detection macro
In order to monitor complex mbeans, you can use the _jokeritem_ macro in such a way that as many modules as there are mbeans are generated.
macro in such a way that as many modules are generated as data the mbean provides:
Example configuration.
mbean_check_begin
mbean_check_name jms.messagescurrentcount._jokeritem_
mbean_check_module_group jvm.jms
mbean_check_type generic_data
mbean_check_description The current number of messages stored on this JMS server. This
number does not include the pending messages.
mbean com.bea:Name=_jokeritem_,ServerRuntime=_serverruntime_,Type=JMSServerRuntime
attribute MessagesCurrentCount
mbean_check_endMacro for server runtime selection
It is now possible to select the target runtime server dynamically using the _serverruntime_ macro.
Example configuration:
mbean
com.bea:Name=ThreadPoolRuntime,ServerRuntime=_serverruntime_,Type=ThreadPoolRuntimeinclude
You can specify as many extra configuration files as you need.
Data delivery configuration
########################################################################
## Request of all list of JMX information
## (Warning!!! this output is very very verbose, so use this check carefully)
########################################################################
#list_all_mbeans
## Report style
as_agent_plugin 0
agent_per_instance 1
## Custom header
module_header jmx_check_
## agent configuration
#agent_name custom_agent_name
#agent_interval 300
#agent_group JMX
## Pandora Server configuration
transfer_mode tentacle
tentacle_ip your.pandora.server.ip
tentacle_port 41121
tentacle_opts
tentacle_client "tentacle_client"
temp /tmp
local_folder /var/spool/pandora/data_inYou can configure the data delivery in Pandora FMS in several ways:
list_all_mbeans
It will generate a module with a list in text with all the available mbeans.
as_agent_plugin
If it is active (1), it will dump all the module information by screen in XML format to be executed from an agent.
XML format to be executed from an agent. If not active (0), it will deliver the information by
transferring complete XML to the server configured as destination.
agent_per_instance
If it is active (1), it will send the information of instances as individual agents to
Pandora FMS.
If the monitoring is based exclusively on mbeans, they will be grouped per
servlet.
● If the monitoring is based on web applications (webapp_info), as many agents will be created as many
agents will be created as many as the number of web applications deployed.
● An agent representing the application server itself will always be created.
If disabled (0), all module information will be sent in one single agent (application server name or
agent (application server name or the one specified in agent_name ).
module_header
Specifies a custom header for the modules generated by the plugin.
mode
XML file transfer mode, it can be:
● local: copies files to local_folder.
● tentacle: transfer files to tentacle_ip via tentacle_port
tentacle_ip
IP address or FQDN where Pandora FMS is working.
tentacle_port
Port where the Tentacle service associated to your Pandora FMS server is listening.
listening.
tentacle_opts
Extra options for the Tentacle client.
tentacle_client
Path where to find the Tentacle client binary.
local_folder
Location to move files to in local mode.
temp
Temporary location to store files before sending them.
Modules generated by the plugin
The standard execution of this plugin will return the following modules by default (with
all optional blocks enabled):
Classic monitoring:
Tomcat :
| Active Sessions |
| Max Sessions Allowed |
| Configuración connector SSL |
| Connector State |
| JSP Count |
| Class Load Time |
| Servlet count allocated |
| Servlet load tim |
| Servlet class |
| Servlet request count |
| Servlet load on startup |
| Webmodule configured |
| Webmodule start time |
| Webmodule request count |
| Webmodule state name |
Websphere :
| Active sessions |
| Invalid Sessions |
| Create count |
| Close count |
| Allocate count |
| Fault count |
| Percent used |
| Uso medio de CPU por componente web |
| Cache size |
| Directorio home de Websphere |
| Módulos j2EE de un cierto componente web |
| Prevent Jre Memory Leaks |
| Detect App CLLeaks |
| Bootstrap port |
| ORB Request timeout |
| ORB Request Retries Count |
| Nivel de traza |
| Tamaño del buffer de trazas |
| Tamaño máximo del pool de hilos |
| Tamaño mínimo del pool de hilos |
| Inactivity Timeout |
Weblogic :
| Locked Users Current Count |
| Lockout Duration |
| Lockout Enabled |
| Invalid Login Attempts Total Count |
| Pool Max Capacity |
| Execution Time Average |
| Invocation Total Count |
| Diagnostics Read Count |
| Diagnostics Delete Count |
| Diagnostics Update Count |
| Diagnostics Create Count |
| Mbean Completed Requests |
| Mbean Bytes Received Count |
| Mbean Bytes Sent Count |
| Mbean Connections Count |
| Mbean Public URL |
| Mbean Messages Sent Count |
| Mbean Messages Received Count |
| Mbean Execution Time Average |
| Mbean Execution Time Total |
| Mbean Invocation Total Count |
| Servlet State |
| Servlet Server Startup Time |
| Servlet Execution Time Average |
| Servlet Reload Total Count |
| Servlet Execution Time High |
| Servlet Invocation Total Count |
| Webmodule status |
| Webmodule Open Sessions High Count |
| Webmodule Session Invalidation Interval Secs |
| Webmodule Sessions Opened Total Count |
| Webmodule Module Id |
Kafka :
| Active Controller Brokers |
| Broker leaders |
| Incoming Bytes per second |
| Incoming Messages per second |
| ISR expansion Rate |
| ISR shrink rate |
| Network processors avg idle time |
| Number of disputed leader elections rate |
| Offline Controller Brokers |
| Outgoing Bytes per second |
| Request handlers avg idle time |
| Requests in fetch API purgatory |
| Requests in producer API purgatory |
| System’s partitions |
| Total time to serve a specified request (fetch API consumer) |
| Total time to serve a specified request (fetch API follower) |
| Total time to serve a specified request (producer API) |
| Unclear leader election rate |
| Under-replicated partitions |
Example of web application monitoring
This specific monitoring is only compatible with Weblogic in version 723
of the plugin.
With the following basic configuration:
## Weblogic
server_url http://10.1.2.3:7001/jolokia
## product
product weblogic
# checks
server_info
os_info
webapp_info
include_internal_webapps 0
# Specific beans
mbean_check_begin
mbean_check_name MemoryUsed
mbean_check_type generic_data
mbean_check_description In Bytes
mbean java.lang:type=Memory
attribute HeapMemoryUsage
path used
mbean_check_end
## Report style
as_agent_plugin 0
agent_per_instance 1
## Agent personalization
agent_name my JMX appserver
agent_interval 300
agent_group JMX
## Pandora Server configuration
transfer_mode tentacle
tentacle_ip your.pandora.server.ip
tentacle_port 41121
tentacle_opts
tentacle_client "tentacle_client"
temp /tmp
local_folder /var/spool/pandora/data_inThis configuration will return the following modules (remember that an agent will be created for each web application you have deployed on your application server).
List of modules
Modules assigned to the main agent (represents the application server itself)
| check_jmx_classes_total |
| check_jmx_threads_current |
| check_jmx_threads_peak |
| check_jmx_runtime_name |
| check_jmx_jvm |
| check_jmx_jvm_startup |
| check_jmx_max_file_desc |
| check_jmx_file_desc_open |
| check_jmx_memory_used |
| check_jmx_MemoryUsed |
Modules assigned to each of the agents that represent the web applications
deployed:
| APP_NAME State |
| APP_NAME InvocationTotalCount |
| APP_NAME ReloadTotalCount |
| APP_NAME Executiontimetotal |
| APP_NAME ExecutionTimeAverage |
| APP_NAME Status |