Pandora Azure Event Hubs
Plugin to monitor an azure Event Hubs namespace.
- Introduction
- Compatibility matrix
- Prerequisites
- Previous configuration
- Parameters
- Manual execution
- Configuration in PandoraFMS
- Modules generated by the plugin
Introduction
Ver. 23-08-2022
Plugin to monitor an azure Event Hubs namespace.
Type: Server plug-in
Compatibility matrix
| Systems where tested |
CentOS 7, Fedora, rocky linux |
| Systems where it should work |
Any linux system |
Prerequisites
- Pandora FMS Data Server enabled
- Have the Pandora FMS Plugin Server enabled.
- Know some credentials of your account, such as your tenant id, secret, client id and namespace resource id.
Previous configuration
The plugin makes use of a file in which two types of data can be entered.
#credentials
tenant_id:<tenant-id>
client_id:<client-id>
secret:<secret>
#id resources
eventhubspacename_id:<event_hub_namespace_resource_id>
Obtaining credentials necessary for the use of the plugin.
1. Credentials to authenticate:
-Tenant id
-Client id
-Secret
2. Resource id
The resource id of each resource monitored by the plugin is required, these are :
- Database resource id
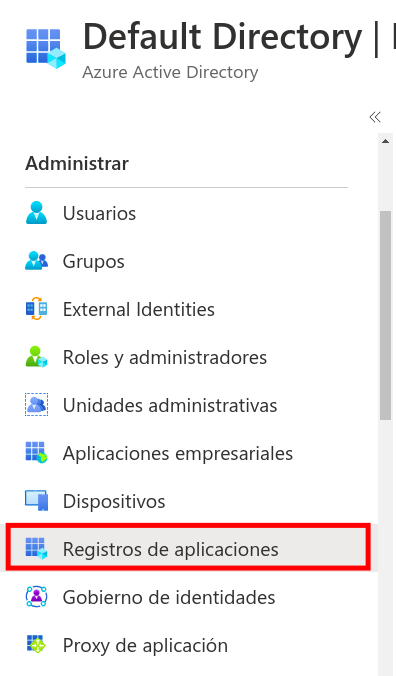
Obtaining tenant id and client id.
1. To obtain the tenant id and the client id, we will go to the application registry menu inside the active directory:
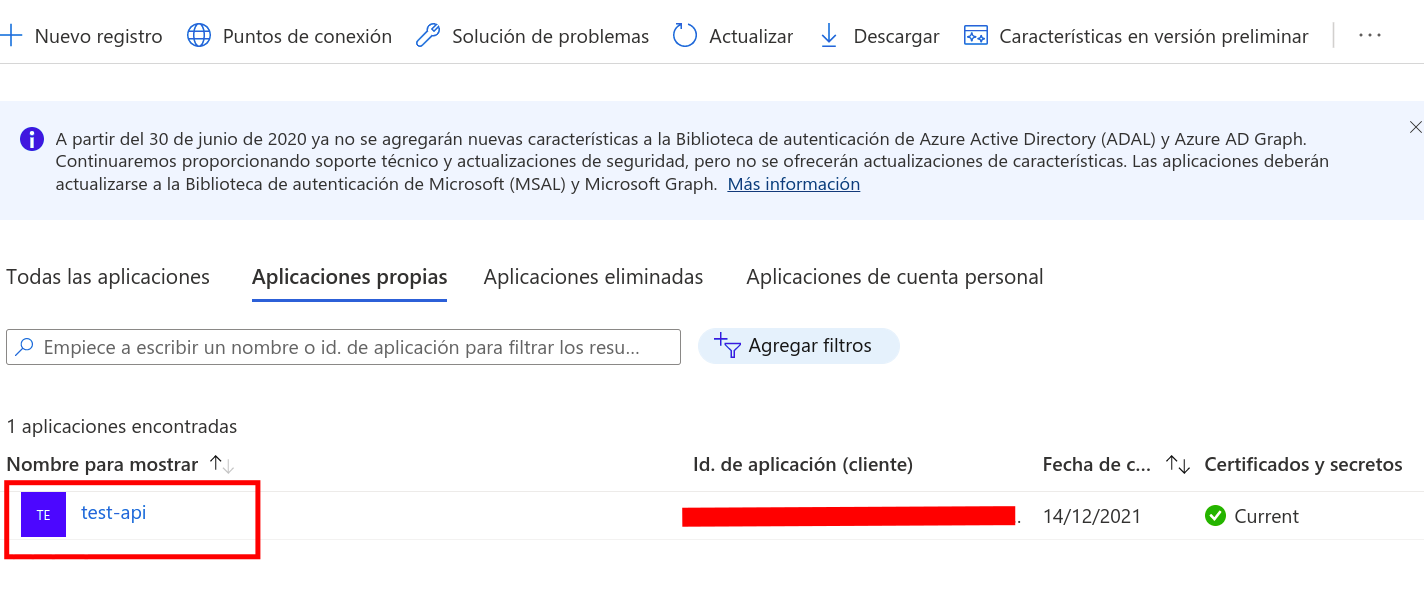
2. We will enter inside the application.
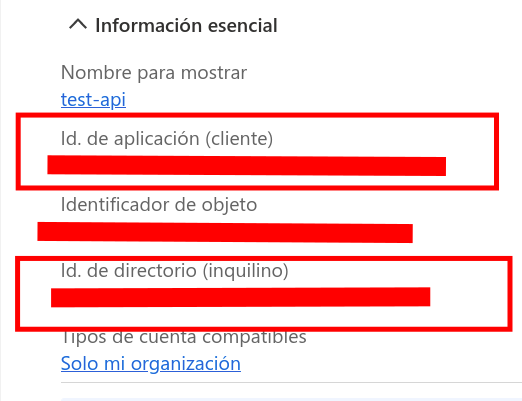
3. The tenant id and client id will appear in the application menu.
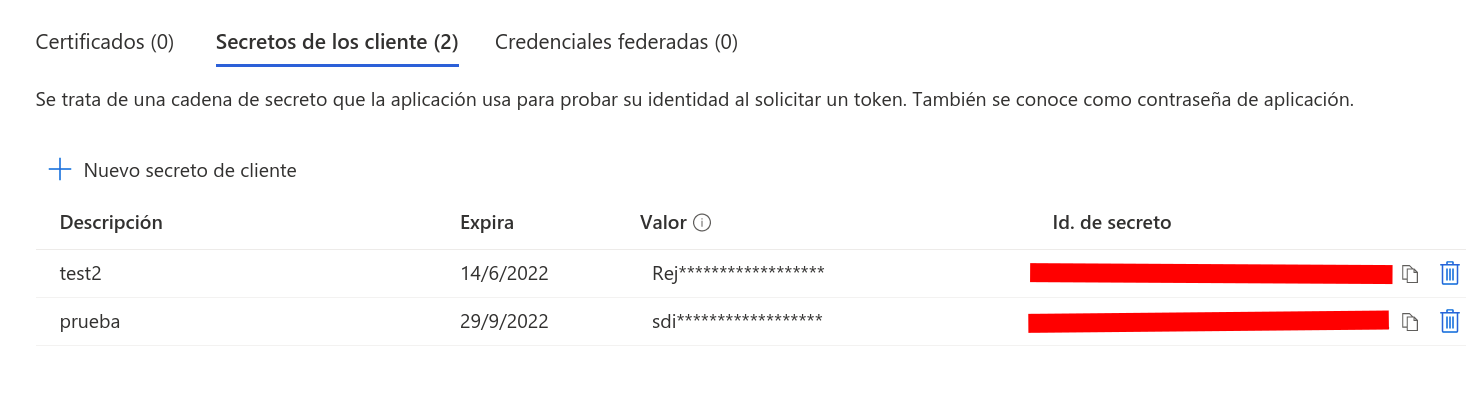
4. To find the secret we will go to certificates and secrets inside the active directory menu.

5. Within this menu we will be able to see the secret keys or generate them (it has to be the key value, not the id).
Obtaining the resource id from the database.
In the namespace, under general information, we can see the resource id of the event hub by clicking on json view.

Parameters
| Parameters | Description |
| --timespan | In hours (optional), last time period, can be used in a custom run to display data from a time period (optional). |
| --metric | Name of the metric for custom execution (optional). |
| --granularity | In minutes combined with timespan will show you the data in intervals (optional). |
| --name_module | To choose the name of the module in a custom run (optional). |
| --tentacle_port | Tentacle port (default 41121) (optional) |
| --tentacle_address | Ip of the tentacle server to send the data to (optional) |
| --agent_name | To name the agent that will contain the modules, by default: "Azure SQL" (optional). |
| --prefix_module | To prefix the modules in case you want to differentiate them from other executions (optional). |
| --conf | Path of the conf file with the queries (required) |
| -g,--group | Pandora FMS target group (optional) |
| --data_dir | Pandora FMS data directory. By default it is /var/spool/pandora/data_in/ (optional) |
| --as_agent_plugin | It is optional, if you want the plugin to be an agent plugin and put the modules in the pandora agent, execute this with a 1 (optional) |
Manual execution
Manual execution
./pandora_azureventhubs --conf <path-conf> --as_agent_plugin 1![]()
Custom manual execution
./pandora_azureventhubs --conf <path-conf> --as_agent_plugin 1 --timespan <period in hours> --granularity <interval in minutes> --metric <name-metric> --name_module <name_module>
Configuration in PandoraFMS
As server plugin
Manual installation
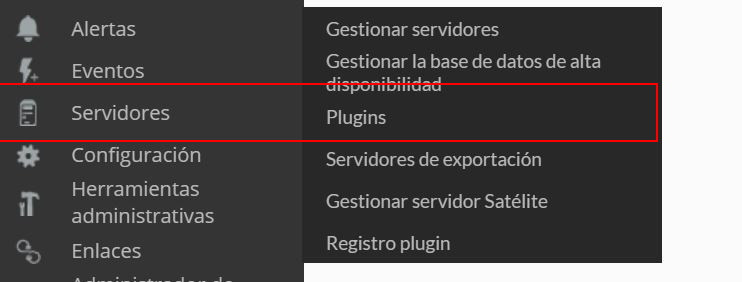
Go to servers > plugins:
Click on add:

We put in name and the description that is preferred.
We put as command the execution with the path of the plugin:
/path_pandora_azureventhubsRemember that the recommended path for the use of the server plugins is: /usr/share/pandora_server/util/plugin/
And in parameters of the plugin we will introduce these followed by the macro "_field<N>_", the obligatory one for it to work is --conf.
Although it is not mandatory, it is highly recommended the use of the --agent_name parameter, since it allows us to customize the name of the agent that will contain the modules created for each customized query. It is also advisable to use the --prefix_module parameter, because this will allow us to assign a prefix to the modules, which can be useful to recognize them faster and differentiate them if we create several executions for different databases.
--CONF

Once this is done, we will click on "create".
Once this is done, the only thing left to do is to call it, so we will go to some agent's view and create an add-in module:
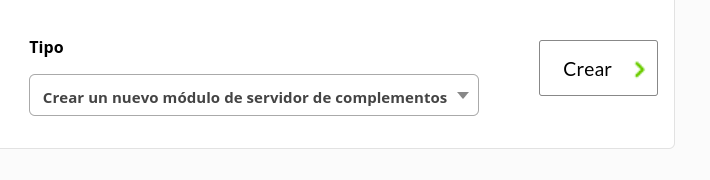
We will give it a name and in the section "plugin" we will put the one we have just configured.
Once this is done, click on create.
If the module is shown with 1, it means that it is running correctly.
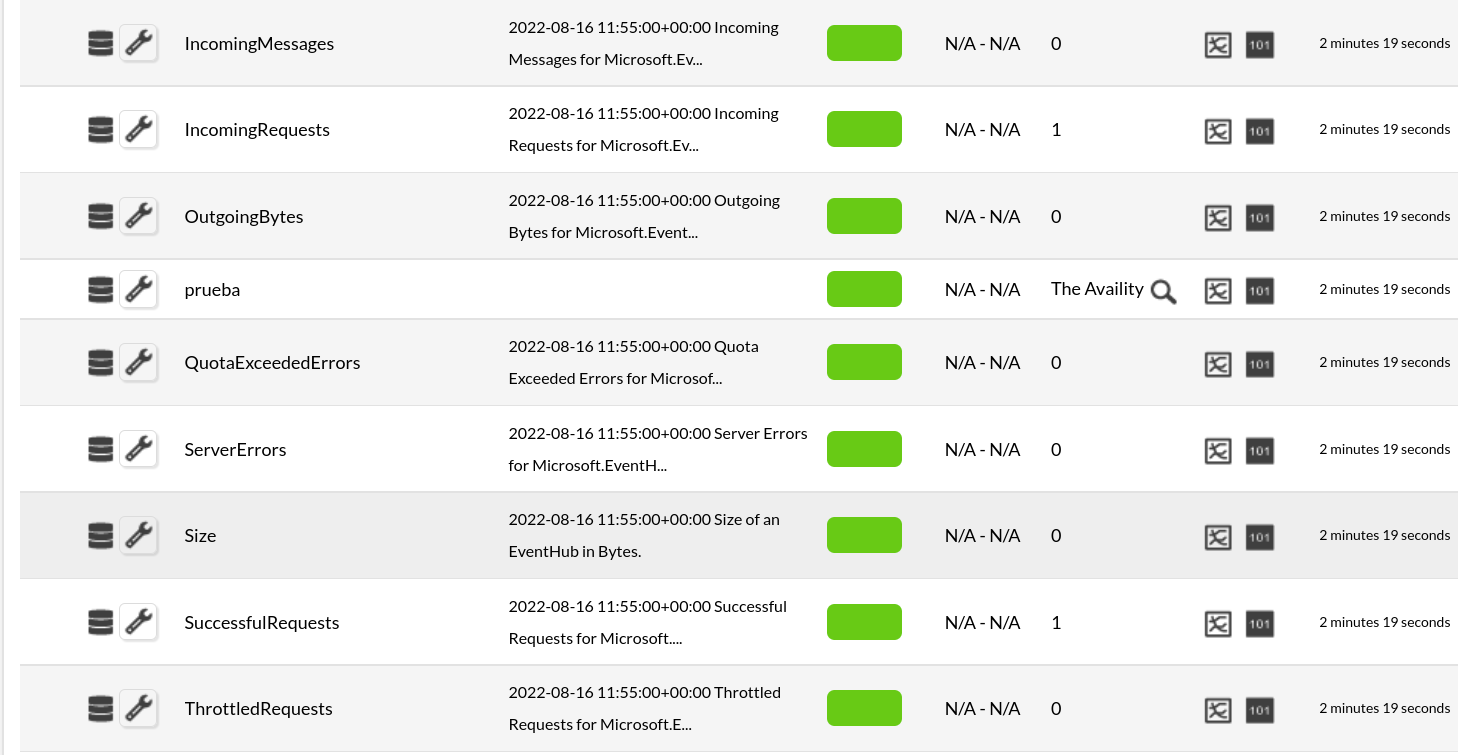
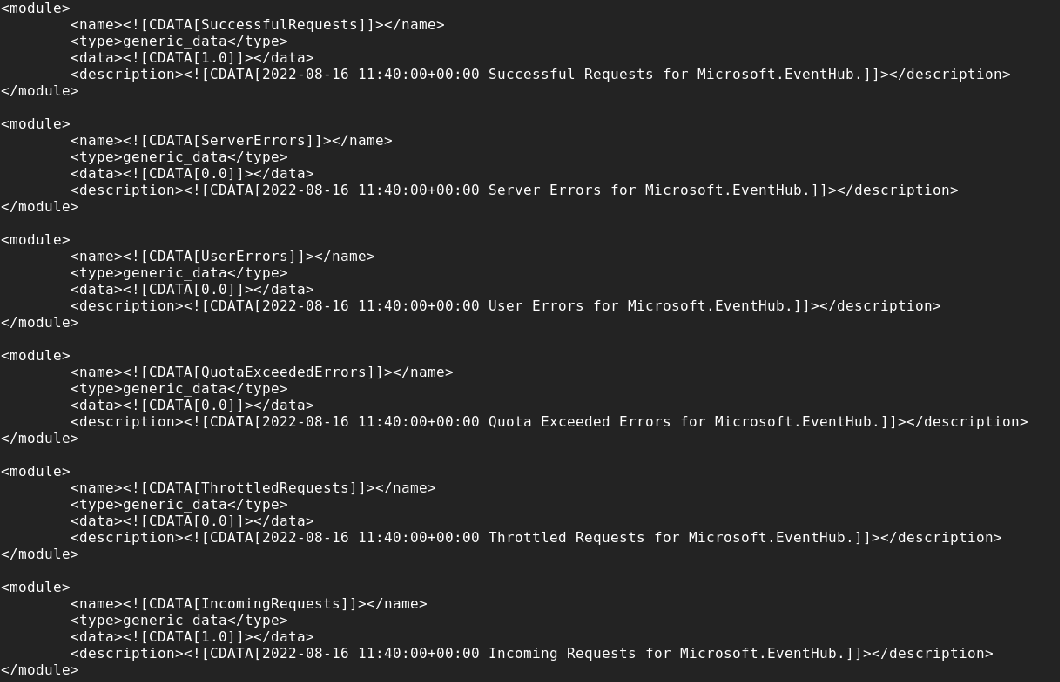
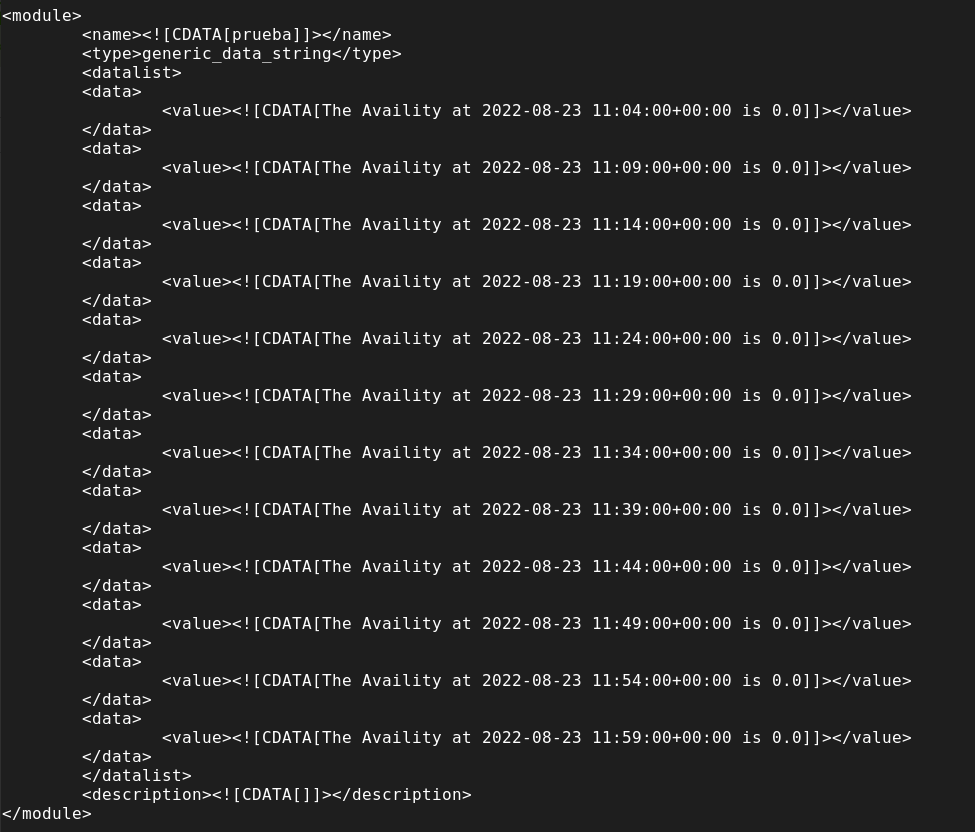
Modules generated by the plugin
The plugin will create an agent with the name we have set with the --agent_name parameter.

And it will create the following modules:
|
SuccessfulRequests
|
|
ServerErrors
|
|
UserErrors
|
|
QuotaExceededErrors
|
|
ThrottledRequests
|
|
IncomingRequests
|
|
IncomingMessages
|
|
IncomingBytes
|
|
OutgoingBytes
|
|
ActiveConnections
|
|
ConnectionsOpened
|
|
ConnectionsClosed
|
|
CaptureBacklog
|
|
CapturedMessages
|
|
CapturedBytes
|
|
Size
|
|
NamespaceCpuUsage
|
|
NamespaceMemoryUsage
|