OVH
This document describes the OVH functionality of PandoraFMS discovery.
- Introduction
- Compatibility matrix
- Pre requisites
- Parameters and configuration
- Manual execution
- Discovery
- Agent and modules generated by the plugin
Introduction
The purpose of this plugin is to monitor OVH, monitoring the status of virtual machines and their statistics such as cpu or memory.
The plugin connects to the OVH API and monitors virtual machines, servers, or costs, generating an agent for each element via XML that sends to the pandora server.
Compatibility matrix
| Systems where tested | Rocky linux, Fedora 34 |
| Systems where it works | Any sistema linux |
Pre requisites
- Connectivity to OVH API
The plugin is a binary containing the packaged dependencies so no installation of any dependencies is required for its use.
To connect, you need application key, application secret and consumer key, the process to obtain them is documented in the ovh page, this information is available in the following link:
https://help.ovhcloud.com/csm/es-es-api-getting-started-ovhcloud-api?id=kb_article_view&sysparm_article=KB0042785
Parameters and configuration
Parámeters
| --conf | Path to configuration file |
Configuration file (--conf)
application_key = < Key application key >
application_secret = < Application secret key >
consumer_key = < consumer key >
interval = < Interval in seconds for the agents and for the metrics analysis >
agent_group_name = < Name of the target group for the created agents >
prefix = < Prefix for the name of the agents >
transfer_mode = < transfer mode, tentacle or local >
data_dir = < (Only enabled if transfer_mode is local) Destination path for the XML of each agent, by default "/var/spool/pandora/data_in/" > >
tentacle_ip = < IP of the destination machine for the created agents >
tentacle_port = < Port of tentacle, default : 41121 >
cost = < Activate with 1 to enable cost monitoring >
scan_vms = < Activate with 1 to enable virtual machines monitoring >
storage = < Activate with 1 to enable volume monitoring > scan_vms = < Activate with 1 to enable virtual machine monitoring > scan_vms = < Activate with 1 to enable virtual machine monitoring >
servers = < Enable with 1 to enable server monitoring >
advance_monitoring = < Enable with 1 to enable advanced monitoring >
Example:
application_key = 6787fa7fa6f68687fafa
application_secret = faf7879afa87f9af9af78fa7f
consumer_key = 8fa8f8af8a8f78af5a3f2af

interval         = 300
agent_group_name = OVH
prefix           = ovh.
transfer_mode    = tentacle
data_dir         = /var/spool/pandora/data_in/
tentacle_ip      = 172.42.42.101
tentacle_port    = 41121

cost                = 0
scan_vms            = 1
storage             = 1
servers             = 1
advance_monitoring  = 0
Enabling advanced monitoring and costs can increase the duration of the plugin execution, if advanced monitoring is not enabled, only the status will be monitored in the virtual machines.
Manual execution
The format of the plugin execution is as follows:
./pandora_ovh --conf < path to configuration file >
For example:
./pandora_ovh --conf /usr/share/pandora_server/util/plugin/ovh-cloud.conf
The execution will return an output in JSON format with information about the execution, and will generate an XML file for each monitored agent that will send to the Pandora FMS server by the transfer method indicated in the configuration.
For example:
{"summary": {"Total agents": 17, "VMs agents": 12, "Storage agents": 1, "Server agents" : 3}}Discovery
This plugin can be integrated with Pandora FMS Discovery.
To do so, you must load the ".disco" package that you can download from the Pandora FMS library:
https://pandorafms.com/library/

Once loaded, you will be able to monitor Kubernetes environments by creating Discovery tasks from the Management > Discovery > Cloud section.
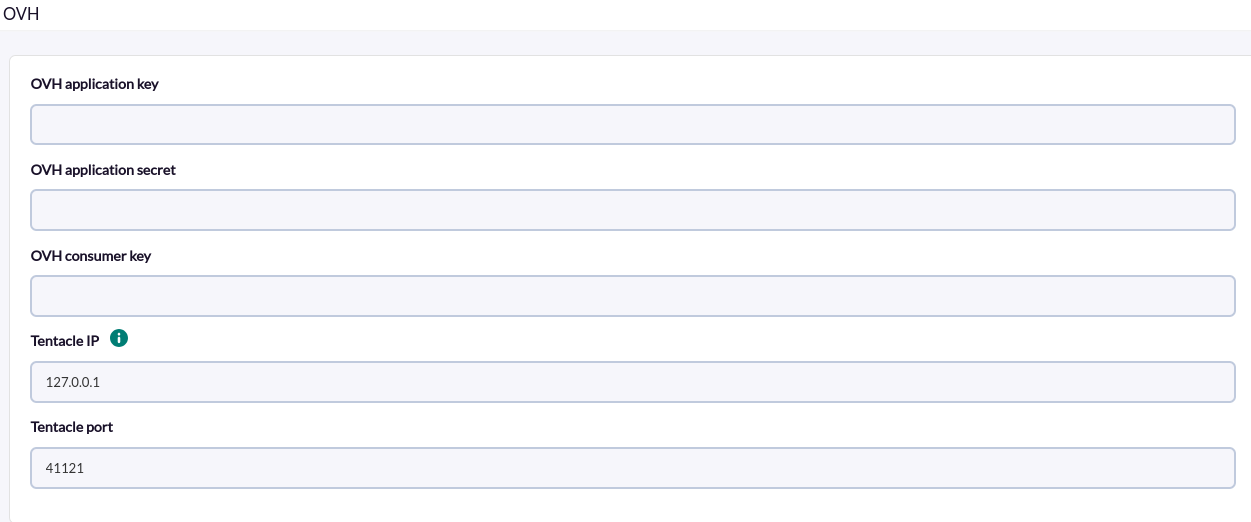
The following minimum data will be requested for each task:
- OVH application key : .Key application key.
- OVH application secret : Application secret key.
- OVH consumer key: Consumer key.
- Tentacle IP: IP of the Tentacle server to send the agents' data to. Normally this parameter will not be modified.
- Tentacle port: Tentacle server port to send the data to. Normally this parameter will not be modified.
It is also possible to adjust the task configuration to customize the desired monitoring:
- Scan Volumes : If enabled, it will monitor the volumes and will create an agent for each one of them.
- Scan Servers:If enabled, it will monitor the servers and create an agent for each one of them.
- Get monthly and overall costs: Get monthly and overall costs: If enabled, it will monitor the costs and will create a module of total costs and another one of monthly costs for the last month.
- Monitor virtual machines: If enabled, it will monitor the virtual machines and will create an agent for each one of them.
- Advanced statistics: If enabled it will enable additional statistics modules in the virtual machines agents.

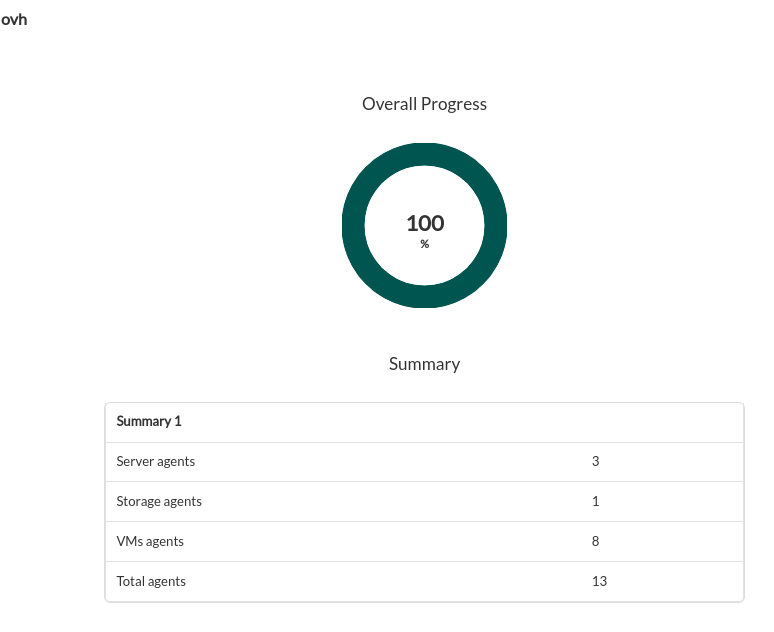
The successfully completed tasks will have an execution summary with the following information:
- Total agents : Total number of agents generated by the task.
- Storage agents : Total number of project agents created by the task.
- VMs agents : Total number of virtual machines agents created by the task.
- Server agents: Total number of server agents created by the task.
Agent and modules generated by the plugin
The execution of the plugin, with all options enabled, will create the following agents and modules:
- Global agent
| < prefix >.OVH |
Modules
| OVH VMs count |
| OVH total costs |
| OVH mont costs |
- One agent per virtual machine
| < prefix >. vm name |
Modules
| < vm name >. status |
| < vm name >. cpu:used |
| < vm name >. cpu:max |
| < vm name >. mem:used |
| < vm name >. mem:max |
| < vm name >. net:rx |
| < vm name >. net:tx |
- One agent for each volume
| < prefix >. volume name |
Modules
| < volume name >.status |
| < volume name >.size |
| < volume name >.type |
| < volume name >.bootable |
| < volume name >.region |
| < volume name >.creationDate |
| < volume name >.attachedTo |
- One agent for each server
| < prefix >. server name |
Modules
| < server name >.status |
| < server name >.powerState |
| < server name >.datacenter |
| < server name >.region |
| < server name >.linkSpeed |
| < server name >.availityZone |
| < server name >.os |
| < server name >.rack |
| < server name >.reverse |
| < server name >.supportLevel |
| < server name >.commercialRange |