Oracle
This document describes the Oracle functionality of PandoraFMS Discovery.
- Introduction
- Prerrequisites
- Parameters and configuration
- Manual execution
- Discovery
- Agents and modules generated by the plugin
Introduction
This plugin is designed to monitor Oracle databases by executing queries that extract key information related to the performance and status of the databases. This information includes metrics such as the number of connections, query counts, restart status, fragmentation ratio, and cache. These data points will be reflected in PandoraFMS through modules that provide statistical value, within an agent representing each database.
It's important to note that this plugin is specifically developed for use with Pandora FMS Discovery. Unlike other plugins, it doesn't generate agents through XML; instead, all the discovered information is returned in the JSON output of the plugin.
Prerrequisites
This plugin establishes remote connections to the databases it monitors, so it's essential to ensure connectivity between the Pandora FMS server and these databases. Proper network and firewall configurations must be in place to allow communication between the server and the remote databases to ensure the plugin's effective operation.
EN — Connection
The plugin connects via oracledb (Python driver) using the format:
HOST:PORT/SID
Or using a full DSN string:
dsn=(DESCRIPTION=(ADDRESS=(PROTOCOL=TCP)(HOST=sales1-srv)(PORT=1521))(CONNECT_DATA=(SID=ORCL)))
The connection user must have at least CREATE SESSION privilege:
GRANT CREATE SESSION TO pandora;
EN — Grants per Module
All modules are opt-in via checkboxes in the Discovery configuration. Only enable the grants needed for the modules you actually use.
1. Connections (checkConnections)
-- v$session (active session count)
GRANT SELECT ON V_$SESSION TO pandora;

-- v$parameter (max sessions)
GRANT SELECT ON V_$PARAMETER TO pandora;
2. Uptime (checkUptime)
-- v$session (PMON process start time)
GRANT SELECT ON V_$SESSION TO pandora;
3. Query Stats (queryStats)
-- v$sqlstats (SQL execution counters)
GRANT SELECT ON V_$SQLSTATS TO pandora;
4. Tablespaces (checkTablespaces)
-- dba_tablespace_usage_metrics (Oracle 10g+)
GRANT SELECT ON DBA_TABLESPACE_USAGE_METRICS TO pandora;

-- dba_tablespaces (status)
GRANT SELECT ON DBA_TABLESPACES TO pandora;

-- dba_data_files (size calculation, Oracle < 10g fallback)
GRANT SELECT ON DBA_DATA_FILES TO pandora;

-- dba_free_space (size calculation, Oracle < 10g fallback)
GRANT SELECT ON DBA_FREE_SPACE TO pandora;
5. Fragmentation Ratio (checkFragmentation)
-- dba_tables (table stats for fragmentation)
GRANT SELECT ON DBA_TABLES TO pandora;
6. Cache Stats (checkCache)
-- v$librarycache
GRANT SELECT ON V_$LIBRARYCACHE TO pandora;

-- v$rowcache
GRANT SELECT ON V_$ROWCACHE TO pandora;

-- v$sysstat
GRANT SELECT ON V_$SYSSTAT TO pandora;
7. Multitenant / PDB Monitoring (multitenant)
-- v$pdbs (PDB discovery)
GRANT SELECT ON V_$PDBS TO pandora;
Additionally, the monitoring user must have CREATE SESSION on each PDB to be monitored. Connect to each PDB and run:
ALTER SESSION SET CONTAINER = <PDB_NAME>;
GRANT CREATE SESSION TO pandora;
-- Granular PDB-level grants (e.g. v$session, dba_tablespaces, etc.)
-- must also be granted inside each PDB.
Note: When multitenant is enabled, the plugin connects directly to each PDB using
HOST:PORT/PDB_NAME, so the user must exist and have the necessary grants in every PDB.
8. Custom Queries (executeCustomQueries)
Permissions depend entirely on the user-defined queries. Grant SELECT on any additional tables/views the custom queries reference.
EN — Quick Setup (All Modules)
For convenience, grant SELECT_CATALOG_ROLE which covers most V$ and DBA_ views:
-- In CDB (container database)
CREATE USER pandora IDENTIFIED BY <password>;
GRANT CREATE SESSION TO pandora;
GRANT SELECT_CATALOG_ROLE TO pandora;

-- In each PDB (if using multitenant)
ALTER SESSION SET CONTAINER = <PDB_NAME>;
-- If user already exists via CDB common user:
GRANT CREATE SESSION TO pandora;
GRANT SELECT_CATALOG_ROLE TO pandora;
Minimal Granular Alternative
If SELECT_CATALOG_ROLE is too broad, use this block:
CREATE USER pandora IDENTIFIED BY <password>;
GRANT CREATE SESSION TO pandora;

-- Dynamic performance views
GRANT SELECT ON V_$SESSION TO pandora;
GRANT SELECT ON V_$SQLSTATS TO pandora;
GRANT SELECT ON V_$PARAMETER TO pandora;
GRANT SELECT ON V_$LIBRARYCACHE TO pandora;
GRANT SELECT ON V_$ROWCACHE TO pandora;
GRANT SELECT ON V_$SYSSTAT TO pandora;
GRANT SELECT ON V_$PDBS TO pandora;

-- DBA views
GRANT SELECT ON DBA_TABLESPACES TO pandora;
GRANT SELECT ON DBA_TABLESPACE_USAGE_METRICS TO pandora;
GRANT SELECT ON DBA_DATA_FILES TO pandora;
GRANT SELECT ON DBA_FREE_SPACE TO pandora;
GRANT SELECT ON DBA_TABLES TO pandora;

-- Version info
GRANT SELECT ON PRODUCT_COMPONENT_VERSION TO pandora;
EN — Summary Table
| Module Token | Oracle View/Table |
|---|---|
checkConnections |
V$SESSION, V$PARAMETER |
checkUptime |
V$SESSION |
queryStats |
V$SQLSTATS |
checkTablespaces |
DBA_TABLESPACE_USAGE_METRICS, DBA_TABLESPACES, DBA_DATA_FILES, DBA_FREE_SPACE |
checkFragmentation |
DBA_TABLES |
checkCache |
V$LIBRARYCACHE, V$ROWCACHE, V$SYSSTAT |
multitenant |
V$PDBS + CREATE SESSION on each PDB |
executeCustomQueries |
Depends on user queries |
* Only needed for Oracle <= 10g fallback query. Oracle 11g+ uses DBA_TABLESPACE_USAGE_METRICS.
Parameters and configuration
Parameters
| --conf | Path to the configuration file. |
| --target_databases | Path to the configuration file containing the database targets. |
| --target_agents | Path to the configuration file containing the agent targets. |
| --custom_queries | Path to the configuration file containing custom queries. |
Configuration file (--conf)
[CONF]
agents_group_id: < The ID of the group where agents will be created. >
interval: < The agent monitoring interval in seconds. >
user: < The connection username. >
password: < The password for the user. >
threads: < The number of threads to be used for agent creation. >
modules_prefix: < The prefix for module names. >
execute_custom_queries: < Activate with 1 to enable the use of custom queries. >
analyze_connections: < Activate with 1 to enable connection monitoring. >
engine_uptime: < Activate with 1 to enable runtime monitoring. >
query_stats: < Activate with 1 to enable query statistics monitoring. >
check_tablespaces: < Activate with 1 to enable tablespace statistics monitoring. >
fragmentation_ratio: < Activate with 1 to enable fragmentation ratio statistics monitoring. >
cache_stats: < Activate with 1 to enable cache statistics monitoring. >
thick_mode = < Activate with 1 to enable thick mode connection >
multitenant = < Enable with 1 to enable multi-tenant monitoring. Only applicable to Oracle multi-tenant architectures (CDB/PDB); in non-CDB environments, it will simply issue a harmless warning >
agent_per_pdb = <Enable with 1 to enable agent creation for each PDB. Applicable only to Oracle multitenant (CDB/PDB) architectures. If this box is checked, an agent will be created for each PDB in the instance; otherwise, the modules for each PDB will be included in the instance's primary agent. >
client_path = < Client path. Only necessary in case of using the thick mode >
entities_list = < Path where the entity file will be generated>
enable_entities_interval = < Path to activate the entity file (multitenant mode only)>
entities_interval = < entity file rescan interval>

[THRESHOLDS]
< Regex pattern matching module names > = < Desired thresholds in the module, separated by “|” >
Example
[CONF]
agents_group_id = 10
interval = 300
user = sa
password = HHgD85V@
threads = 1
modules_prefix =
execute_custom_queries = 1
analyze_connections = 1
engine_uptime = 1
query_stats = 1
check_tablespaces = 1
fragmentation_ratio = 1
cache_stats = 1
thick_mode = 1
multitenant = 0
agent_per_pdb = 0
client_path = /usr/lib/oracle/21/client64/lib/
entities_list = /tmp/entities_oracle.txt
enable_entities_interval = 1
entities_interval = 48000

[THRESHOLDS]
^tablespace = min_warning 10|max_warning 20|min_critical 0|max_critical 10
fragmentation = min_warning 10
The standard installation of instant client 19.8 is done in the /usr/lib/oracle/19.8/client64/lib path.
List of target databases (--target_databases):
The content of the file should be a list of target databases, with each database separated by commas or lines. The format for a database can be any of the following:
ip/sid
ip:puerto/sid
ip:puerto/service_name
If the port is not specified, the default TCP port 1521 will be used for connecting to the target.
Example:
172.17.0.3:1521/FREEPDB1
Each line in the file should represent a separate target database using one of these formats. This file is used to specify the databases that the plugin should monitor.
You can also specify a DNS string directly.
Standalone server example:
dsn=(DESCRIPTION=(ADDRESS=(PROTOCOL=TCP)(HOST=sales1-srv)(PORT=1521))(CONNECT_DATA=(SID=ORCL)))
Failover example with two servers
dsn=(DESCRIPTION=(FAILOVER=ON)(ADDRESS_LIST=(ADDRESS=(PROTOCOL=TCP)(HOST=sales1-srv)(PORT=1521) (CONNECT_TIMEOUT=5)(RETRY_COUNT=2))(ADDRESS=(PROTOCOL=TCP)(HOST=sales2-srv)(PORT=1521)(CONNECT_TIMEOUT=5)(RETRY_COUNT=2)))(CONNECT_DATA=(SID=ORCL)))
List of target agents (--target_agents):
The content of the file should be a list of agent names, with each agent separated by commas or lines. These agent names will be used to associate the information from each target database with the corresponding specified agent name, instead of letting the plugin generate agent names automatically.
The position of each agent name in the list should match the position of the target database in its own list. In other words, the name for the first target database should be the first name in this list, considering that blank lines are ignored.
Example:
agente1,,agente3
agente4
agente5,agente6,agente7,,agente9
Custom Queries (--custom_queries)
One module must be defined for each custom query to be monitored. Modules must follow this structure:
check_begin      --> Module opening tag
name             --> Module name
description      --> Module description.
operation        --> Operation type: value (returns a single value) | full (returns all rows as string).
datatype         --> Module type: generic_data | generic_data_string | generic_proc.
min_warning      --> Minimum warning threshold
max_warning      --> Maximum warning threshold
str_warning      --> Warning string threshold
warning_inverse  --> Set to 1 to invert the warning threshold interval
min_critical     --> Minimum critical threshold
max_critical     --> Maximum critical threshold
str_critical     --> Critical string threshold
critical_inverse --> Set to 1 to invert the critical threshold interval
module_interval  --> This interval is calculated as a multiplier of the agent interval.
crontab          --> 5-field cron expression (minute, hour, day of month, month, day of week).
                    The query only runs when the current date/time matches the expression.
                    If not specified, the query runs on every interval.
                    Format: crontab <minute> <hour> <day_of_month> <month> <day_of_week>
                    Examples:
                      * * * * *      → every minute (always)
                      0 9 * * 1-5    → Monday to Friday at 09:00
                      */15 * * * *   → every 15 minutes
                      * 12-15 * * 1  → Mondays between 12:00 and 15:59
target           --> Custom query (only SELECT statements are allowed).
target_scope     --> Execution scope: cdb, pdb or all (default: cdb).
                    - cdb: only on the CDB instance
                    - pdb: only on each discovered PDB (requires multitenant enabled)
                    - all: on both (CDB and PDBs)
target_databases --> Database agents where the module will be created.
                    To apply to all elements, specify "all" or leave it unspecified.
check_end        --> Module closing tag
Basic module (no crontab, runs on every interval)
check_begin
name Select 1
description Number of invalid objects
operation value
datatype generic_data
min_warning 5
target SELECT 1 FROM dual
target_databases all
check_end
Module against a specific database
check_begin
name ConnectionCount
description Number of connections
operation value
datatype generic_data
min_warning 5
target SELECT COUNT(*) AS ConnectionCount FROM v$session;
target_databases pandora
check_end
Full operation module
check_begin
name RecordCount.files_table
description Invalid objects (detail)
operation full
datatype generic_data
target SELECT COUNT(*) AS RecordCount FROM files;
target_databases pandora
check_end
Module with crontab (runs only Monday to Friday at 09:00)
check_begin
name daily_report
description Daily report query
operation value
datatype generic_data_string
target SELECT COUNT(*) AS records FROM daily_log WHERE date = TRUNC(SYSDATE);
target_databases all
crontab 0 9 * * 1-5
check_end
Module with crontab (only during office hours 8:00–18:00)
check_begin
name active_office_users
description Active users during office hours
operation value
datatype generic_data
target SELECT COUNT(*) FROM users WHERE active = 'Y';
target_databases all
crontab * 8-17 * * 1-5
check_end
Module with crontab every 30 minutes and PDB scope
check_begin
name pdb_sessions
description Active sessions per PDB
operation value
datatype generic_data
target SELECT COUNT(*) FROM v$session WHERE status = 'ACTIVE';
target_databases all
target_scope pdb
crontab */30 * * * *
check_end
Crontab filter behavior
- At the beginning of each plugin execution, all custom queries are evaluated.
- Queries without the
crontabfield always run (classic behavior, backward compatible). - Queries with
crontabare only included if the current date/time matches the cron expression. - Queries rejected by crontab do not generate database connections or SQL queries.
- The filter runs once before spawning monitoring threads.
Cron expression format
The expression follows the standard 5-field format separated by spaces:
| Field | Allowed values |
|---|---|
| Minute | 0-59 |
| Hour | 0-23 |
| Day of month | 1-31 |
| Month | 1-12 |
| Day of week | 0-7 (0 and 7 = Sunday, 1 = Monday) |
Each field supports the following formats:
-
*— any value -
N— exact value (e.g.5) -
N-M— range (e.g.9-17) -
*/N— every N units (e.g.*/15= every 15 minutes) -
N-M/N— range with step (e.g.0-30/10= 0, 10, 20, 30) -
A,B,C— comma-separated list of values
Manual execution
The plugin execution format is as follows:
./pandora_oracle \
--conf <path to the configuration file> \
--target_databases <path to the configuration file containing target databases> \
[ --target_agents <path to the agent configuration file> ] \
[ --custom_queries <path to the custom queries configuration file> ]
For example :
./pandora_oracle \
--conf /usr/share/pandora_server/util/plugin/oracle.conf \
--target_databases /usr/share/pandora_server/util/plugin/targets.conf \
--target_agents /usr/share/pandora_server/util/plugin/target_agents.conf \
--custom_queries /usr/share/pandora_server/util/plugin/custom_queries.conf
Discovery
This plugin can be integrated with Pandora FMS Discovery.
To do this, you must load the ".disco" package that you can download from the Pandora FMS library:
https://pandorafms.com/library/oracle-discovery/
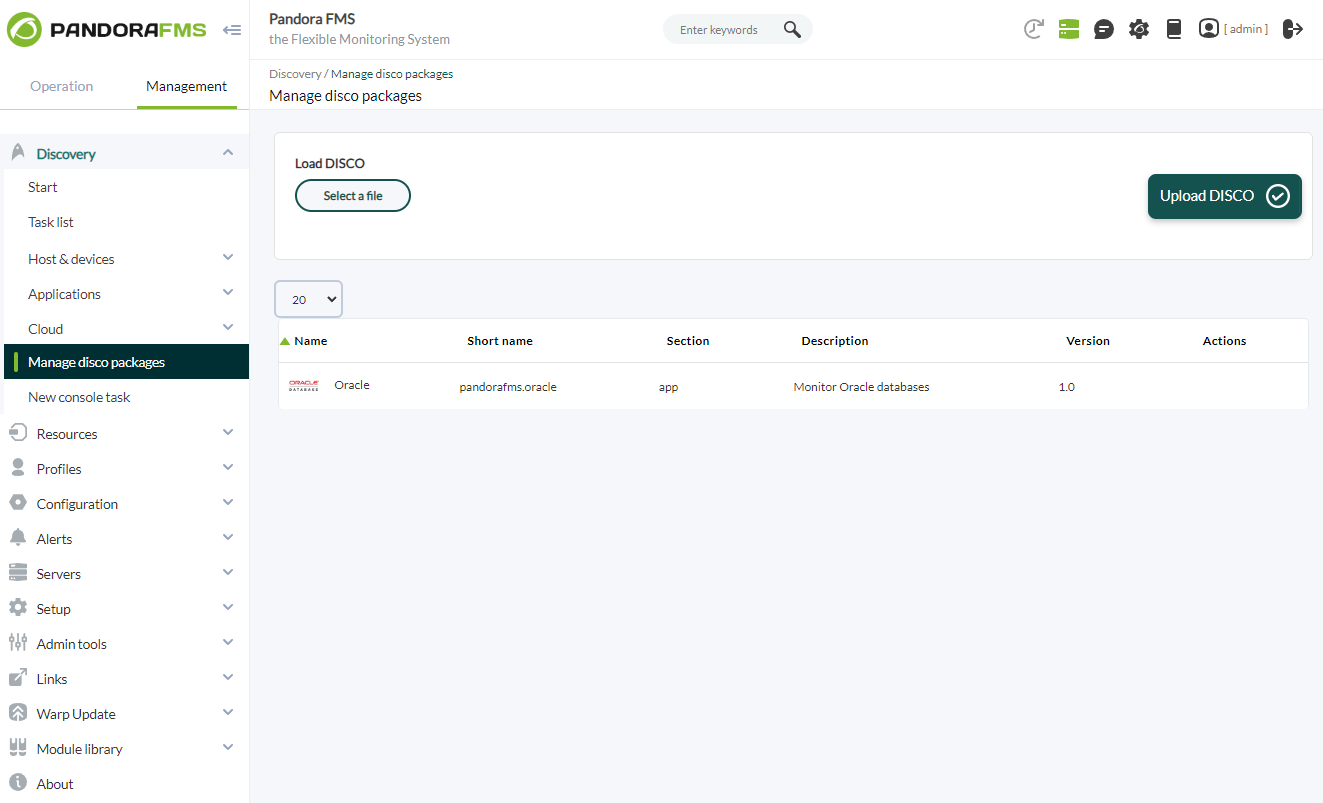
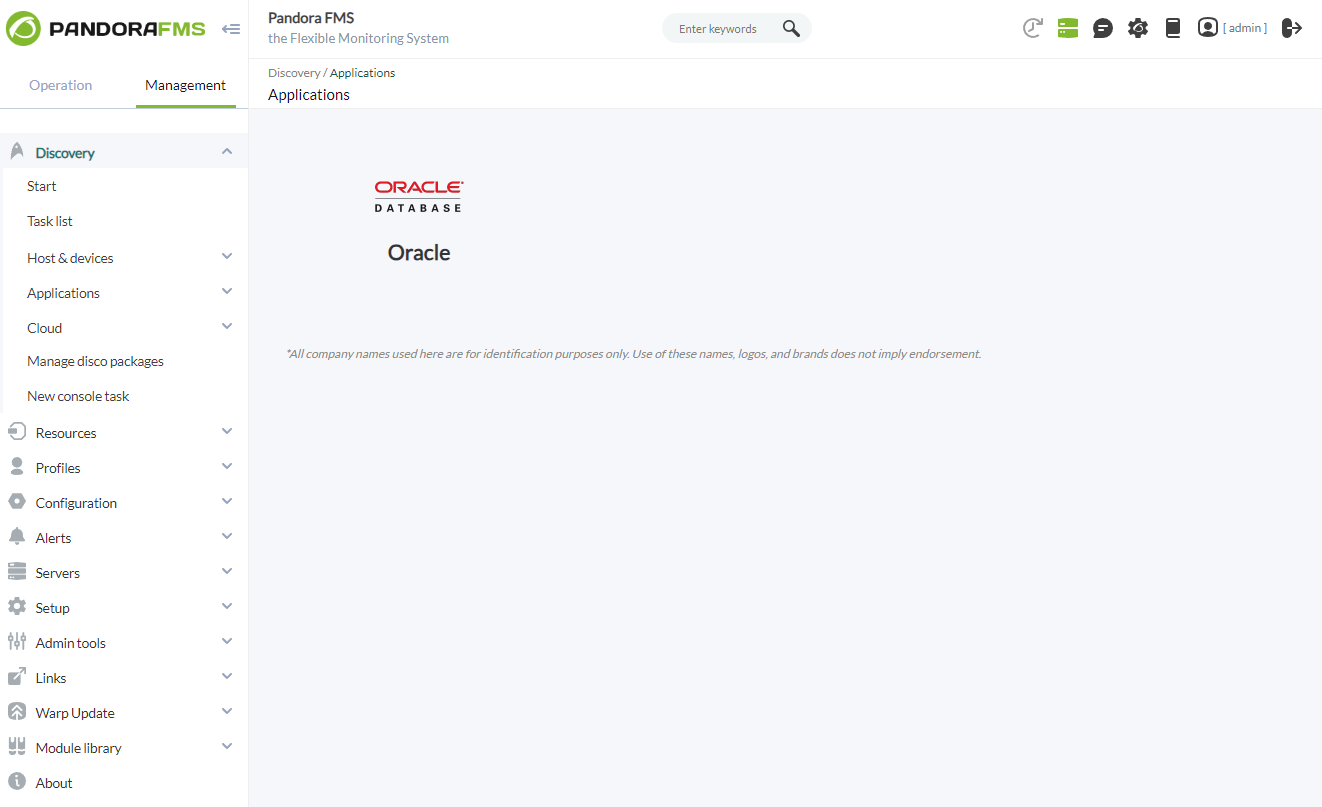
Once loaded, Oracle environments can be monitored by creating Discovery tasks from the Management > Discovery > Applications.
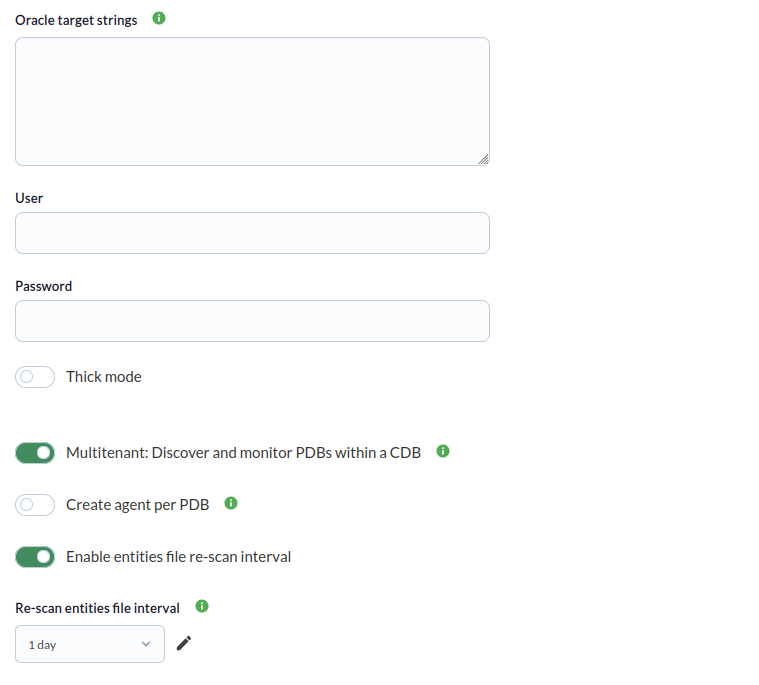
For each task, the following minimum data will be requested:
- Oracle target string: List of Oracle targets to be monitored by the task. It will be a list separated by commas or by lines. Each target database can be defined with the format IP:PORT/SID or IP/SID.
You can also specify a DNS string directly.
Standalone server example:dsn=(DESCRIPTION=(ADDRESS=(PROTOCOL=TCP)(HOST=sales1-srv)(PORT=1521))(CONNECT_DATA=(SID=ORCL)))Failover example with two servers:
dsn=(DESCRIPTION=(FAILOVER=ON)(ADDRESS_LIST=(ADDRESS=(PROTOCOL=TCP)(HOST=sales1-srv)(PORT=1521) (CONNECT_TIMEOUT=5)(RETRY_COUNT=2))(ADDRESS=(PROTOCOL=TCP)(HOST=sales2-srv)(PORT=1521)(CONNECT_TIMEOUT=5)(RETRY_COUNT=2)))(CONNECT_DATA=(SID=ORCL))) - User: Connection user to the target databases.
- Password: Password of the indicated user.
- Thick mode: To enable the "thick mode". This type of connection is only necessary in oracle databases with version 11 or earlier.
- Client path: Path of the oracle client. It is only necessary in case of enabling the "thick mode". The standard installation of instant client 19.8 is done in the /usr/lib/oracle/19.8/client64/lib path.
- Multitenant: Discover and monitor PDBs within a CDB: Only applicable to Oracle multitenant (CDB/PDB) architectures; in non-CDB environments it will simply emit a harmless warning.
- Create agent per PDB: Only applicable to Oracle multitenant (CDB/PDB) architectures.If checked, it will create one agent per PDB in the instance; otherwise, the modules from each PDB will be included in the instance's main agent.
- Enable entities file re-scan interval: Enable the entity file re-scan interval for multitenant monitoring.
- Re-scan entities file interval: Enable the entity file re-scan interval.
Task settings can also be adjusted to customize the desired monitoring:
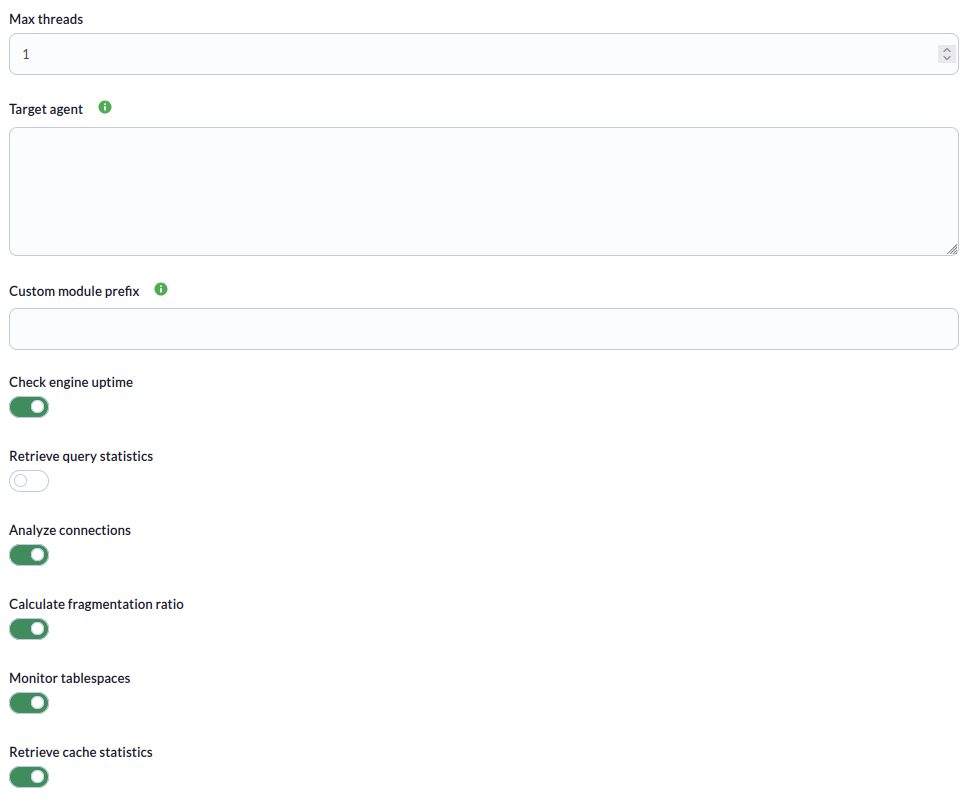
- Max threads: To optimize the execution time, multiple threads can be configured to monitor the agents of the task. Keep in mind that setting up multiple threads can increase the CPU usage of the task.
- Target agent: List of target agents for the Oracle targets to monitor. That is, the names with which the agents of each objective defined in the task will be generated. It will be a list separated by commas or by lines. The position of the names in the list should match the position of the Oracle targets in your list, ie the first name will be used for the first target and so on. If the list is separated by lines, blank lines will be ignored. If an agent name is not specified for a target, its IP or FQDN will be used as the agent name.
- Custom module prefix: Text included as a prefix for all generated module names. It is useful to locate the modules generated by the task or distinguish them from others.
- Check engine uptime: If activated, it will monitor the uptime of the objectives.
- Retrieve query statistics: If enabled, it will monitor query statistics.
- Analyze connections: If activated, it will monitor the connections.
- Calculate fragmentation ratio: If activated it will monitor the fragmentation ratio.
- Monitor tablespaces: If activated it will monitor the tablespaces.
- Retrieve cache statistics: If enabled, it will monitor cache statistics.
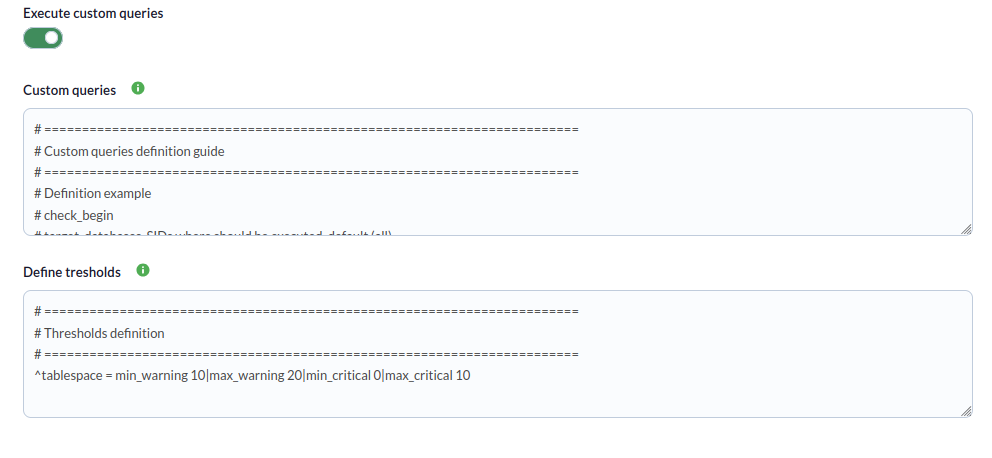
- Execute custom queries: If activated, it will allow you to execute custom queries for each Oracle target.
- Custom queries: Configuration block to define the custom queries to be executed. Each query will generate a new module for each agent in the task.
- Define tresholds: Here you can define thresholds for generated modules (except those generated by custom queries). The format is one threshold definition per line and is as follows:
< Regex pattern matching module names > = < Desired thresholds in the module, separated by “|” >Example:
^tablespace = min_warning 10|max_warning 20|min_critical 0|max_critical 10
Tasks that are successfully completed will have an execution summary with the following information:
- Total Agents: Total agents generated by the task.
- Targets up: Total number of targets that could be connected to.
- Targets down: Total number of targets that could not be connected.

The tasks that are not completed successfully will have an execution summary recording the errors produced.
Agents and modules generated by the plugin
The plugin will create an agent for each target database. That agent will contain the following modules
If engine_uptime is activated:
| restart\_detection | It will be 0 if an unexpected restart has been detected, and 1 if this is not the case. When a server restarts unexpectedly, there may be an interruption in access to the database and potentially lost transactions or data not saved correctly. |
Si esta activado query_stats:
| queries: select | **Number of SELECT queries**. SELECT queries are used to retrieve data from the database. Monitoring SELECT queries allows you to assess query efficiency and index optimization. By identifying slow or inefficient SELECT queries, you can take steps to improve their performance, such as adding appropriate indexes, optimizing the queries, or adjusting server configuration. |
| queriers: update | **Number of UPDATE queries**. UPDATE queries are used to modify existing data in the database. Monitoring UPDATE queries is important to assess the frequency and efficiency of data updates. You can identify UPDATE queries that affect a large number of rows or have a significant impact on server performance. This allows you to optimize queries, review table structure, or take steps to reduce the load generated by updates. |
| queries: delete | **Number of DELETE queries**. DELETE queries are used to delete data from the database. Monitoring DELETE queries is useful for evaluating the frequency and efficiency of data deletions. You can identify DELETE queries that affect a large number of rows or that have a significant impact on server performance. This allows you to optimize queries, review table structure, or take steps to reduce the load generated by deletes. |
| queries: insert | **Number of INSERT queries**. INSERT queries are used to insert new data into the database. Monitoring INSERT queries allows you to assess the frequency and efficiency of data inserts. You can identify INSERT queries that are placing a high load on the server or could be causing performance issues. This allows you to optimize queries, review table structure, or consider lazy insert strategies to improve performance in high-concurrency environments. |
If analyze_connections is activated:
| session usage | **Number of current connections** with respect to the total of maximum connections. Monitoring session usage in SQL Server is important to optimize performance, identify blocking issues, improve security and auditing, and efficiently plan server resources. |
If cache_stats is enabled:
| cache hit ratio (dictionary) | **The cache ratio of the dictionary.** "Cache Hit Ratio (Dictionary)" refers to the ratio of Oracle dictionary data access requests that are resolved using cached data compared to requests that require disk access. The Oracle dictionary contains information about the database structure, objects, metadata, and other important details. A high hit ratio indicates that most dictionary access requests are resolved using data in the cache, which improves system performance by avoiding disk access. |
| cache hit ratio (library) | **The cache ratio of the library.** "Cache Hit Ratio (Library)" refers to the ratio of access requests to Oracle procedures, functions, and packages stored in the shared library cache. The shared library cache stores the compiled code of frequently executed programs and SQL queries. A high hit ratio indicates that most requests are resolved using cached code, which avoids the need for recompilation and improves performance by reducing execution time. |
| cache hit ratio (buffer) | **The buffer cache ratio.** "Cache Hit Ratio (Buffer)" refers to the proportion of requests to access blocks of data stored in Oracle's buffer cache that are resolved using data in the cache compared to requests that require access to disk. The buffer cache stores blocks of data that are frequently read or modified. A high hit ratio indicates that most data access requests are resolved using blocks stored in the buffer cache, which reduces the need for disk access and improves overall system performance. |
If check_tablespaces is enabled:
| tablespace <table name> free | **Percentage of usage in GB**. It is important to monitor "tablespace free" in Oracle to keep track of the amount of space available in the tablespaces. This allows you to proactively manage storage space growth and avoid insufficient space issues that could impact database functionality. By monitoring tablespace free, you can take actions such as adding more storage space or making adjustments to configurations to ensure there is enough space available. |
| tablespace <table name> status | **Status of the table, 1 if it is online and 0 if not**. Monitoring tablespace status in Oracle is essential to evaluate the health and status of tablespaces. Provides information about the structural integrity of tablespaces, including the existence of errors or corruption issues. By monitoring tablespace status, you can detect problems early and take action to resolve them, such as restoring from backups or performing recovery tasks. This ensures database continuity and stability, preventing data loss or performance degradation due to tablespace issues. |
If fragmentation_ratio is activated:
| fragmentation ratio | **The fragmentation ratio**. The Fragmentation Ratio in Oracle Database is a value that indicates the amount of space wasted due to fragmentation in a data structure. A high Fragmentation Ratio indicates greater fragmentation and wasted space, which can impact system performance. |
The plugin will also create a module for each custom query defined in the configuration file.
Multitenant Monitoring (CDB/PDB)
If multitenant is enabled (1 — enabled, 0 — disabled; default: 0), the plugin discovers Pluggable Databases (PDBs) within the Container Database (CDB) and collects the same performance metrics for each PDB (uptime, query stats, cache hit ratio, tablespaces, connections, fragmentation). Only applicable to Oracle multitenant (CDB/PDB) architectures; in non-CDB environments it will simply emit a harmless warning.
Behavior depends on the agent_per_pdb token:
agent_per_pdb disabled (default)
All PDB modules are added to the main CDB instance agent. Module names are prefixed with PDB <name>, for example:
| PDB APP1 restart_detection | Restart detection for PDB APP1. |
| PDB APP1 queries: select | SELECT queries on PDB APP1. |
| PDB APP1 cache hit ratio (buffer) | Buffer cache hit ratio for PDB APP1. |
| PDB APP1 tablespace USERS free | Free space of tablespace USERS in PDB APP1. |
agent_per_pdb enabled
The plugin creates an independent agent for each discovered PDB, named <main_agent> - PDB <name> with address host:port/pdb_name. Each PDB agent contains:
- A connection module (
Oracle PDB <name> connection) - All applicable statistics modules (uptime, queries, cache, tablespaces, connections, fragmentation), same as the main CDB agent
- Custom thresholds are also applied to each PDB agent's modules
PDBs not in READ WRITE mode are skipped with a warning.
Note: agent_per_pdb only takes effect when multitenant enabled.