Openshift
This document describes the PandoraFMS discovery Openshift functionality.
- Introduction
- Prerrequisites
- Parameters and configuration
- Manual execution
- Discovery
- Agent and modules generated by the plugin
Introduction
The purpose of this plugin is to monitor Openshift nodes and pods, through key metrics related to CPU, memory, status of these and the containers of a pod, which are essential to keep track of these resources.
The plugin connects to the Openshift REST API and monitors the environment using the aforementioned metrics, generating an agent for each zone and instance via XML that it sends to the pandora server.
Prerrequisites
- Openshift API connectivity
The plugin must be able to reach the API remotely in order to extract the information.
- Obtaining Bearer token
It can be obtained with the following CLI command, after logging in with this one:
./oc whoami -t-
The openshift user account must have cluster-reader permissions.
The cli commands to add permissions are as follows (these must be given from a privileged account)
Add a role to a user :
oc adm policy add-role-to-user <role> <user_name>Remove a role from a user :
oc adm policy remove-role-from-user <role> <user_name>Add a role to a user for all projects:
oc adm policy add-cluster-role-to-user <role> <user_name>Remove a user role for all projects:
oc adm policy remove-cluster-role-from-user <role> <user_name>Example :

- The cluster-monitoring option must be activated.
This can be done with the following command :
./crc config set enable-cluster-monitoring trueExample:

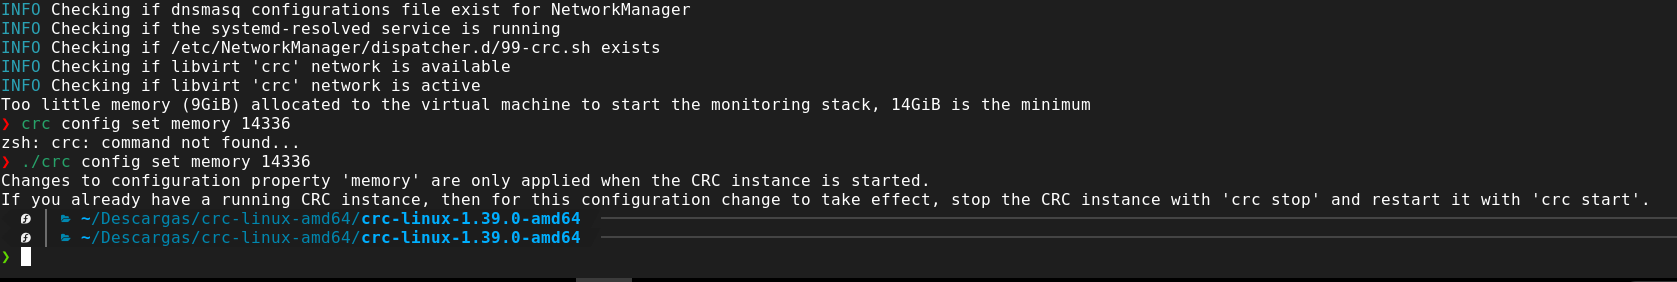
To be able to have enabled a minimum of 14 gb is requested, so if we have configured the environment with less, and we activate the cluster-monitoring option we will have to add more to the machine, the minimum is 14336 in mb.
- This file can be applied directly to configure the necessary permissions.
oc apply -f https://github.com/kubernetes-sigs/metrics-server/releases/download/v0.4.1/components.yaml- You need to run this apiservice: v1beta1.metrics.k8s.io and the metrics server.
oc get apiservice- Tiene que estar activada la opción cluster-monitoring
The command to specify the memory is :
./crc config set memory 14336Example:
Parameters and configuration
Parameters
| --conf | Conf path file |
Conf file (--conf)
ip = < IP or Kubernetes host >
port = < Kubernetes host port >
token = < Authentication token bearer >
connection = < Connection mode, normal or proxy >
proxy = < Connection url >
interval = < Interval in seconds for agents and for metrics analysis >
agent_group_name = < Name of the target group for the created agents >
prefix = < Prefix for the name of the agents >
transfer_mode = < transfer mode, tentacle or local >
data_dir = < (Only enabled if transfer_mode is local) Destination path for each agent's XML, by default "/var/spool/pandora/data_in/" >
tentacle_ip = < IP of the destination machine for the created agents >
tentacle_port = < Port of tentacle, default : 41121 >

deployments = < Activate with 1 to enable the monitoring of deployments >
nodes = < Activate with 1 to enable nodes monitoring >
pods = < Activate with 1 to enable pods monitoring >
Example
ip               = 192.168.49.2
port             = 8443
token            = eyJhbGciOiJSUzI1NiIsImtpZCI6IkVpeVhfTFFzSWpmcGtjZzM0blZrZDY3YUtMbzNqTWZmcmdLZ2NKblVHbTgifQ.eyJpc3MiOiJrdWJlcm5ldGVzL3NlcnZpY2VhY2NvdW50IiwisInN1YiI6InN5c3RlbTpzZXJ2aWNlYWNjb3VudDpkZWZhdWx0OmRlZmF1bHQifQ.aC1lPbS5kYR9Fg9hXJaPiQ8cHzjdWlaAfXdPlmPok6LRX0_OZESEhw8to4PZrz2vzt_BUbawUR0NOpHadujHIx7as4Jm8UCRHgmGseyB7mae9vRMFiD1B4EeH5L8lvucydlV2Avx1IV9SyssbypwGCH_jg7tfKz4EMz5aBfgipliRwFaRGdQMX5sjz4AknGxcb2UVOe9LFb_xC-awDEjaGvm_F0tSLxtyGPoJmsvknNmEC9hJLG_AU8Z9Ke5I5oTvEzRmUCqrKz6319p-x9aaF6yUfOFtlnQlLhIz2xkOs8DkkJ1Rk59i2MolzXGwmlGgWkgc7qCgvqXQNjDeX3ySA
connection       = normal
proxy            = http://localhost:8080
interval         = 300
agent_group_name = kubernetes
prefix           = kube.
transfer_mode    = tentacle
data_dir         = /var/spool/pandora/data_in
tentacle_ip      = 172.42.42.101
tentacle_port    = 41121

deployments      = 1
nodes            = 1
pods             = 1
Manual execution
The format of the plugin execution is as follows:
./pandora_openshift --conf < Conf path file >Example:
./pandora_openshift --conf /usr/share/pandora_server/util/plugin/openshift.confThe execution will return an output in JSON format with information about the execution, and will generate an XML file for each monitored agent that will be sent to the Pandora FMS server by the transfer method indicated in the configuration.
For example:
{"summary": {"Total agents": 84, "Nodes agents": 3, "Pods agents": 43, "Deployments agents": 37}}Discovery
This plugin can be integrated with Pandora FMS Discovery.
To do so, you must load the ".disco" package that you can download from the Pandora FMS library:
https://pandorafms.com/library/
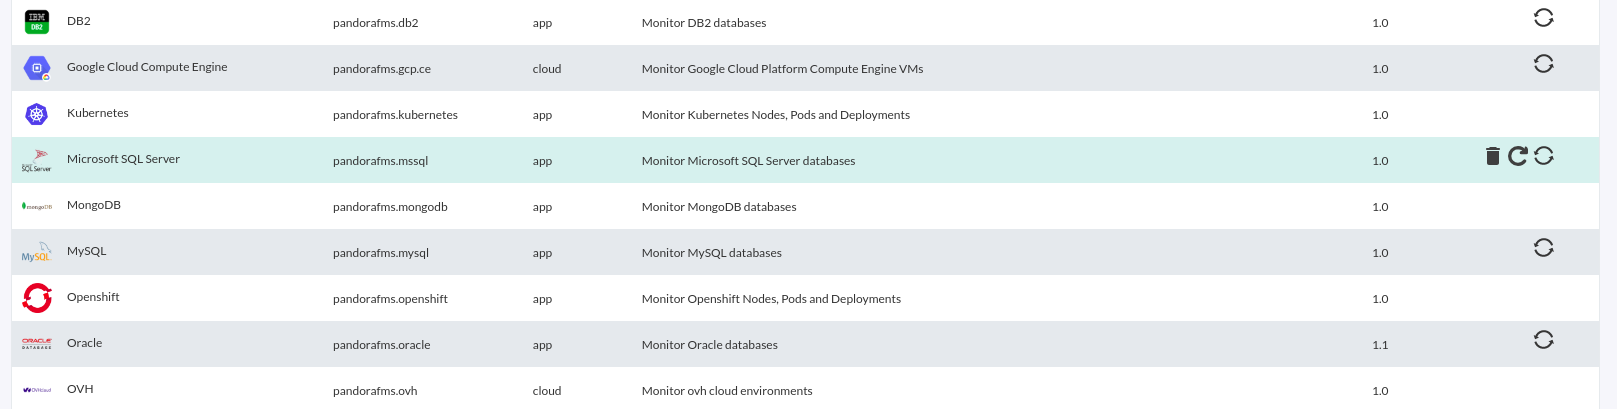
Once loaded, openshift environments can be monitored by creating Discovery tasks from the Management > Discovery > Applications section.
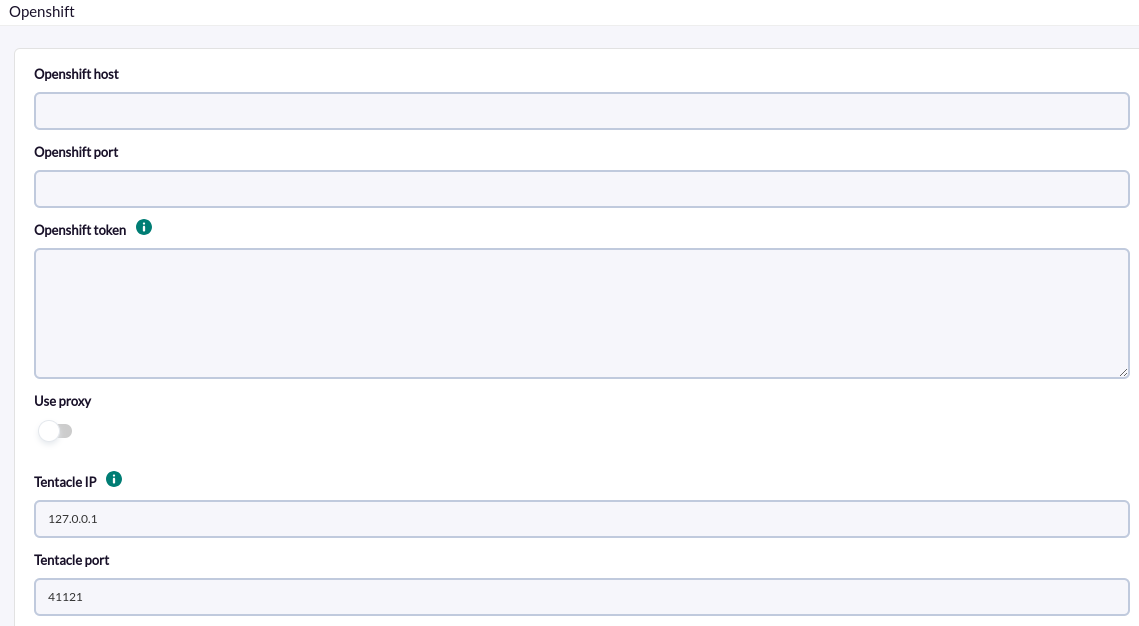
The following minimum data will be requested for each task:
- Openshift host : openshift host.
- Openshift port : Openshift port.
- Openshift token: Openshift token.
- Tentacle IP: IP of the Tentacle server to send the agents' data to. Normally this parameter will not be modified.
- Tentacle port: Tentacle server port to send the data to. Normally this parameter will not be modified.
It is also possible to adjust the task configuration to customize the desired monitoring:
- Scan Deployments : If enabled, it will monitor the deployments and create an agent for each one of them.
- Scan Nodes: If enabled, it will monitor the nodes and will create an agent for each one of them.
- Scan Pods: If enabled, it will monitor the pods and will create an agent for each one of them.

The successfully completed tasks will have an execution summary with the following information:
- Total agents : Total number of agents generated by the task.
- Nodes agents : Total number of node agents.
- Pods agents : Total number of pod agents.
- Deployment agents: Total number of application agents.
Agent and modules generated by the plugin
The execution of the plugin will create the following agents and modules:
- Global agent
| < prefix.Openshift > |
Modules
| Api status |
| APIServices count |
| APIServices Status |
| < Endpoint healthz> |
| Services count |
| List Services |
| Namespaces count |
| List Namespaces |
| < Component status healthz > |
| Replication controllers count |
| Replication controllers status |
| Deployments |
- One agent for each deployment
| < prefix. deployment name > |
Modules
| Replicas |
| Updated replicas |
| Ready replicas |
| Avalaible replicas |
| Unavalaible replicas |
| Available |
| Progressing |
- A agent for each node
| < prefix. Node name > |
Modules
| Pods |
| Pods (%) |
| CPU (cores) |
| CPU (%) |
| Memory (bytes) |
| Memory (%) |
| Condition < condition > status |
- A agent for each pod
| < prefix. Pod name > |
Modules
| Pod status |
| <Condition status> |
| Containers |
| Container <nombre contenedor> CPU (cores) |
| Container <nombre contenedor> CPU (%) |
| Container <nombre contenedor> Memory (bytes) |
| Container <nombre contenedor> Memory (%) |