MySQL
This document describes the MySQL functionality of PandoraFMS discovery.
- Introduction
- Prerrequisites
- Paremeters and configuration
- Manual execution
- Discovery
- Agents and modules generated by the plugin
Introduction
The purpose of this plugin is to monitor MySQL databases, by means of queries that will extract information about data that are key to know the performance and status of the databases, such as the number of connections, number of queries, buffer status, cache status and restart status. This data will be reflected in PandoraFMS, in modules that will provide the statistical value, inside an agent that will represent each database.
This plugin is developed to be used with Pandora FMS Discovery, so unlike other plugins it does not generate agents by XML, but everything discovered is returned in the JSON output of the plugin.
Prerrequisites
This plugin performs remote connections to the databases to be monitored, so it is necessary to ensure connectivity between the Pandora FMS server and these databases.
In turn the following permissions are required for the user that is used to connect.
SELECT on the database tables.
SELECT on INFORMATION_SCHEMA tables.
SHOW STATUS (allows to consult the status of the server).
SHOW VARIABLES (allows access to the server configuration variables).
Paremeters and configuration
Parameters
| --conf | Path to configuration file |
| --target_databases | Path to the list of target databases to be monitored |
| --target_agents | Path to the list of target agents in which to store the target database data. This parameter is optional, and will be used to give custom agent names to the agents generated by the plugin. |
| --custom_queries | Path to the file with the definition of customized queries to the target databases. This parameter is optional and each query performed will correspond to a module. |
Configuration file (--conf)
The contents of the file will be as follows:
agents_group_id = < ID of the group in which the agents will be created >
interval = < Agents monitoring interval in seconds >
user = < Login user >
password = < Password >
threads = < Number of threads to be used for agent creation >
modules_prefix = < Module prefix >
execute_custom_queries = < Activate with 1 to enable the use of custom queries >
scan_databases = < Enable with 1 to monitor all databases on the server >
agent_per_database = < Enable with 1 to create an agent for each database found in the targets to be monitored >
db_agent_prefix = < Prefix to be included in the name of each agent created for each database found in the targets to be monitored >
analyze_connections = < Activate with 1 to enable connection monitoring >
engine_uptime = < Activate with 1 to enable the monitoring of the execution time >
query_stats = < Enable with 1 to enable query statistics monitoring >
innodb_stats = < Enable with 1 to enable innodb statistics monitoring >
cache_stats = < Activate with 1 to enable cache statistics monitoring >
Example:
agents_group_id = 10
interval = 300
user = sa
password = HHgD85V@
threads = 1
modules_prefix =
execute_custom_queries = 1
analyze_connections = 1
engine_uptime = 1
query_stats = 1
innodb_stats = 1
cache_stats = 1
scan_databases = 1
agent_per_database = 1
db_agent_prefix = mysql.
List of target databases (--target_databases)
The content of the file will be a list of target databases, separating each database by commas or by lines. The format for a database can be any of the following:
ip:port
ip
En caso de no indicarse el puerto, se usará el puerto 3306 TCP por defecto para la conexión al objetivo.
Example:
172.17.0.2, 172.17.0.3
172.17.0.4:3306
List of target agents (--target_agents)
The content of the file will be a list of agent name bases, separating each agent by commas or by lines. These agent names will be used to dump the information from each target database into the corresponding indicated agent name, instead of letting the plugin generate the agent names automatically.
The position of each agent name in the listing must match the position of the target database in its own listing, i.e. the name for the first target database will be the first name in this listing, taking into account that blank lines are ignored.
Example:
agente1,,agente3
agente4
agente5,agente6,agente7,,agente9
Custom queries (--custom_queries)
A module must be entered for each custom query to be monitored. The modules must follow a structure, which is as follows:
check_begin      --> Module opening label
name             --> Module name
description      --> Module description.
operation        --> Operation type
datatype         --> Module type
min_warning      --> Minimum warning threshold setting
max_warning      --> Maximum warning threshold configuration
str_warning      --> Warning string configuration
warning_inverse  --> Enable inverse interval with 1 for warning threshold
min_critical     --> Minimum critical threshold setting
max_critical     --> Maximum critical threshold configuration
str_critical     --> Critical string configuration
critical_inverse --> Activate inverse interval with 1 for critical threshold
module_interval  --> This interval is calculated as a multiplier of the agent interval.
target           --> Custom query
target_databases --> Database agents in which the module will be created.
check_end        --> Module's closing tag.
In case monitoring of each database within the target MySQL servers is enabled, custom queries will be launched for each of those databases. In such cases, it is possible to reference the database in use with the variable "$__self_dbname".
Example:
check_begin
name Select 1 $__self_dbname
description Number of invalid objects
operation value
datatype generic_data
min_warning 5
target SELECT 1;
target_databases all
check_end

check_begin
name Agents count in $__self_dbname
description Number of invalid objects
operation value
datatype generic_data
min_warning 5
target SELECT COUNT(*) FROM $__self_dbname.tagente;
target_databases pandora
check_end

check_begin
name Agents in $__self_dbname
description Invalid objects (detail)
operation full
datatype generic_data
target SELECT id_agente, nombre FROM $__self_dbname.tagente limit 10;
target_databases pandora
check_end
Manual execution
The format of the plugin execution is as follows:
./pandora_mysql \
--conf < path to the configuration file > \
--target_databases < path to the configuration file containing the target databases > \
[ --target_agents < path to the agent configuration file > ] \
[ --custom_queries < path to the configuration file containing the custom queries > ]
For example:
./pandora_mysql \
--conf /usr/share/pandora_server/util/plugin/mysql.conf \
--target_databases /usr/share/pandora_server/util/plugin/targets.conf \
--target_agents /usr/share/pandora_server/util/plugin/target_agents.conf \
--custom_queries /usr/share/pandora_server/util/plugin/custom_queries.conf
Discovery
This plugin can be integrated with Pandora FMS Discovery.
To do so, you must load the ".disco" package that you can download from the Pandora FMS library:
https://pandorafms.com/library/mysql-discovery/
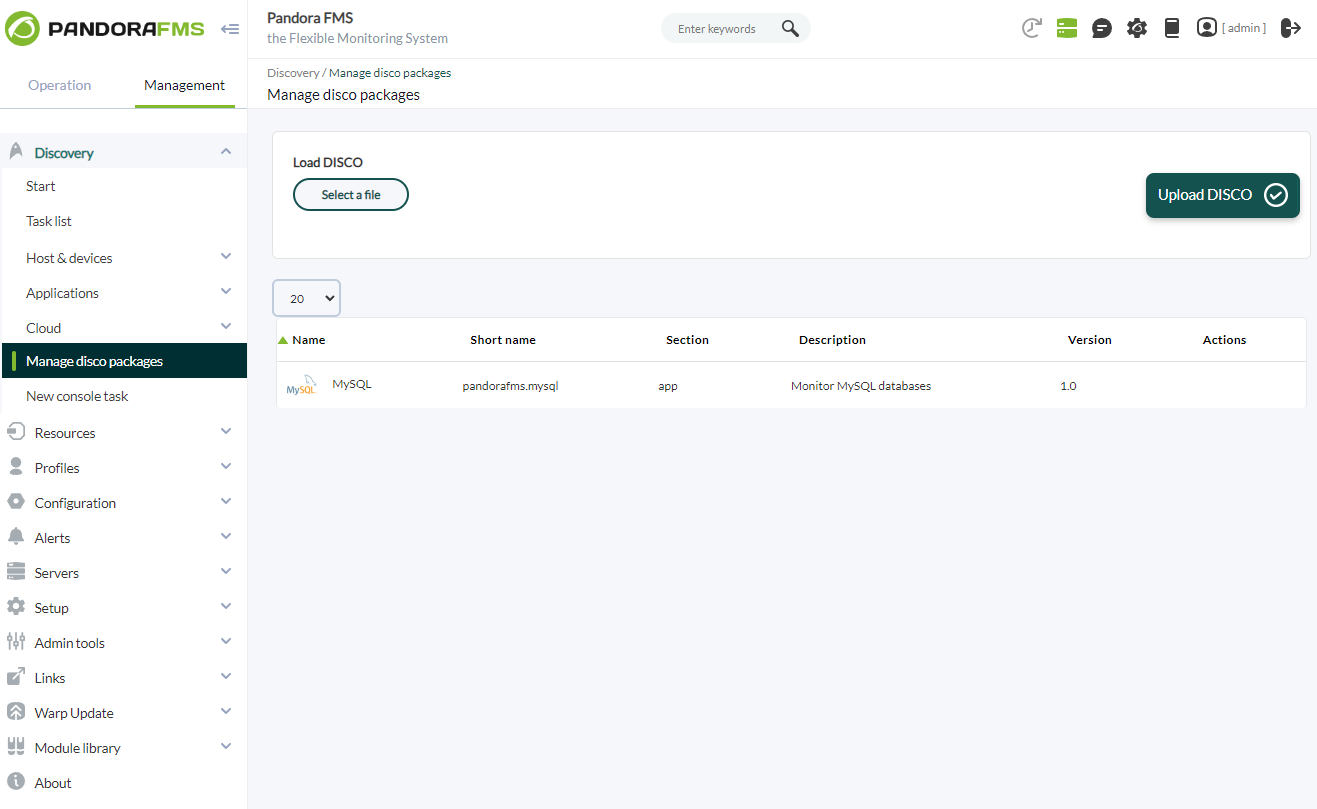
Once loaded, MySQL environments can be monitored by creating Discovery tasks from the Management > Discovery > Applications.
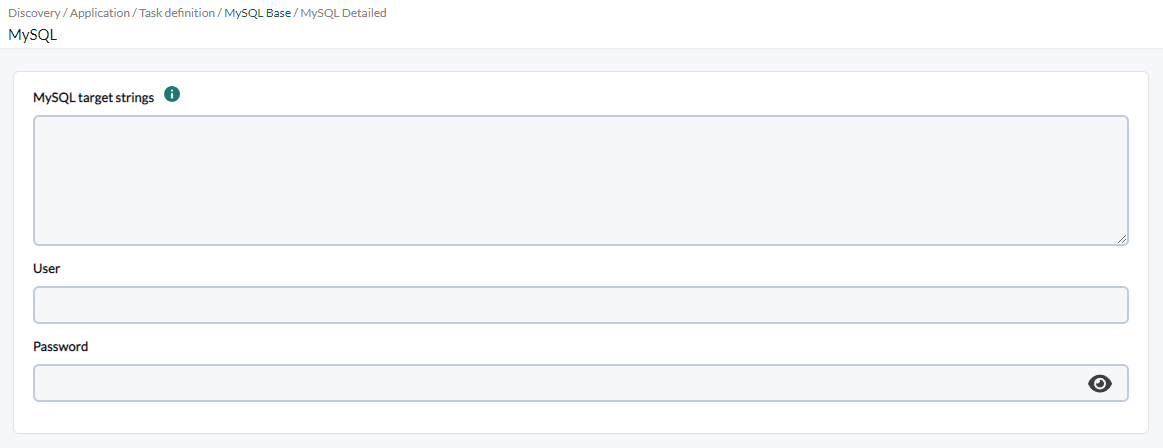
The following minimum data will be requested for each task:
- MySQL target string: List of MySQL targets to be monitored by the task. It will be a comma or line separated list. Each target database can be defined with the format IP:PORT or IP.
- User: User of connection to the target databases.
- Password: Password of the specified user.
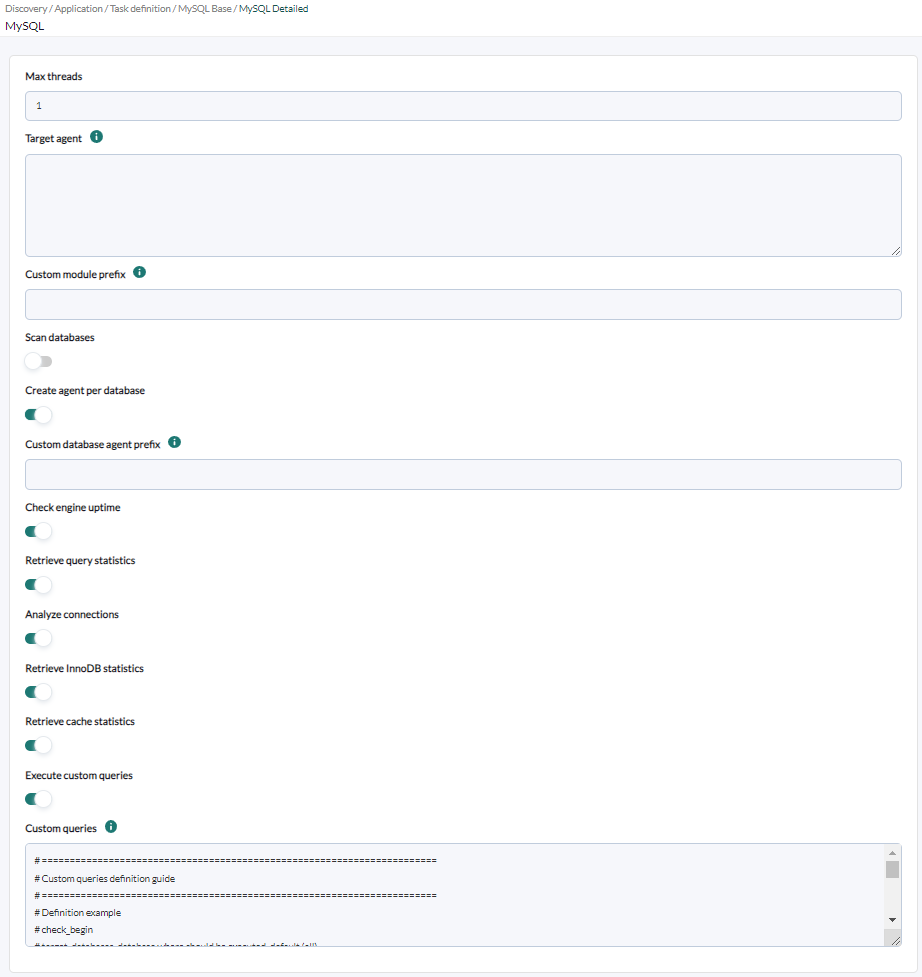
You can also adjust the task configuration to customize the desired monitoring:
- Max threads: To optimize execution time, you can configure multiple threads to monitor the task's agents. Keep in mind that configuring multiple threads may increase the CPU usage of the task.
- Target agent: List of target agents for the MySQL targets to monitor. In other words, these are the names under which agents for each defined target in the task will be generated. It should be a comma-separated or newline-separated list. The position of the names in the list should match the position of the MySQL targets in their list, meaning the first name will be used for the first target, and so on. If the list is separated by lines, blank lines will be ignored. If no agent name is specified for a target, its IP or FQDN will be used as the agent name.
- Custom module prefix: Text included as a prefix for all generated module names. It's useful for locating modules generated by the task or distinguishing them from others.
- Scan databases: If activated, it will monitor the various databases of each MySQL target.
- Create agent per database: If activated, a separate agent will be created for each database of each MySQL target. Enabling database monitoring is necessary for this to work.
- Custom database agent prefix: Text included as a prefix for the names generated for individual agents of each database of each MySQL target. It's useful for locating agents generated by the task or distinguishing them from others.
- Check engine uptime: If activated, it will monitor the uptime of the targets.
- Retrieve query statistics: If activated, it will monitor query statistics.
- Analyze connections: If activated, it will monitor connections.
- Retrieve InnoDB statistics: If activated, it will monitor InnoDB statistics.
- Retrieve cache statistics: If activated, it will monitor cache statistics.
- Execute custom queries: If activated, it will allow executing custom queries for each MySQL target and each database.
- Custom queries: Configuration block to define the custom queries to be executed. Each query will generate a new module for each agent in the task.
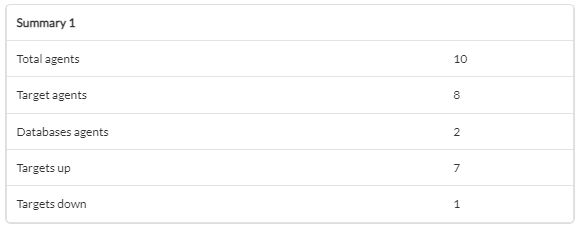
Successfully completed tasks will have an execution summary with the following information:
- Total agents: Total number of agents generated by the task.
- Target agents: Total number of agents generated by the task for the defined targets.
- Databases agents: Total number of agents generated by the task for the discovered databases.
- Targets up: Total number of targets successfully connected to.
- Targets down: Total number of targets that could not be connected to.
Tasks that are not completed successfully will have an execution summary recording the errors that occurred.
Agents and modules generated by the plugin
The plugin will create one agent for each target instance. That agent will contain the following modules. This agent will contain the following modules
If engine_uptime is enabled:
| restart_detection | It will be 0 if an unexpected restart has been detected, and 1 if this is not the case. When a server restarts unexpectedly, there may be an interruption in access to the database and potentially transactions or data not saved correctly may be lost. |
If query_stats is enabled:
| queries | Number of total queries. Monitoring queries is essential for understanding the workload running on the server and assessing overall system performance. By monitoring the total number of queries, you can identify spikes in activity, optimize performance and detect potential problems, such as inefficient or excessive queries. |
| query rate | Query Rate. The query rate refers to the speed at which queries are being executed on the MySQL server. Monitoring the query rate allows you to evaluate the server workload in real time and detect usage patterns. A high query rate may indicate a high demand for resources and require server configuration adjustments or hardware upgrades to maintain optimal performance. On the other hand, a low query rate may indicate underutilization of available resources or application performance problems. |
| query select | Number of SELECT queries. SELECT queries are used to retrieve data from the database. Monitoring SELECT queries allows you to evaluate query efficiency and index optimization. By identifying slow or inefficient SELECT queries, you can take steps to improve their performance, such as adding appropriate indexes, optimizing queries, or adjusting server settings. |
| query update | Number of UPDATE queries. UPDATE queries are used to modify existing data in the database. Monitoring UPDATE queries is important to evaluate the frequency and efficiency of data updates. You can identify UPDATE queries that affect a large number of rows or that have a significant impact on server performance. This allows you to optimize queries, review the structure of tables or take measures to reduce the load generated by updates. |
| query delete | Number of DELETE queries. DELETE queries are used to remove data from the database. Monitoring DELETE queries is useful for evaluating the frequency and efficiency of data deletions. You can identify DELETE queries that affect a large number of rows or have a significant impact on server performance. This allows you to optimize queries, review the table structure or take measures to reduce the load generated by deletes. |
| query insert | Number of INSERT queries. INSERT queries are used to insert new data into the database. Monitoring INSERT queries allows you to evaluate the frequency and efficiency of data insertions. You can identify INSERT queries that are generating a high load on the server or that could be causing performance problems. This allows you to optimize queries, review table structure or consider deferred insert strategies to improve performance in high concurrency environments. |
If analyze_connections is enabled:
| current connections | Number of current connections. The number of current connections refers to the number of simultaneous connections established with the MySQL server at a given time. It is essential to monitor this value to ensure that the server can handle the current workload. If the number of current connections is close to the maximum number of connections allowed, new users or applications may not be able to connect properly. It is also important to check for an unusual increase in connections, which could indicate a performance problem or possible malicious activity. |
| connections ratio | Connection ratio. The connection ratio refers to the frequency with which connections are established and closed on the MySQL server. Monitoring this value can help you identify usage patterns and activity peaks. A high connection ratio may indicate a high demand for resources and require actions such as adjusting the server configuration, increasing hardware capacity or revising the application design. On the other hand, a low connection ratio may suggest an underutilization of available resources. |
| aborted connections | Number of aborted connections. Aborted connections are those that are abnormally interrupted before completing their normal life cycle. This can occur due to network problems, authentication errors, inefficient queries or server configuration problems. Monitoring for aborted connections is critical to identifying and troubleshooting problems that can affect the stability and performance of the MySQL server. By detecting patterns of aborted connections, you can take corrective action and optimize your application or infrastructure to avoid unwanted outages. |
If innodb_stats is enabled:
| Innodb buffer pool pages total | Total number of pages in the buffer pool (utilization). The InnoDB buffer is an essential part of the InnoDB storage architecture in MySQL. Monitoring the total number of pages in the InnoDB buffer is important to evaluate the efficiency of the buffer and its ability to store data in memory instead of having to access it from disk. A proper and well-tuned InnoDB buffer value can improve overall system performance by reducing the need to perform reads and writes to disk. |
| Innodb buffer pool read requests | Read from innodb buffer pool. This metric indicates the number of times you have requested to read data from the InnoDB buffer. Monitoring InnoDB buffer read requests can help you assess the efficiency of the buffer and determine if the majority of reads are being serviced from memory or if there is a high load of reads from disk. A high number of InnoDB buffer read requests can indicate good memory utilization and better performance. |
| Innodb disk reads | Number of read operations. Reads from disk in InnoDB refer to read operations that are performed directly from disk storage instead of using data stored in the InnoDB buffer. Monitoring reads from disk allows you to evaluate the efficiency of the InnoDB buffer and determine if too many reads from disk are being performed. A high number of reads from disk may indicate a need to adjust the InnoDB buffer size or improve query efficiency. |
| Innodb disk writes | Number of write operations. Writes to disk in InnoDB refer to write operations that are performed directly to disk storage. Monitoring disk writes is important to evaluate the write load and determine if too many write operations are being performed that may affect performance. A high number of writes to disk may indicate the need to optimize write operations or consider using techniques such as cache tuning or batch writing to improve performance. |
| Innodb disk data read | Amount of data read from disk. This metric refers to the amount of data read from disk in InnoDB. Monitoring the amount of data read from disk helps you evaluate the performance and efficiency of read operations in InnoDB. A high volume of data read from disk may indicate a performance problem and the need to optimize queries or improve InnoDB buffer efficiency. |
| Innodb disk data written | Amount of data written to disk. This metric refers to the amount of data that has been written to disk in InnoDB. Monitoring the amount of data written to disk helps you evaluate the performance and efficiency of write operations in InnoDB. A high volume of data written to disk may indicate a high write load and the need to optimize write operations or consider techniques such as cache tuning or batch writing to improve performance. |
If cache_stats is enabled:
| query cache enabled | Query cache enabled. The query cache in MySQL allows queries and their results to be stored in memory so that they can be reused if the exact same query is repeated. Monitoring whether the query cache is enabled or disabled is important to evaluate the impact of the cache on overall system performance. Query caching can improve performance by preventing repeated execution of identical queries, but it can also have a negative impact if queries change frequently or if the cache size is insufficient. |
| query hit ratio | Query hit ratio. The query hit ratio refers to the proportion of queries that have been resolved by the query cache compared to the total number of queries executed. Monitoring the query hit ratio allows you to evaluate the efficiency of the query cache and determine whether it is being used effectively. A high query hit ratio indicates good cache performance, while a low hit ratio may indicate that the cache is not optimized or that queries change frequently. |
The plugin will create one agent for each database if “scan_databases” and ‘agent_per_database’ are enabled. If only “scan_databases” is enabled, the following modules will be included in the agent of the instance where that database is located. It will contain the following modules:
| < database name > availability | Indicates database availability |
| < database name > fragmentation ratio | Percentage of unused or fragmented space across all tables in the database |
| < database name > size | Sum of all table and index storage allocated to the database, expressed in megabytes |
The plugin will also create a module for each custom query defined in the configuration file.