MongoDB
This document describes the MongoDB functionality of PandoraFMS discovery.
- Introduction
- Pre requisites
- Parameters and configuration
- Manual execution
- Discovery
- Agents generated by the plugin
Introduction
The purpose of this plugin is to monitor MongoDB databases, through metrics that are key to know the performance and status of the databases, such as the number of connections, number of queries, latency, network and uptime. This data will be reflected in PandoraFMS, in modules that will provide the statistical value, inside an agent that will represent each database.
This plugin is developed to be used with Pandora FMS Discovery, so unlike other plugins it does not generate agents by XML, but everything discovered is returned in the plugin's JSON output.
Pre requisites
This plugin performs remote connections to the databases to be monitored, so it is necessary to ensure connectivity between the Pandora FMS server and these databases.
In turn the following permissions are required for the user used to connect.
For databases
role read or dbAdminFor server stats
role clusterMonitor or clusterAdminParameters and configuration
Parameters
| --conf | Path to configuration file |
| --target_databases | Path to the configuration file containing the database targets |
| --target_agents | Path to the configuration file containing the agent targets |
| --custom_queries | Path to the configuration file containing the modules with custom queries |
Configuration file (--conf)
agents_group_id = < ID of the group in which the agents will be created >
interval = < Monitoring interval for agents in seconds >
threads = < Number of threads to be used for agent creation >
scan_databases = < Set to 1 to enable this token to monitor the databases of the configured instances >
agent_per_database = < Set to 1 to enable this token to monitor the databases of the configured instances. >
db_agent_prefix = <  Prefix for the database agents created. >
modules_prefix = < Prefix for created modules >
execute_custom_queries = < Set to 1 to enable the use of custom queries >
analyze_connections = < Set to 1 to enable connection monitoring >
engine_uptime = < Set to 1 to enable runtime monitoring >
query_stats = < Set to 1 to enable query statistics monitoring >
network = < Set to 1 to enable network statistics monitoring >
latency = < Set to 1 to enable latency statistics monitoring >
Example
agents_group_id = 10
interval = 300
threads = 1
modules_prefix = Mongodb.
scan_databases = 1
agent_per_database = 1
db_agent_prefix = Mongodb.
execute_custom_queries = 1
analyze_connections = 1
network = 1
query_stats = 1
latency = 1
engine_uptime = 1
List of target databases (--target_databases)
The file content will be a list of target instances, separating each instance by commas or lines. The connection URI for each one must be specified.
Example
mongodb://172.17.0.2:27017
mongodb://172.17.0.7:27017
If you want to monitor specific databases within an instance, you must specify them using "|" and separate each database with ";".
Example:
mongodb://172.17.0.7:27017|pandora_db;pandora_db2If you want to exclude specific databases from a query, you must specify them using "|" and separate each database with ";", including an exclamation mark ! before the "|" :
Example :
mongodb://172.17.0.7:27017!|pandora_db;pandora_db2List of target agents (--target_agents)
The content of the file will be a list of agent name bases, separating each agent by commas or lines. These agent names will be used to dump the information from each target database into the corresponding indicated agent name, rather than letting the plugin generate the agent names automatically.
The position of each agent name in the listing must match the position of the target database in its own listing, that is, the name for the first target database will be the first name in this listing, taking into account that blank lines are ignored.
Example
agente1,,agente3
agente4
agente5,agente6,agente7,,agente9
Custom queries (--custom_queries)
A module must be entered for each custom query to be monitored. The modules must follow a structure, which is as follows:
check_begin      --> Opening tag of the module
name             --> Name of the module
description      --> Description of the module.
operation        --> Type of operation, value | full -> value returns a single value, full returns all rows of a string
datatype         --> Module data type
min_warning      --> Minimum warning threshold configuration
max_warning      --> Maximum warning threshold configuration
str_warning      --> Warning string configuration
warning_inverse  --> Enable inverse interval with 1 for warning threshold
min_critical     --> Minimum critical threshold configuration
max_critical     --> Maximum critical threshold configuration
str_critical     --> Critical string configuration
critical_inverse --> Enable inverse interval with 1 for critical threshold
module_interval  --> This interval is calculated as a multiplier of the agent interval.
target           --> Custom query
target_instances --> Custom queries will be executed on the databases belonging to the instances configured here. If not specified, all will be monitored, same as specifying "all". To select one or several specific ones, separate them with ","
target_databases --> Custom queries will be executed on the databases configured here. If not specified, all will be monitored, same as specifying "all". To select one or several specific ones, separate them with ","
check_end        --> Closing tag of the module
Example
check_begin
name DatabaseStats
description Database statistics
operation value
datatype generic_data
target db.runCommand({ dbStats: 1 })
target_instances mongodb://172.17.0.2:27017
target_databases pandora_db, pandora_db2
check_end

check_begin
name Getcollection
description get collection
datatype generic_data_string
min_warning 10
target db.system.version.find({})
target_instances all
target_databases all
check_end

check_begin
name Getdocument
description get document
#operation value
datatype generic_data_string
min_warning 10
target db.mi_coleccion.find({ "_id": ObjectId("655b4a235d797f3769d6b03e") })
check_end
Queries for the target parameter of the modules
Commands can be executed according to the following format:
db.runCommand(< command >)or
runCommand(< command >)To know the expected response, to configure the type of module in string or data as required.
As a precaution only the following type of commands will be executed : dbStats,collStats,find,cound,aggregate,listCollections
Find queries can be run to obtain data from collections and documents:
db.< collection >.find({})or
< collection >.find({})With the possibility of specifying queries within the find method:
db.< collection >.find({ "<key document": "value" })Example:
db.mi_collection.find({ "_id": ObjectId("655b4a235d797f3769d6b03e") })Manual execution
The format of the plugin execution is as follows:
./pandora_mongodb \
--conf < path to the configuration file > \
--target_databases < path to the configuration file containing the target databases > \
[ --target_agents < path to agent configuration file > ] \
For example:
./pandora_mongodb \
--conf /usr/share/pandora_server/util/plugin/mongodb.conf \
--target_databases /usr/share/pandora_server/util/plugin/targets.conf \
--target_agents /usr/share/pandora_server/util/plugin/target_agents.conf
Discovery
This plugin can be integrated with Pandora FMS Discovery.
To do so, you must install the ".disco" package, which you can download from the Pandora FMS repository:
https://pandorafms.com/library/
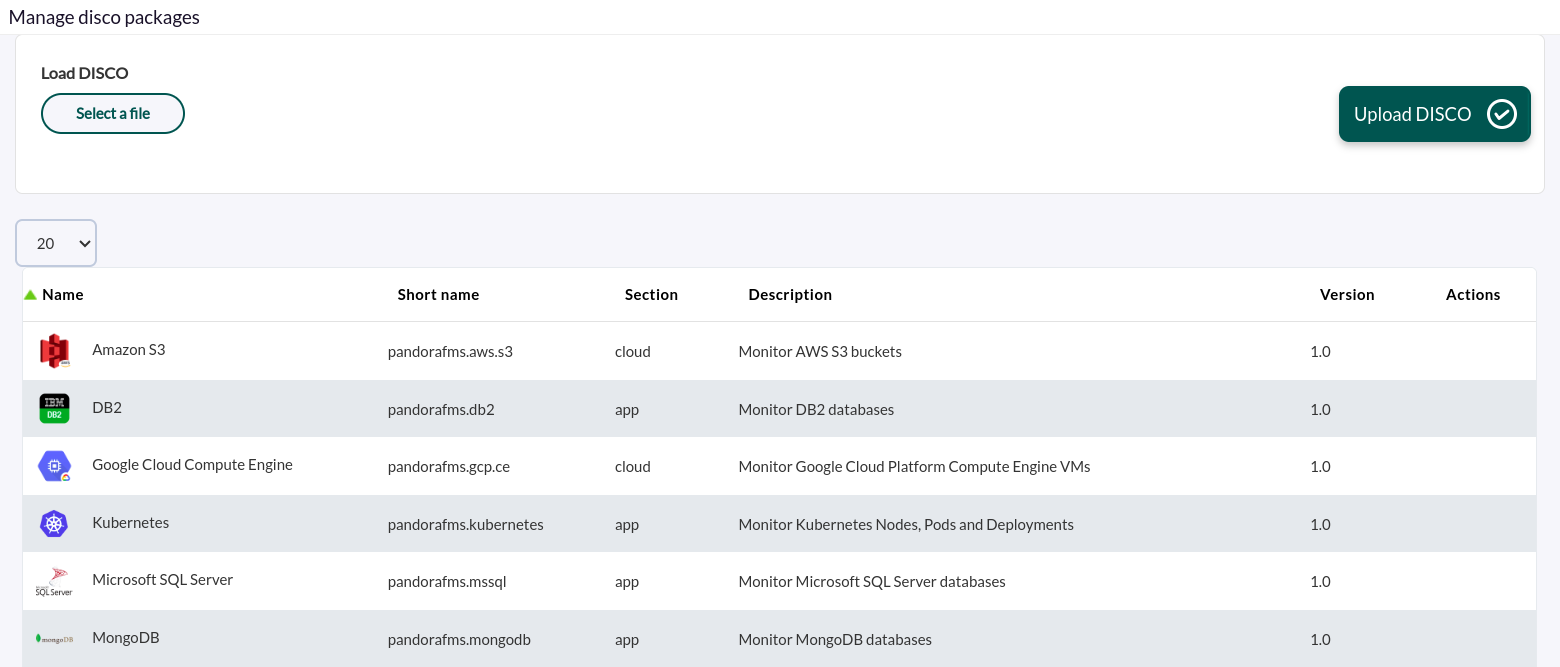
Once loaded, you can monitor MongoDB environments by creating Discovery tasks from the Management > Discovery > Applications section.
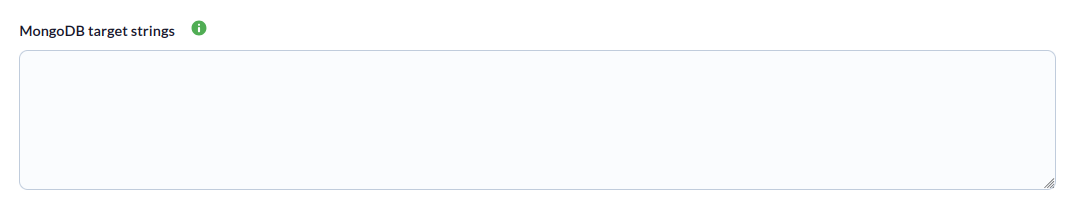
For each task, the following minimum information will be required:
- MongoDB target strings : List of target instances, separated by commas or new lines. You must specify the connection URI for each one. Example: mongodb://172.17.0.2:27017 or mongodb://monitor_user:s3cur3P@ss@mongo-prod-01.internal.company.com:27017/monitoring?authSource=admin.
If you want to monitor specific databases within an instance, you must specify them using "|" and separate each database with ";".
Example:
mongodb://172.17.0.7:27017|pandora_db;pandora_db2If you want to exclude specific databases from a query, you must specify them using "|" and separate each database with ";", including an exclamation mark ! before the "|" :
Example :
mongodb://172.17.0.7:27017!|pandora_db;pandora_db2
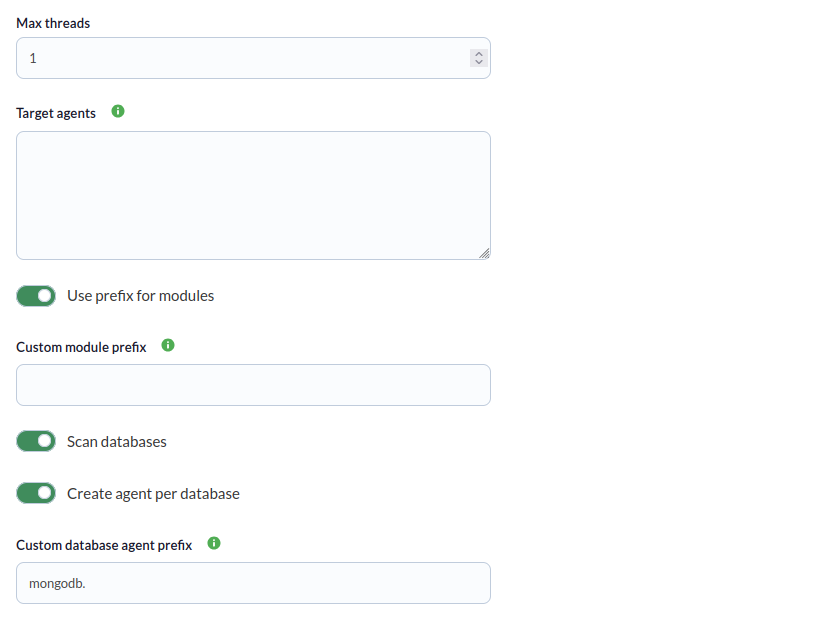
You can also adjust the task settings to customize the monitoring as desired:
- Max threads: To optimize execution time, multiple threads can be configured to monitor the task's agents. Note that configuring multiple threads may increase the task's CPU usage.
- Target agent: List of target agents for the MongoDB targets to be monitored. These are the names that will be used to generate the agents for each target defined in the task. This will be a comma-separated or line-separated list. The position of the names in the list must match the position of the MongoDB targets in their respective lists; that is, the first name will be used for the first target, and so on. If the list is line-separated, blank lines will be ignored. If no agent name is specified for a target, its name will be used as the agent name.
- Use prefix for modules: Enable this token to be able to specify a custom prefix for the created modules.
- Custom prefix for modules: Prefix for created modules.
- Scan databases: Enable this token to monitor the databases of the configured instances.
- Create agent per database: Enable this token to generate one agent for each database generated.
- Custom database agent prefix: Prefix for the created database agents.

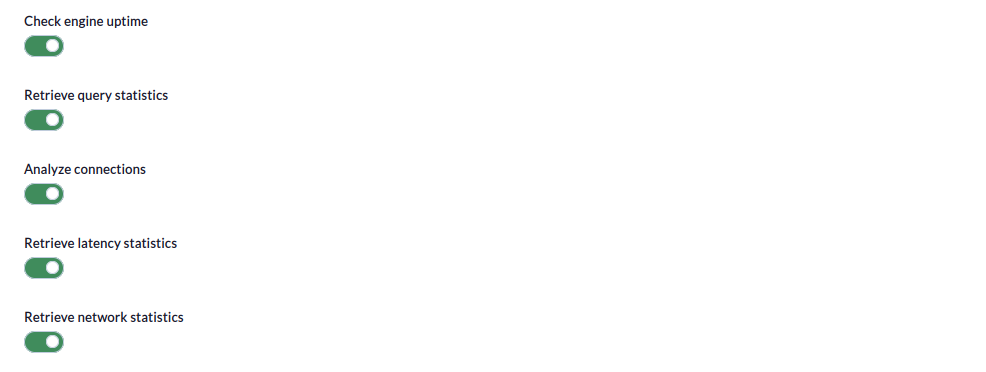
-
Check engine uptime: If enabled, this will monitor the uptime of the targets.
-
Retrieve query statistics: If enabled, this will monitor query statistics.
-
Analyze connections: If enabled, this will monitor connections.
-
Retrieve latency statistics: If enabled, this will monitor latency.
-
Retrieve network statistics: If enabled, this will monitor networks.
Finally, you can configure custom queries in the last step of the task (optional).
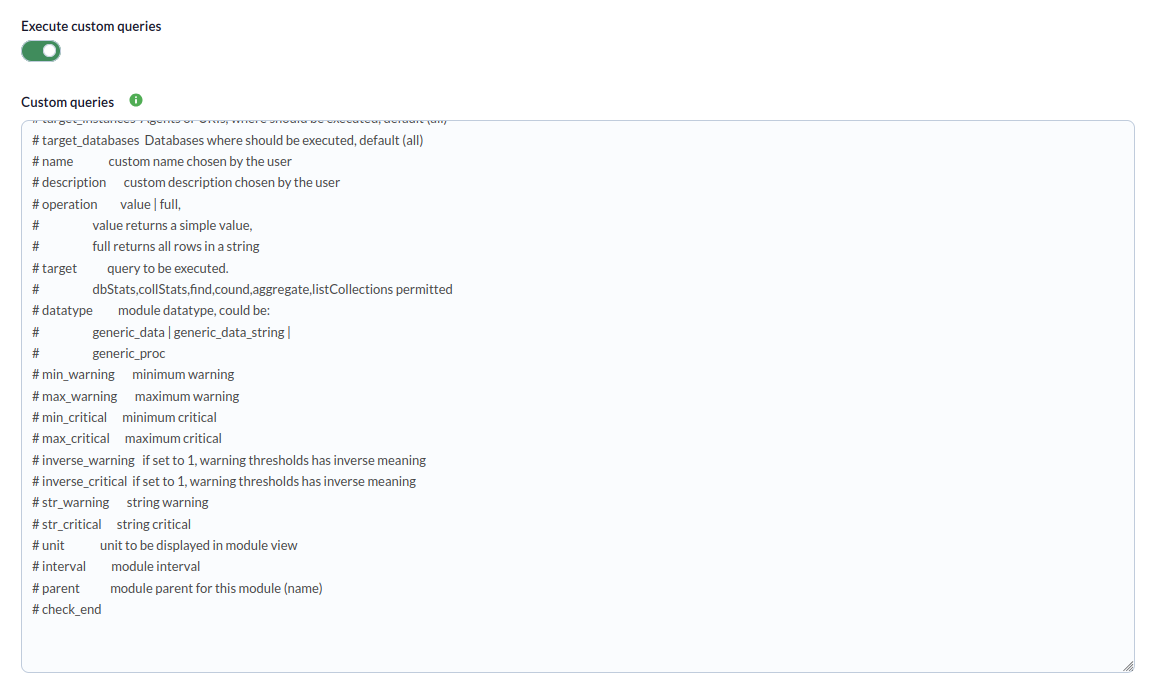
- Run custom queries: If enabled, this allows you to run custom queries.
- Custom queries: In this window, you can specify the custom modules with the desired custom queries (see the "Parameters" section for the correct configuration syntax)
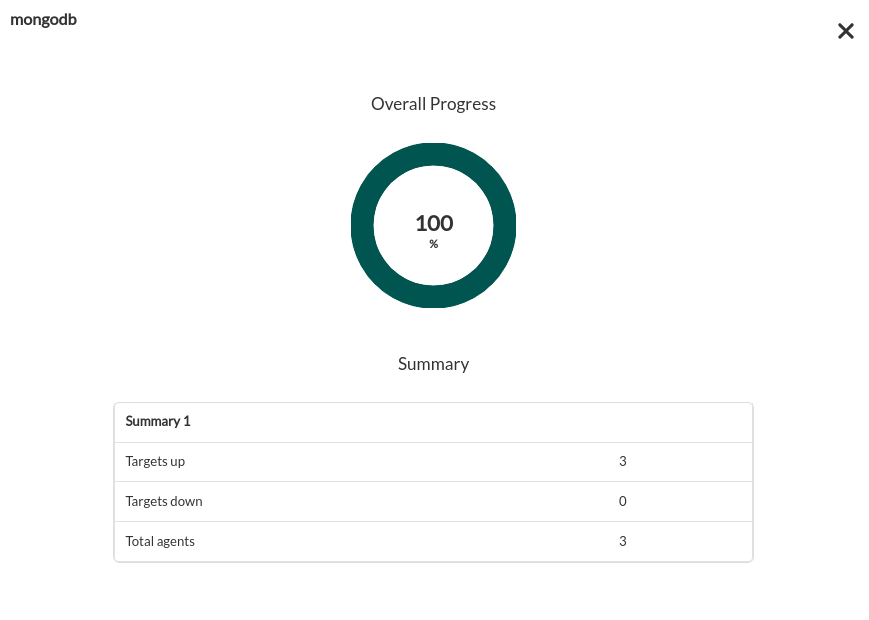
Tasks that are successfully completed will include an execution summary containing the following information:
- Total agents: Total number of agents generated by the task.
- Targets up: Total number of targets that could be connected to.
- Targets down: Total number of targets that could not be connected to.
Tasks that are not completed successfully will include an execution summary listing the errors that occurred.
Agents generated by the plugin
The plugin will create an agent for each target database. That agent will contain the following modules
At the instance level
If engine_uptime is activated:
| uptime | Displays the time the MongoDB server has been running since its last reset or startup. |
If query_stats is activated:
| queries command | Number of MongoDB queries involving command operations. |
| queries delete | Number of delete operations performed on the MongoDB database. |
| queries getmore | Number of "getmore" operations executed, "getmore" is used to get more results from a query when the results do not fit in a single batch. |
| queries insert | Number of insert operations performed on the MongoDB database. |
| queries query | Number of query operations performed on the MongoDB database. |
| queries update | Number of update operations performed on the MongoDB database. |
If analyze_connections is activated:
| connections available | Number of available connections on the MongoDB server |
| connections current | Current number of active connections on the MongoDB server |
| connections totalCreated | Total number of connections that have been created on the MongoDB server since it was started or restarted. |
| MONGODB connection | Current connection availability |
If latency is activated:
| commands latency | Average latency of command type operations in MongoDB. |
| commands ops | Total number of command type operations performed in MongoDB. |
| reads latency | Average latency of read operations in MongoDB. |
| reads ops | Total number of read operations performed on MongoDB. |
| writes latency | Average latency of MongoDB write operations. |
| writes ops | Total number of write operations performed on MongoDB. |
If network is activated:
| bytesIn | Total number of bytes that have been received by the MongoDB server since it was started or restarted. |
| bytesOut | Total number of bytes that have been sent by the MongoDB server to clients or applications since it was started or restarted. |
| numRequests | Total number of requests that the MongoDB server has received since it was started or restarted. |
At the database level
| <db_name> collections | Number of collections in the database. |
| <db_name> indexes | Number of indexes in the database. |
| <db_name> indexSize | Total size of all indexes in the database in bytes. |
| <db_name> views | Number of views in the database. |
| <db_name> objects | Number of documents (objects) in the database. |
| <db_name> avgObjSize | Average size of documents in the database in bytes. |
| <db_name> ataSize | Total size of data within the database in bytes. |
| <db_name> storageSize | Total amount of space used by the database on disk, including indexes and padding, in bytes. |
| <db_name> totalSize | Sum of dataSize and indexSize, representing the total size of the database in bytes |
| <db_name> fsUsedSize | Space used in the file system where the database resides in bytes. |
| <db_name> fsTotalSize | Total size of the file system where the database resides, in bytes. |
| <db_name> status | Database status (1 = OK, 0 = error). |