Mongo DB and Mongo DB atlas
Plugin to grab stats from a server, database and its collections, supports Mongo DB atlas compatibility.
- Introduction
- Compatibility matrix
- Prerequisites
- Configuration
- General parameters
- Specific parameters
- Manual execution
- Configuration in Pandora
- Modules generated
Introduction
Ver. 25-08-2021
With this plug-in you can view the stats of a database and its collections, it supports Mongo DB atlas compatibility.
Compatibility matrix
| Systems where it has been tested |
CentOS 7, Fedora |
| Systems where it should work |
Any linux system |
Prerequisites
Requires:
- A Mongo DB or Mongo DB atlas database
- Have Pandora FMS Data Server enabled.
- Have Pandora FMS Plugin Server enabled.
Configuration
To use the plugin you will need to have a number of dependencies installed.
The first thing is to have python 3 installed
yum install python3The plugin comes with a file called requirements.txt that will install the other necessary dependencies. To run it we will use:
pip3 install -r requirements.txtHowever, if you want to install its dependencies without the requirements file, you can use the following commands (recommended if you don't use a Mongo DB atlas database)
PyMongo
python -m pip install pymongoor with the following command if Python 3 is not your default Python version:
python3 -m pip install pymongodnspython
python -m pip install dnspythonor with the following command if Python 3 is not your default Python version:
python3 -m pip install pymongonote: dnspython is only required if you use a MongoDB atlas database.
To connect, you need to know your connection ip or uri. If you have set up the database in docker you can see it with :
docker inspect <id-contenedor>
The default port is usually 27017. For example with this ip the connection url would be :
mongodb://172.17.0.2:27017
For MongoDB atlas, we will need the connection string, this is obtained by doing the following.
Let's go to connect:

We will be presented with several options to connect:
For example, I have chosen MongoDB compass, and when I click on it, it will show us the connection string, if we have already installed it, or it will give us the option to install it.
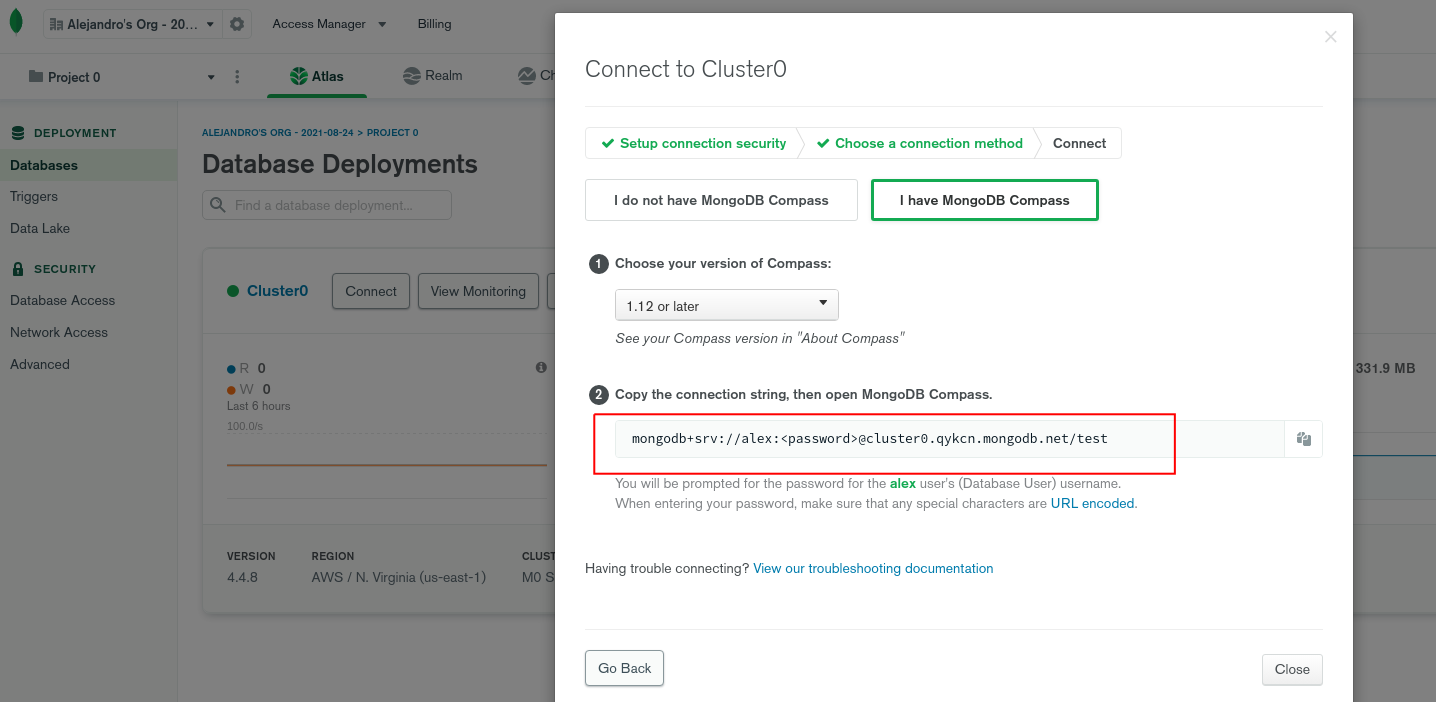
That would be the connection string, obviously you would have to change <password> to your password.
General parameters
Execution command:
python pandora_mongodb -u <uri> -s <server> -d <databases> -a <alldatabases> -p <prefix> -c <collectionstats> [ -g <group> ] [ --data_dir <data dir> ] [ --as_agent_plugin 1]
If the execution is successful we will see an integer, which will be the database number we have.

If we want to run it as an agent plugin, we will do it using the optional parameter "as_agent_plugin" with a "1" which will return an xml with the data of our server:

This will only work if you put a single database with the -d parameter, it will not work with -a which is the parameter for all databases.
Specific parameters
The plug-in has the following parameters:
| Parameter | Description |
| -u <uri> --u <uri> | The connection uri (mandatory) |
| -s <server> --server <server> | To get server stats (cluster) |
| -d <name_database> --databases <name_database> |
To get statistics from a database, the one with the name you enter. |
| -a <1> --alldatabases <1> | To get the stats from all databases, it is activated with 1 |
| -p <prefix> --prefix <prefix> | To name the agents (optional) |
| -c <1> --collectionstats <1> | To activate the stats of the collections in the database, activate with 1 (optional). |
| -g GROUP, --group GROUP | Pandora FMS target group (optional) |
| --data_dir DATA_DIR | Pandora FMS data directory. By default it is /var/spool/pandora/data_in/ (optional) |
| --as_agent_plugin | It's optional, if you want the plugin to be an agent plugin and put the modules in the pandora agent, execute this with a 1 (optional) |
Help example:
./pandora_mongodb
Manual execution
We can test the plugin from the terminal to see if it works, to check it, we run the plugin:

With as_agent_plugin:

Example of implementation with assistance:

Configuration in Pandora
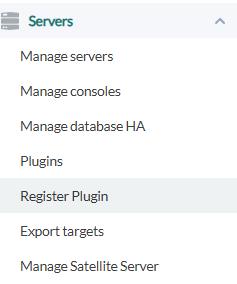
Installation from the console
To register the plugin, from the console, go to the "register plugin" section.
Click on select file.
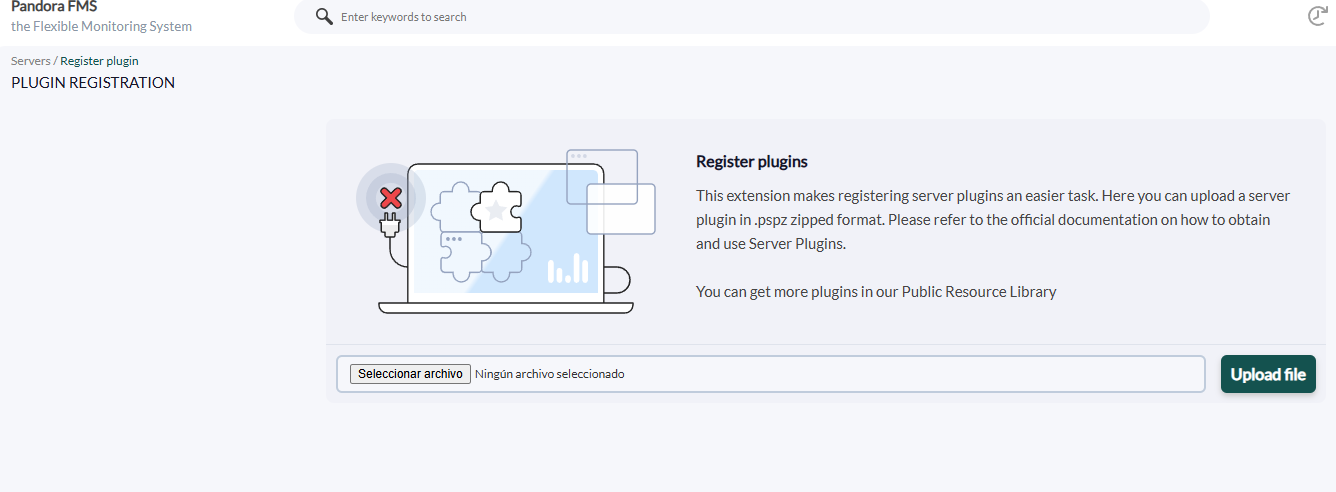
Select the pspz2 file containing the plugin.

Once uploaded you will see a message indicating that it has been successfully registered.

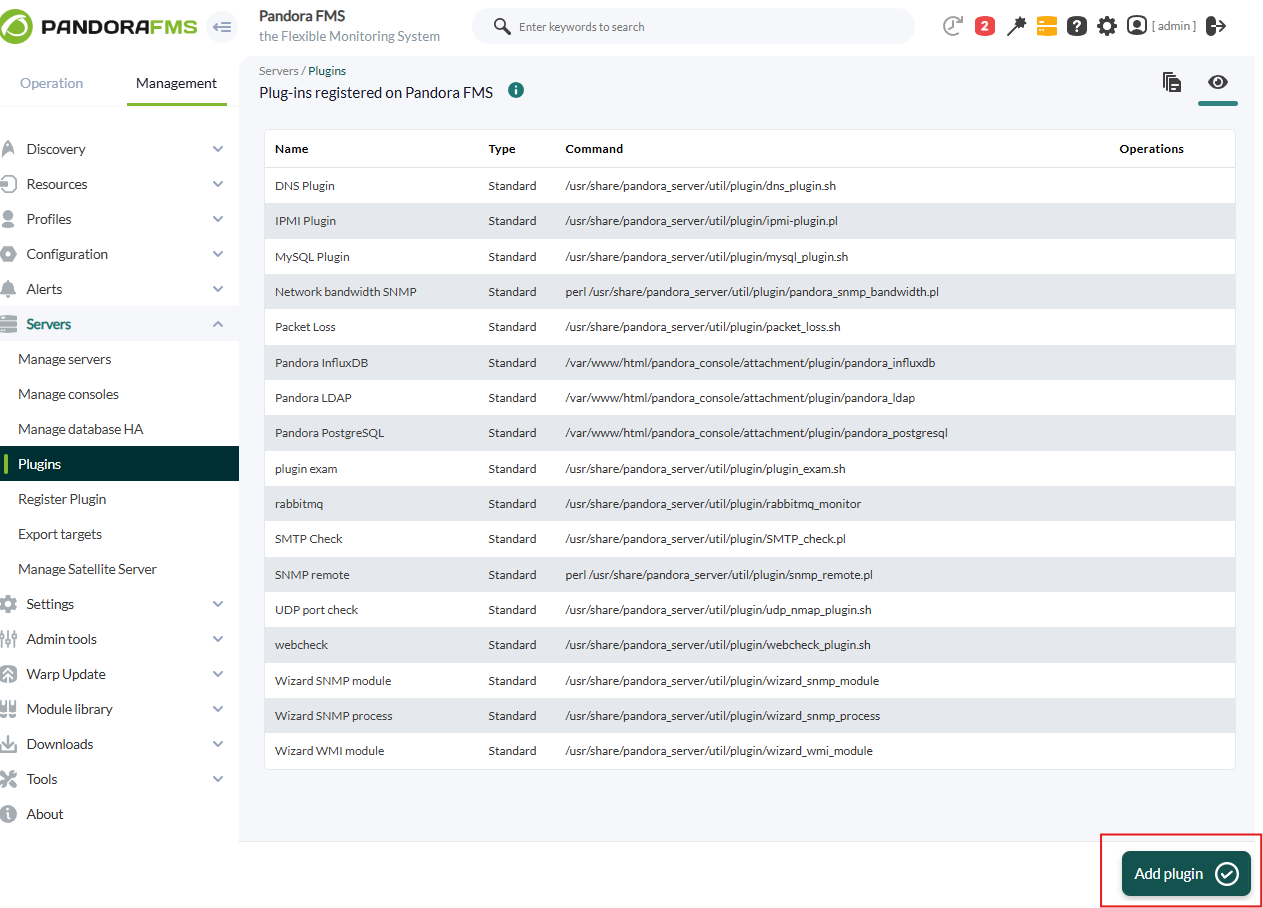
Once the plugin is registered, we will see it in the plugins section.

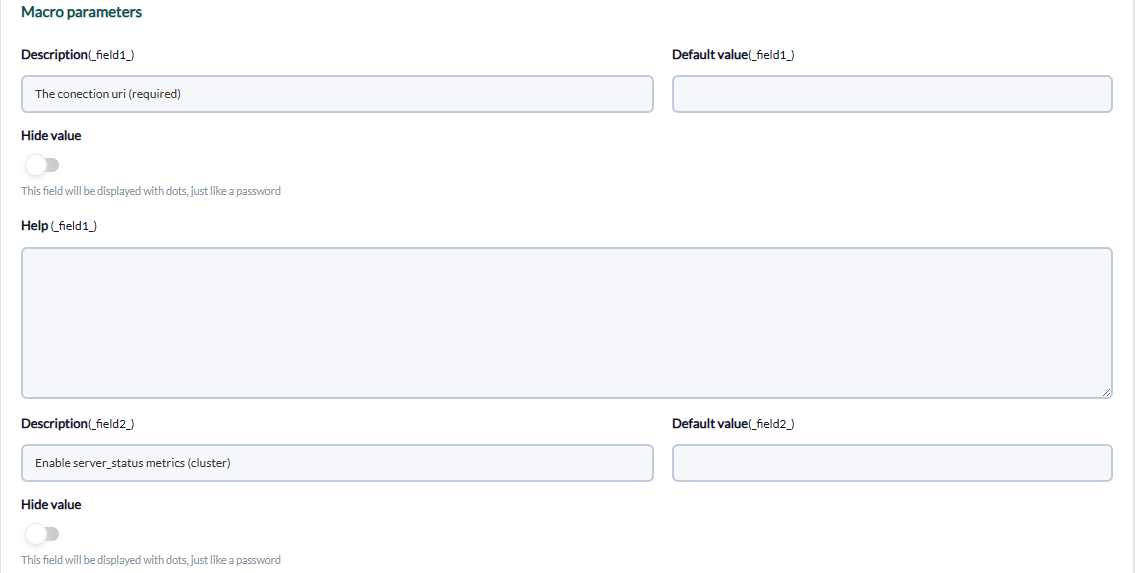
In the parameters section we will see all the parameters used by the plugin, not all of them are essential for its operation, only those that are mandatory in parameters.
In the section below you will see all the parameters used and you will be able to assign them the required value.
Manual installation
The best way to manage server plugins in Pandora is from "/usr/share/pandora_server/util/plugin" so we will send it to that path.
Then we will move to the folder where we have put it ("/usr/share/pandora_server/util/plugin" is the recommended one").
Remember: You have to install the dependencies that the PyMongo module needs in your system, this is explained in the configuration section.
We move from home with :
cd /usr/share/pandora_server/util/plugin/We run the plugin to see that it works:
python pandora_mongodb -u <uri> -s <server> -d <databases> -a <alldatabases> -p <prefix> -c <collectionstats> [ -g <group> ] [ --data_dir <data dir> ] [ --as_agent_plugin 1]
With as_agent_plugin 1 we will be able to see an XML with the data that will be displayed in the console:
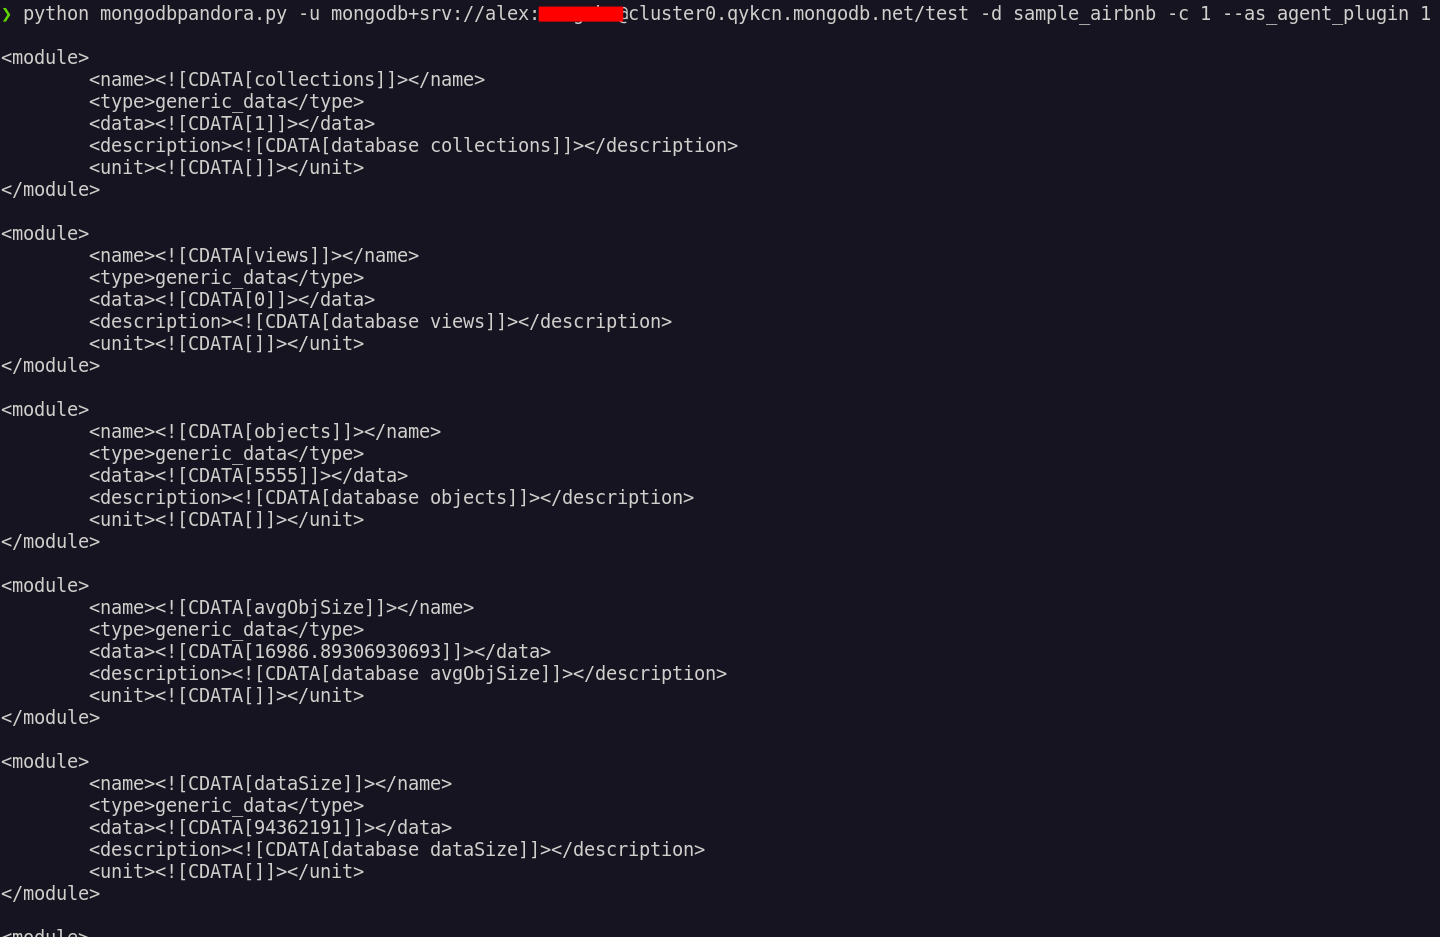
If we execute it in the first way, without "as_agent_plugin 1", we will have created an agent for each database of our cluster. The --as_agent_plugin parameter can only be executed if we insert the databases one by one, introducing their name with the -d parameter.
Anyway, if you prefer to install it manually from the console, the process would be the following:
As a server plugin
Go to servers > plugins:
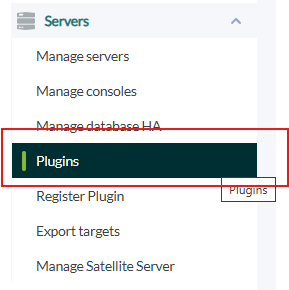
Click on add:
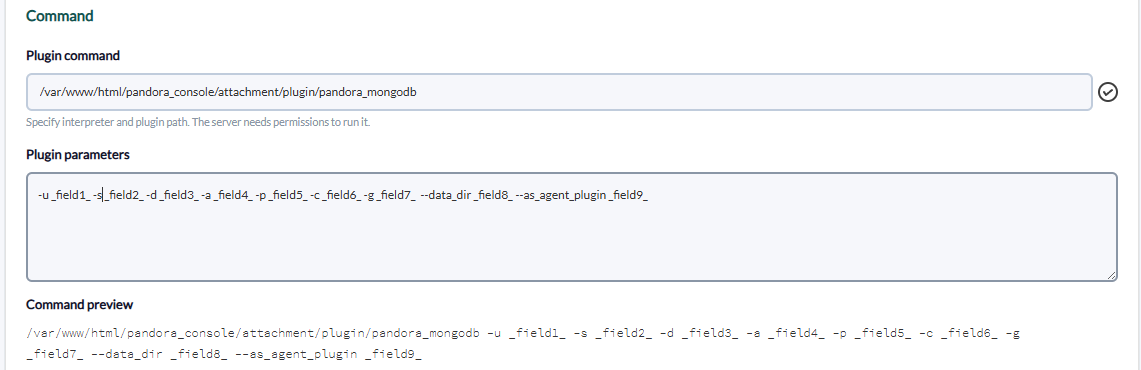
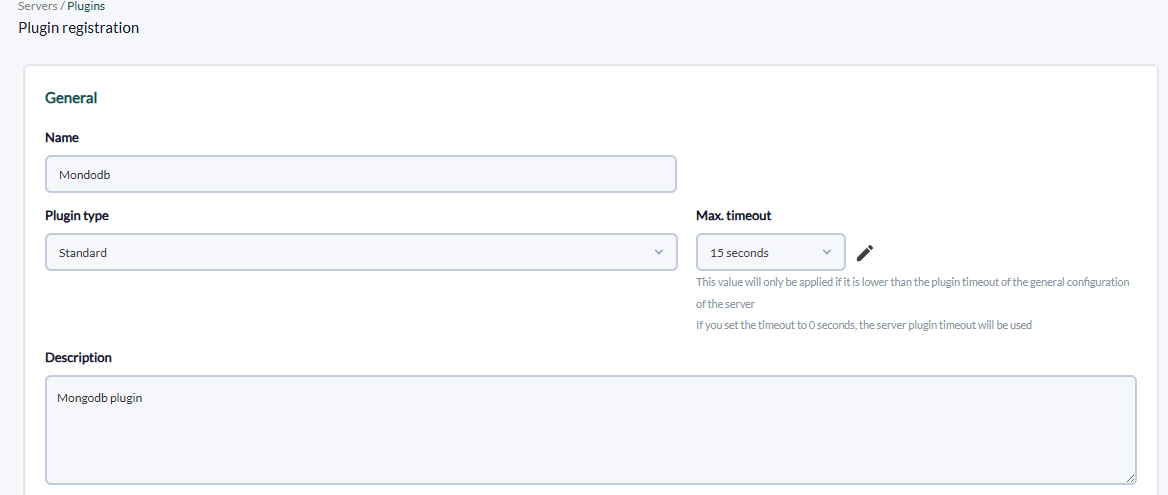
We put in the name and description of your choice:
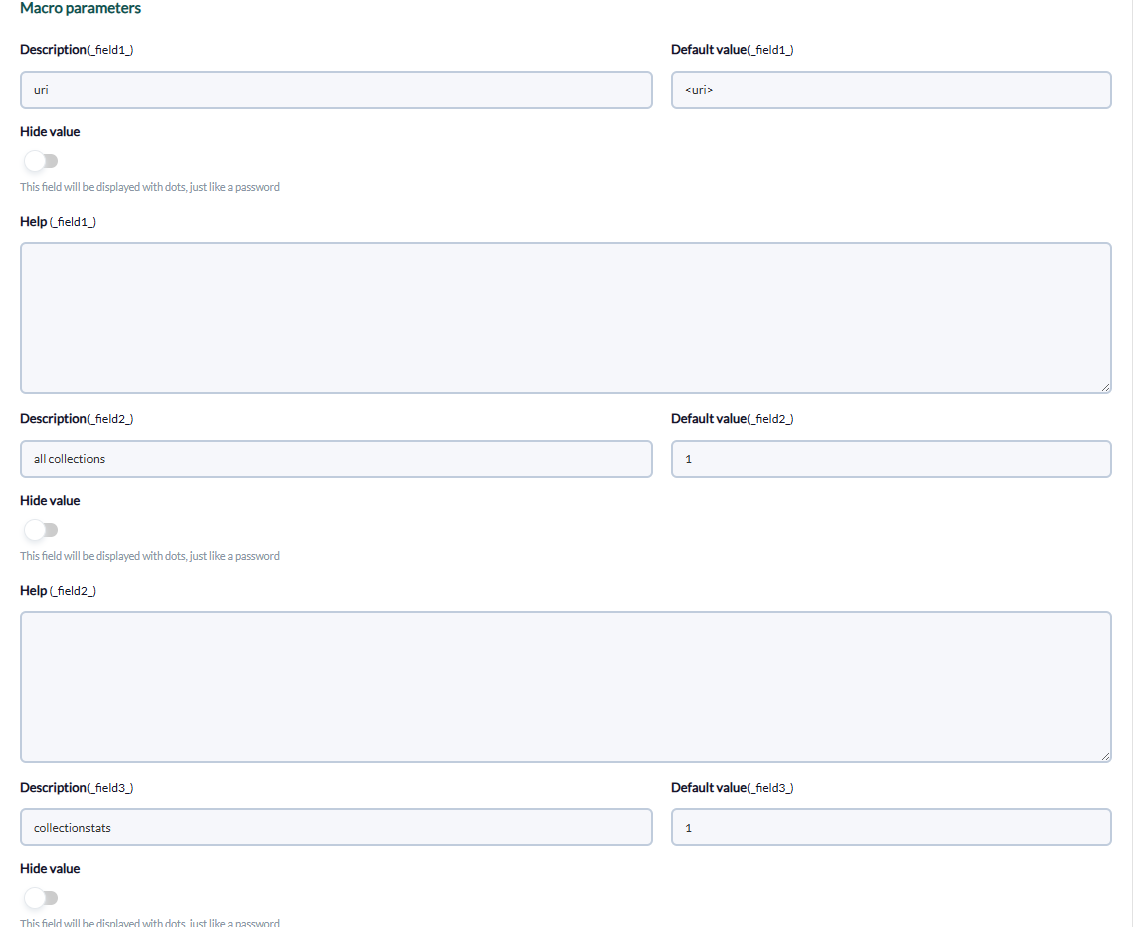
We enter as command the path to the plugin, and as parameters the ones we have entered by executing the plugin, the "_field_" fields are macros defined below.
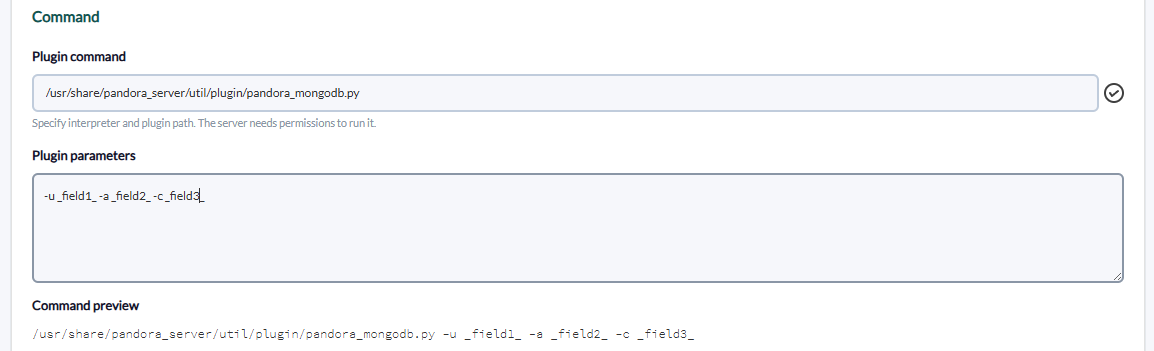
We put for each macro the description of your choice and as value the data of your ldap server.
Once this is done, if we execute the plugin from the terminal, the agent with the modules will have been created.
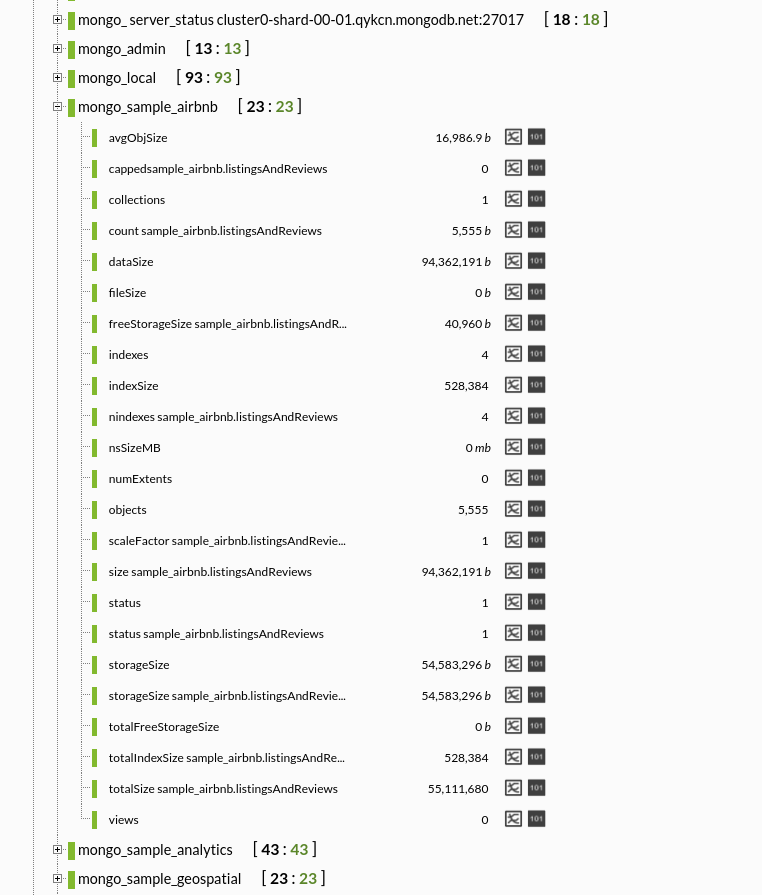
Modules generated
An agent will be created for each database of our cluster with data of the stats of the databases and the collections. And other agent with modules with the data of the server (cluster)
Database modules
| Module name |
| collections |
| views |
| objects |
|
avgObjSize
|
| datasize |
| storagesize |
| totalfreestoragesize |
| numextents |
| indexes |
| indexsize |
| filesize |
| nssizemb |
| status |
Collection modules
| Module name |
| size |
| count |
| avgobjsize |
| storagesize |
| freestoragesize |
| capped |
| nindexes |
| totalindexsizes |
| totalsizes |
| scalefactor |
| status |
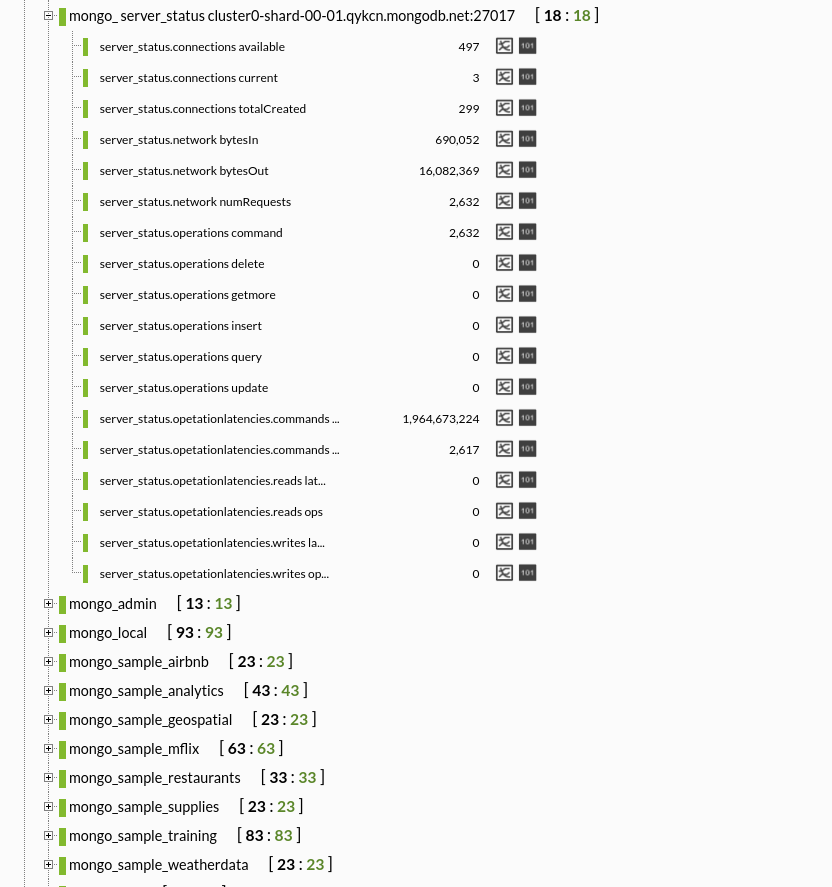
Server modules :
| connections current |
| connections avalaible |
| connections total created |
| network bytes in |
| network bytes out |
| network num requests |
| operations insert |
| operations query |
| operations update |
| operations delete |
| operations get more |
| operations command |
| writes latency |
| writes ops |
| reads latency |
| reads ops |
| commands latency |
| commands ops |