Meraki
Plugin with which it is possible to monitor Meraki devices.
- Introduction
- Compatibility matrix
- Pre requisites
- Parameters
- Manual execution
- Configuration in PandoraFMS
- Agents and modules generated by the plugin
Introduction
The purpose of this plugin is to monitor meraki devices, appliance, switch and wireless.
The plugin connects with the rest api of Meraki, in order to obtain all the metrics.
Compatibility matrix
| Systems where tested | Rocky linux, Fedora 34 |
| Systems where it works | Any linux system |
Pre requisites
- Connectivity to the endpoints provided by the API is required.
- A bearer token is required for authentication.
- Groups of agents must be defined as groups of agents, groups whose name contains the store code.
- The plugin server must be enabled in the environment.
- The dataserver must be enabled in the environment.
Parameters
Meraki connection parameters
| --url | API connection url, example : https://api.meraki.com/api/v1 . Default: https://api.meraki.com/api/v1 |
| --token | Token bearer required for authentication |
| --id | Store ID, which will identify if the group exists in Pandora and will create the agent in it, and if the network exists in Meraki. |
| --organization | ID of the organization in which the networks will be scanned. |
| --timespan | Monitoring interval for switch port statistics. |
Parámetros configuración Pandora
| --agent_prefix |
Prefix for all agents created by the plugin |
| --module_prefix | Prefix for all modules created by the plugin |
| --location | Secondary groups added to the agent |
| --interval | Agent monitoring interval |
| --temporal | PandoraFMS temporary directory |
| --data_dir |
PandoraFMS Data Directory |
| --group | Agent group. |
| --transfer_mode |
Data transfer mode, local or tentacle |
| --tentacle_client |
Tentacle client path, by default “tentacle_client”. |
| --tentacle_opts |
Additional tentacle options |
| --tentacle_port |
Tentacle Port |
| --tentacle_address |
tentacle IP |
Parámetros Extra
| --scan_appliance | Disable scanning of appliance devices with 0. Default enabled to 1. |
| --scan_switch | Disable scanning of switch devices with 0. By default set to 1. |
| --scan_wireless | Disable scanning of wireless devices with 0. Default enabled to 1. |
| --log_file | Path where the log file will be saved, for example : /tmp/meraki_logfile.txt |
Manual execution
The plugin execution format is as follows:
./pandora_meraki --id < id > --url < url > --token < token > --location < location > --organization < organization > --timespan < interval switch port data monitoring in seconds >
--module_prefix < module prefix > --agent_prefix < agent prefix >
[ --scan_appliance < 1 or 0 > ] [ --scan_switch < 1 or 0 > ] [ --scan_wireless < 1 or 0 > ]
[ --transfer_mode < local o tentacle > ] [ --tentacle_port < tentacle_port > ] [ --tentacle_address < tentacle_address > ] [ --tentacle_client < tentacle client path ] [ --tentacle_opts < tentacle extra options ]
[ --data_dir < data dir > ] [ --group < group > ] [ --temporal < temporary directory path > ] [ --interval < interval agent monitorings in seconds > ] [--log_file < log file >]
Configuration in PandoraFMS
To configure the plugin in PandoraFMS, the following steps must be followed:
1. Upload the plugin to PandoraFMS, for example in the following path:
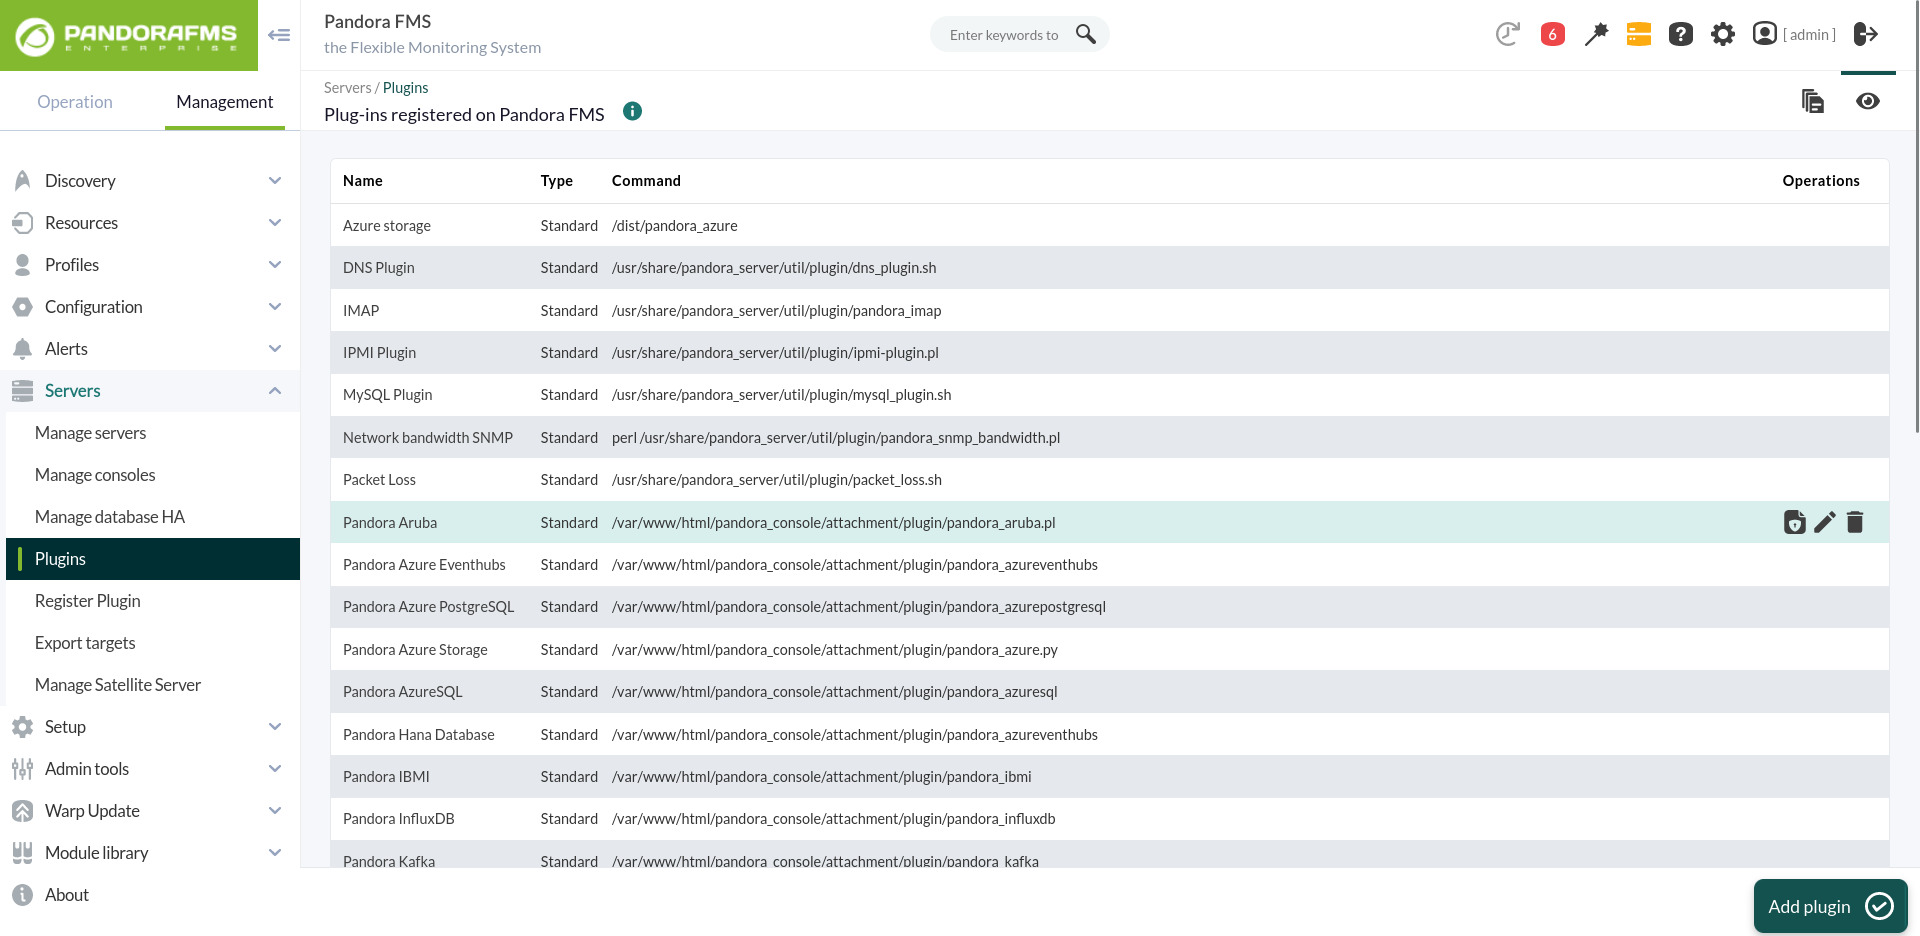
/usr/share/pandora_server/util/plugin2. Go to the plugins section and create a new one:
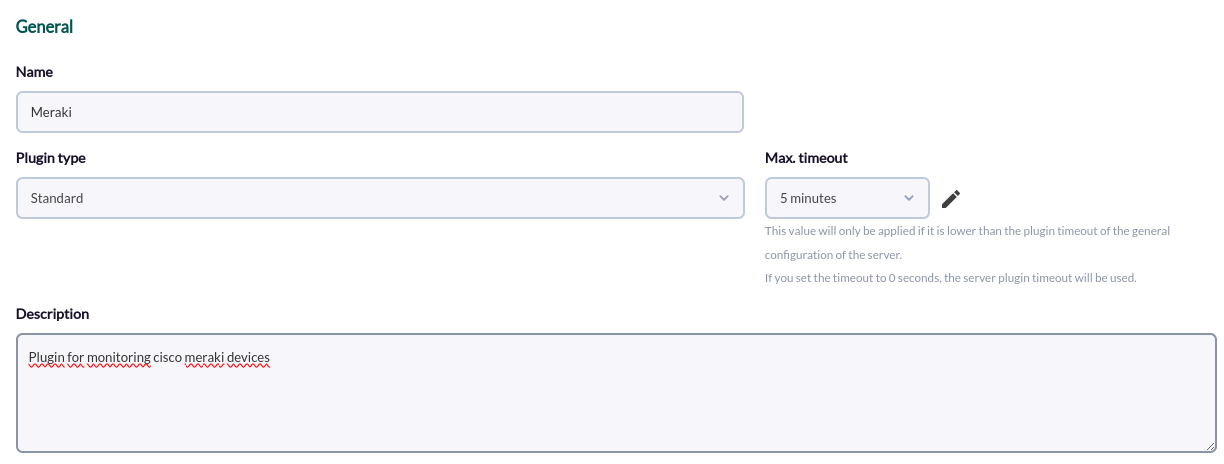
3. Name, description and timeout are added:
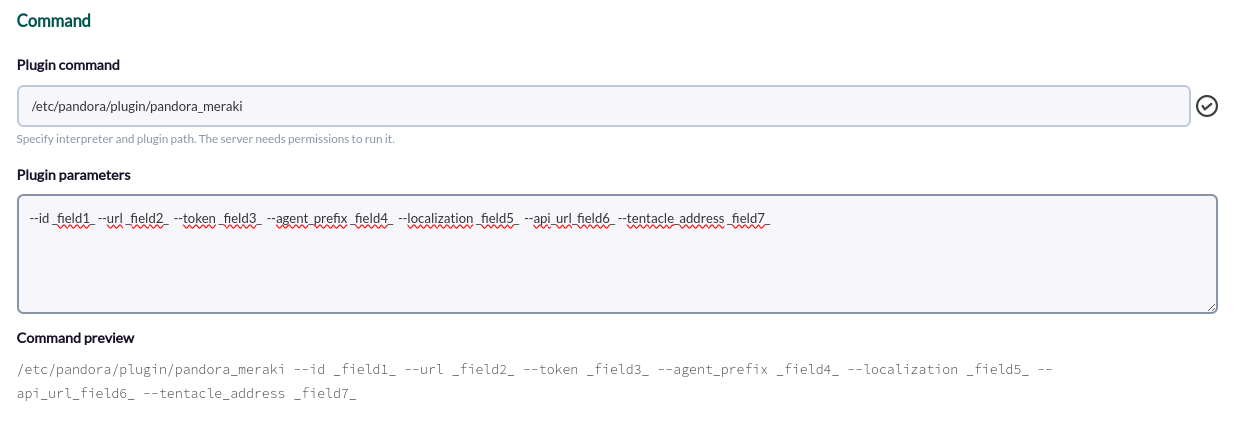
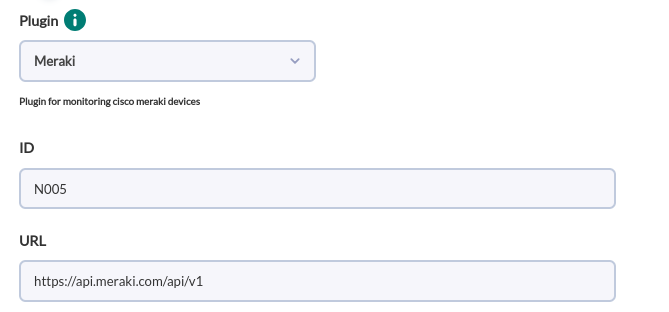
4. The path of the plugin is added to the command and the necessary parameters for its execution.
For each parameter a macro must be configured, being the syntax of this macro the following : _fieldx_, being x the positional number of the parameter, for example in the following image we see the parameters that are mandatory, --id, --url, --token, --agent_prefix, --localization and --tentacle_address since all the others can be used with the default values.
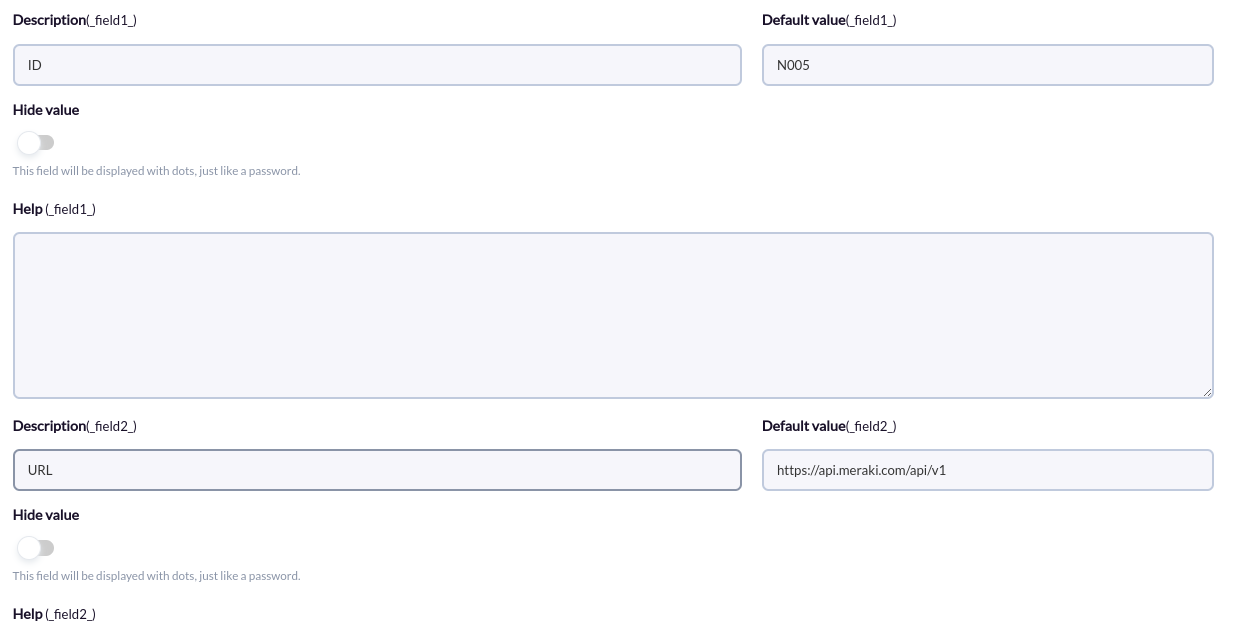
5. The above macros are configured, adding in each one the value of the parameter:
6. Once configured, you should create a module in an agent that executes the plugin. In the modules menu of an agent we create a new plugin type module:
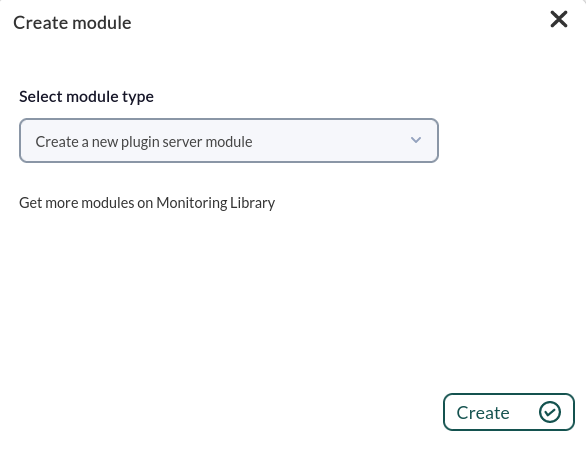
7. In the module configuration menu, we name it, select the plugin configured before and click on “create”.
8. The agents will be created in the next execution of the plugin:
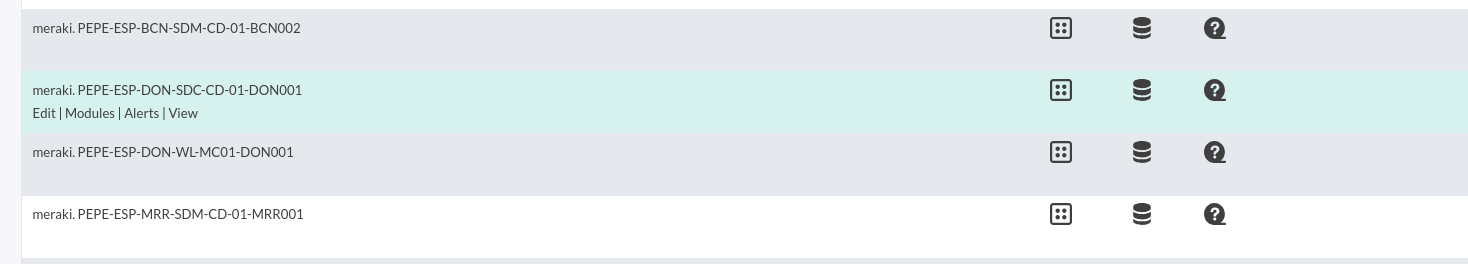
Agents and modules generated by the plugin
Running the plugin with the monitoring of all types of device abilities will create the following agents:
- One agent for each appliance type device , will be created in the specified groups, and will contain the IP.
| < prefix >< switch name > |
With the following modules
| < module prefix >status | Device status, 1 if online, 0 otherwise. |
| < module prefix >perfScore | Indicates how busy the device is. |
And one for each interface :
| < module prefix >< interface name > | Interface status. |
- One agent for each switch type device, will be created in the specified groups, and will contain the IP.
| < prefix >< switch name > |
With the following modules
| < prefix module >status | Device status, 1 if online, 0 otherwise. |
And the following for each port:
| < port ID >_ifOperStatus | 1 if enabled, 0 if not enabled |
| < port ID >.ifInOctets | Total traffic sent in kb |
| < port ID >.T_ifOutOctets | Total traffic received in kb |
- An agent for each wireless device , will be created in the specified groups, and will contain the IP
| < prefix >< name switch > |
With the following modules
| < module prefix >status | Device status, 1 if online, 0 otherwise. |
| < module prefix >totalKbps | Kb of total last day usage |
| < module prefix >sentKbps | Kb of usage on the last day sent |
| < module prefix >receivedKbps | Kb of usage on the last day received |
| < module prefix >clientCount | Total customer connections |