# KVM monitoring plugin

# Introduction

This guide allows you to monitor the status of a running KVM environment from PandoraFMS.

The following commands are used to retrieve information about the status of KVM virtual machines (VMs):

- **virsh:** Used to retrieve the status of the virtual machines and their performance metrics.
- **libvirtd:** Used to check the server status and the resources being consumed.

# Compatibility matrix

<table border="1" id="bkmrk-%C2%A0-systems-where-it-h" style="border-collapse: collapse; width: 100%;"><colgroup><col style="width: 50%;"></col><col style="width: 50%;"></col></colgroup><tbody><tr><td class="align-center">**Systems where it has been tested**

</td><td>- Centos
- Ubuntu 24.04
- Rocky Linux 9

</td></tr><tr><td class="align-center">**Systems where it should work**</td><td>- Linux based systems

</td></tr></tbody></table>

# Prerequisites

In order to configure the plugin you will need:

- A PandoraFMS Endpoint deployed in your system
- Perl 5.x or higher
- Unzip command (For the collection deployment)
- The user used to launch the plugin should be able to launche virsh command and connect to the libvirtd instance.

# Deployment and configuration

The plugin can be deployed by uploading it manually or by deploying it through collections on the Endpoints.

\----

Once deployed, it must be configured in the **Plugins** section of the Endpoint.

[![imagen (4).png](https://pandorafms.com/guides/public/uploads/images/gallery/2026-08/scaled-1680-/toCimagen-4.png)](https://pandorafms.com/guides/public/uploads/images/gallery/2026-08/toCimagen-4.png)
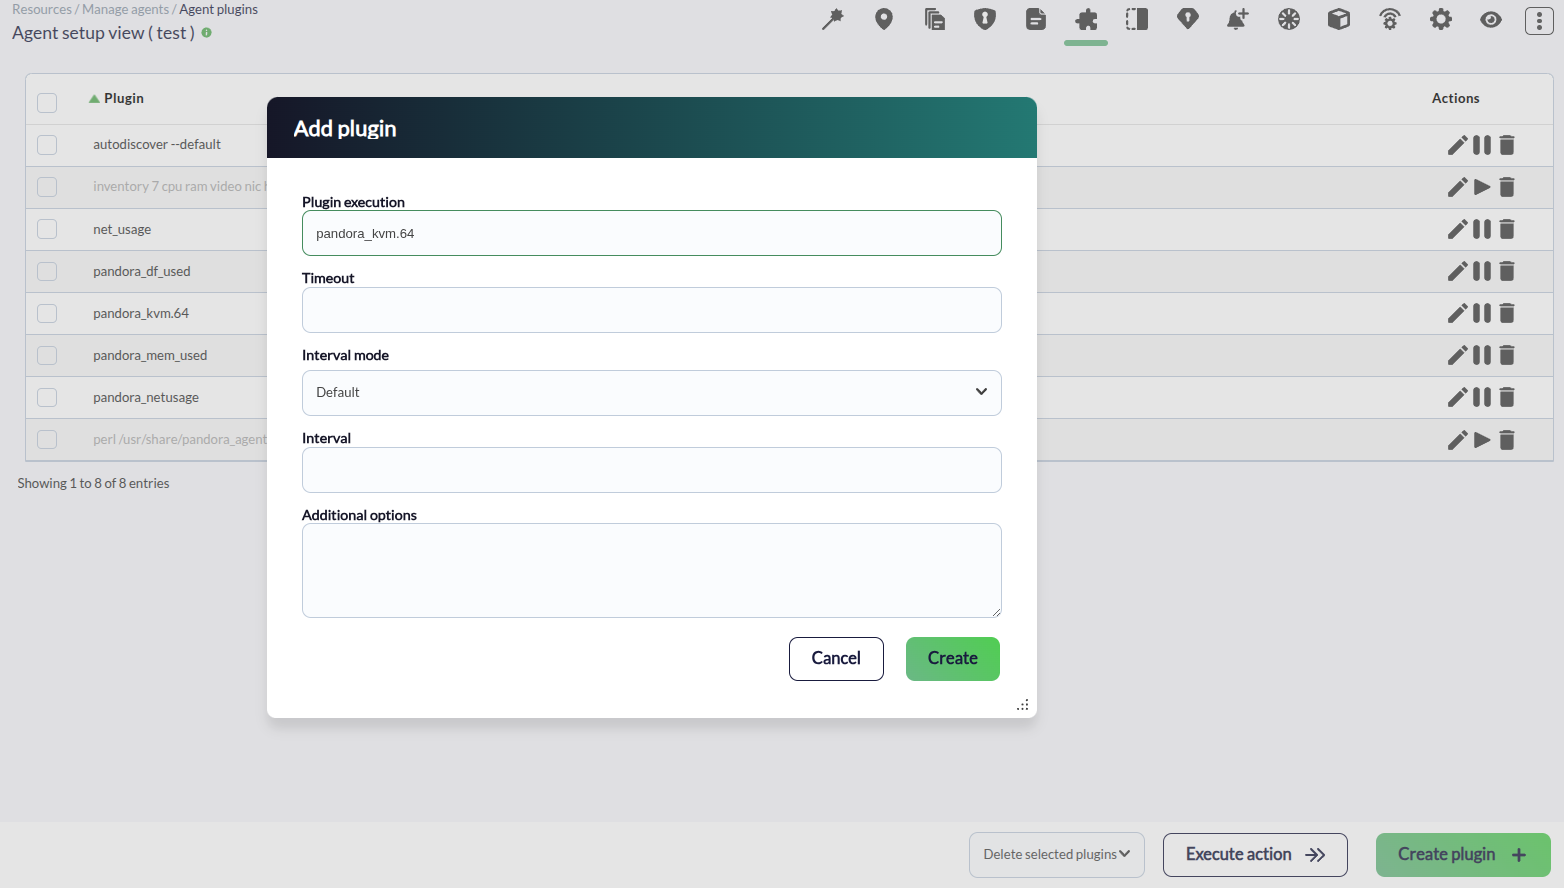
If you want to monitor multiple KVM server instances with a single execution, or a remote instance, you can specify the set of servers in the configuration file as follows:

```bash
user@server
```

<p class="callout info">Recuerda que el acceso SSH al servidor remoto debe realizarse sin intervención del usuario, por lo que debes copiar la clave SSH del equipo que ejecuta el script a los servidores de destino.</p>

# Examples

You can launch the script manually:

```bash
./pandora_kvm.64 [kvm.conf]
```

For example, this is the output as XML dump of the modules generated by the plugin.

```bash
<module>
    <name><![CDATA[(local) KVM Server status]]></name>
    <type></type>
    <data><![CDATA[1]]></data>
    <description><![CDATA[Status of the KVM server. 1 instances of libvirtd]]></description>
    <module_group>KVM</module_group>
</module>
<module>
    <name><![CDATA[(local) KVM Server RAM usage]]></name>
    <type>generic_data</type>
    <data><![CDATA[0]]></data>
    <description><![CDATA[RAM usage by the KVM server]]></description>
    <module_group>KVM</module_group>
</module>
<module>
    <name><![CDATA[(local) KVM Server CPU usage]]></name>
    <type>generic_data</type>
    <data><![CDATA[0]]></data>
    <description><![CDATA[CPU usage by the KVM server]]></description>
    <module_group>KVM</module_group>
</module>
<module>
    <name><![CDATA[(local) Number of VMs]]></name>
    <type>generic_data</type>
    <data><![CDATA[2]]></data>
    <description><![CDATA[Shows the number of available VMs in the KVM system]]></description>
    <module_group>KVM</module_group>
</module>
<module>
    <name><![CDATA[(local) Status of ubuntu22.04]]></name>
    <type>generic_proc</type>
    <data><![CDATA[1]]></data>
    <description><![CDATA[Status of ubuntu22.04: running]]></description>
    <module_group>KVM</module_group>
</module>
<module>
    <name><![CDATA[(local) Status of crc]]></name>
    <type>generic_proc</type>
    <data><![CDATA[0]]></data>
    <description><![CDATA[Status of crc: shut]]></description>
    <module_group>KVM</module_group>
</module>
<module>
    <name><![CDATA[(local) CPU usage of ubuntu22.04]]></name>
    <type></type>
    <data><![CDATA[4,5]]></data>
    <description><![CDATA[CPU usage of ubuntu22.04]]></description>
    <module_group>KVM</module_group>
</module>
<module>
    <name><![CDATA[(local) Virtual CPU usage of ubuntu22.04]]></name>
    <type></type>
    <data><![CDATA[0,5]]></data>
    <description><![CDATA[Virtual CPU usage of ubuntu22.04]]></description>
    <unit><![CDATA[%]]></unit>
    <module_group>KVM</module_group>
</module>
<module>
    <name><![CDATA[(local) Virtual memory usage of ubuntu22.04]]></name>
    <type></type>
    <data><![CDATA[100.00]]></data>
    <description><![CDATA[Mem usage of ubuntu22.04 4194304 of 4194304]]></description>
    <unit><![CDATA[%]]></unit>
    <module_group>KVM</module_group>
</module>
```

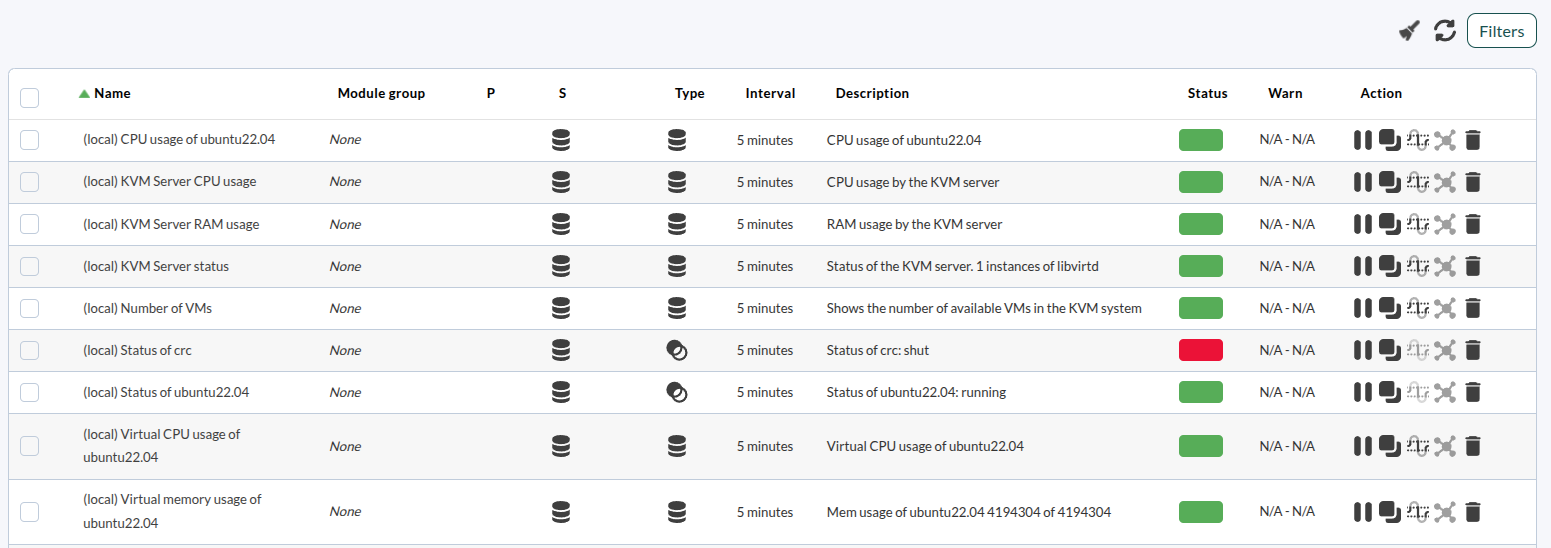
And these are the modules in the PandoraFMS console:

[![imagen (3).png](https://pandorafms.com/guides/public/uploads/images/gallery/2026-08/scaled-1680-/imagen-3.png)](https://pandorafms.com/guides/public/uploads/images/gallery/2026-08/imagen-3.png)