KVM monitoring plugin
This plugin allows you to monitor the status of a running KVM environment with PandoraFMS
Introduction
This guide allows you to monitor the status of a running KVM environment from PandoraFMS.
The following commands are used to retrieve information about the status of KVM virtual machines (VMs):
-
virsh: Used to retrieve the status of the virtual machines and their performance metrics.
-
libvirtd: Used to check the server status and the resources being consumed.
Compatibility matrix
|
Systems where it has been tested |
|
| Systems where it should work |
|
Prerequisites
In order to configure the plugin you will need:
- A PandoraFMS Endpoint deployed in your system
- Perl 5.x or higher
- Unzip command (For the collection deployment)
- The user used to launch the plugin should be able to launche virsh command and connect to the libvirtd instance.
Deployment and configuration
The plugin can be deployed by uploading it manually or by deploying it through collections on the Endpoints.
----
Once deployed, it must be configured in the Plugins section of the Endpoint.
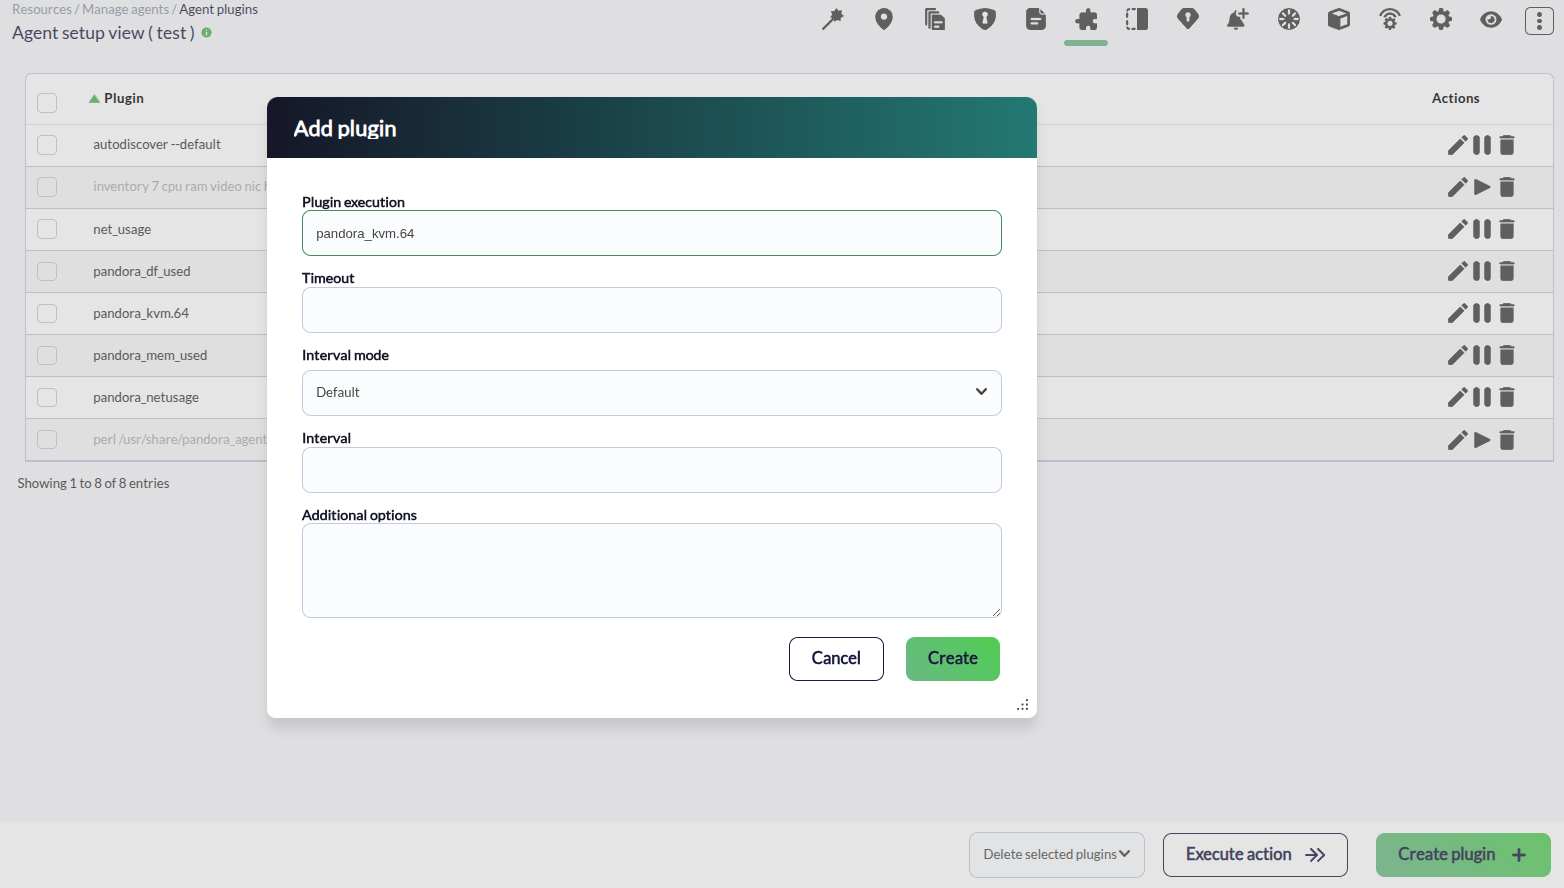
If you want to monitor multiple KVM server instances with a single execution, or a remote instance, you can specify the set of servers in the configuration file as follows:
user@serverRecuerda que el acceso SSH al servidor remoto debe realizarse sin intervención del usuario, por lo que debes copiar la clave SSH del equipo que ejecuta el script a los servidores de destino.
Examples
You can launch the script manually:
./pandora_kvm.64 [kvm.conf]For example, this is the output as XML dump of the modules generated by the plugin.
<module>
    <name><![CDATA[(local) KVM Server status]]></name>
    <type></type>
    <data><![CDATA[1]]></data>
    <description><![CDATA[Status of the KVM server. 1 instances of libvirtd]]></description>
    <module_group>KVM</module_group>
</module>
<module>
    <name><![CDATA[(local) KVM Server RAM usage]]></name>
    <type>generic_data</type>
    <data><![CDATA[0]]></data>
    <description><![CDATA[RAM usage by the KVM server]]></description>
    <module_group>KVM</module_group>
</module>
<module>
    <name><![CDATA[(local) KVM Server CPU usage]]></name>
    <type>generic_data</type>
    <data><![CDATA[0]]></data>
    <description><![CDATA[CPU usage by the KVM server]]></description>
    <module_group>KVM</module_group>
</module>
<module>
    <name><![CDATA[(local) Number of VMs]]></name>
    <type>generic_data</type>
    <data><![CDATA[2]]></data>
    <description><![CDATA[Shows the number of available VMs in the KVM system]]></description>
    <module_group>KVM</module_group>
</module>
<module>
    <name><![CDATA[(local) Status of ubuntu22.04]]></name>
    <type>generic_proc</type>
    <data><![CDATA[1]]></data>
    <description><![CDATA[Status of ubuntu22.04: running]]></description>
    <module_group>KVM</module_group>
</module>
<module>
    <name><![CDATA[(local) Status of crc]]></name>
    <type>generic_proc</type>
    <data><![CDATA[0]]></data>
    <description><![CDATA[Status of crc: shut]]></description>
    <module_group>KVM</module_group>
</module>
<module>
    <name><![CDATA[(local) CPU usage of ubuntu22.04]]></name>
    <type></type>
    <data><![CDATA[4,5]]></data>
    <description><![CDATA[CPU usage of ubuntu22.04]]></description>
    <module_group>KVM</module_group>
</module>
<module>
    <name><![CDATA[(local) Virtual CPU usage of ubuntu22.04]]></name>
    <type></type>
    <data><![CDATA[0,5]]></data>
    <description><![CDATA[Virtual CPU usage of ubuntu22.04]]></description>
    <unit><![CDATA[%]]></unit>
    <module_group>KVM</module_group>
</module>
<module>
    <name><![CDATA[(local) Virtual memory usage of ubuntu22.04]]></name>
    <type></type>
    <data><![CDATA[100.00]]></data>
    <description><![CDATA[Mem usage of ubuntu22.04 4194304 of 4194304]]></description>
    <unit><![CDATA[%]]></unit>
    <module_group>KVM</module_group>
</module>
And these are the modules in the PandoraFMS console:
