Kubernetes
This document describes the Kubernetes functionality of PandoraFMS discovery.
- Introduction
- Prerrequisites
- Parameters and configuration
- Manual execution
- Discovery
- Agents and modules generated by the plugin
Introduction
The purpose of this plugin is to monitor Kubernetes nodes and pods, using key metrics regarding the CPU, memory, status of these and the containers of a pod, which are essential to control and track these resources.
The plugin connects to the Kubernetes REST API and monitors the environment using the aforementioned metrics, generating an agent for each zone and instance via XML that is sent to the Pandora server.
Prerrequisites
- Kubernetes API Connectivity
The plugin must be able to reach API remotely in order to extract the information. - Permissions
To make requests through the API, the account used to authenticate during execution requires certain permissions.
Permission Assignment
The steps to follow to create a user with sufficient permissions to obtain the monitoring data are described below.
1.Creation of a reading "Cluster role". A .yaml file must be created with the following content :.
apiVersion: rbac.authorization.k8s.io/v1
kind: ClusterRole
metadata:
  name: node-reader
rules:
- apiGroups: [""]
  resources: ["nodes"]
  verbs: ["get", "list"]

---

apiVersion: rbac.authorization.k8s.io/v1
kind: ClusterRole
metadata:
  name: pod-reader
rules:
- apiGroups: [""]
  resources: ["pods"]
  verbs: ["get", "list"]

---

apiVersion: rbac.authorization.k8s.io/v1
kind: ClusterRole
metadata:
  name: deployment-reader
rules:
- apiGroups: ["apps"]
  resources: ["deployments"]
  verbs: ["get", "list"]

---

apiVersion: rbac.authorization.k8s.io/v1
kind: ClusterRole
metadata:
  name: metrics-reader
rules:
- apiGroups: ["metrics.k8s.io"]
  resources: ["*"]
  verbs: ["get", "list"]

---

apiVersion: rbac.authorization.k8s.io/v1
kind: ClusterRole
metadata:
  name: namespace-reader
rules:
- apiGroups: [""]
  resources: ["namespaces"]
  verbs: ["get", "list"]

---

apiVersion: rbac.authorization.k8s.io/v1
kind: ClusterRole
metadata:
  name: component-status-reader
rules:
- apiGroups: [""]
  resources: ["componentstatuses"]
  verbs: ["get", "list"]

---

apiVersion: rbac.authorization.k8s.io/v1
kind: ClusterRoleBinding
metadata:
  name: node-reader-binding
subjects:
- kind: ServiceAccount
  name: default
  namespace: default
roleRef:
  kind: ClusterRole
  name: node-reader
  apiGroup: rbac.authorization.k8s.io

---

apiVersion: rbac.authorization.k8s.io/v1
kind: ClusterRoleBinding
metadata:
  name: pod-reader-binding
subjects:
- kind: ServiceAccount
  name: default
  namespace: default
roleRef:
  kind: ClusterRole
  name: pod-reader
  apiGroup: rbac.authorization.k8s.io

---

apiVersion: rbac.authorization.k8s.io/v1
kind: ClusterRoleBinding
metadata:
  name: deployment-reader-binding
subjects:
- kind: ServiceAccount
  name: default
  namespace: default
roleRef:
  kind: ClusterRole
  name: deployment-reader
  apiGroup: rbac.authorization.k8s.io

---

apiVersion: rbac.authorization.k8s.io/v1
kind: ClusterRoleBinding
metadata:
  name: metrics-reader-binding
subjects:
- kind: ServiceAccount
  name: default
  namespace: default
roleRef:
  kind: ClusterRole
  name: metrics-reader
  apiGroup: rbac.authorization.k8s.io

---

apiVersion: rbac.authorization.k8s.io/v1
kind: ClusterRoleBinding
metadata:
  name: namespace-reader-binding
subjects:
- kind: ServiceAccount
  name: default
  namespace: default
roleRef:
  kind: ClusterRole
  name: namespace-reader
  apiGroup: rbac.authorization.k8s.io

---

apiVersion: rbac.authorization.k8s.io/v1
kind: ClusterRoleBinding
metadata:
  name: component-status-reader-binding
subjects:
- kind: ServiceAccount
  name: default
  namespace: default
roleRef:
  kind: ClusterRole
  name: component-status-reader
  apiGroup: rbac.authorization.k8s.io

---

apiVersion: rbac.authorization.k8s.io/v1
kind: ClusterRole
metadata:
  name: node-reader
rules:
- apiGroups: [""]
  resources: ["nodes"]
  verbs: ["get", "list"]
- nonResourceURLs: ["/healthz", "/healthz/ping", "/healthz/log", "/healthz/etcd", "/healthz/poststarthook/crd-informer-synced", "/healthz/poststarthook/generic-apiserver-start-informers", "/healthz/poststarthook/start-apiextensions-controllers", "/healthz/poststarthook/start-apiextensions-informers"]
  verbs: ["get"]

---

apiVersion: rbac.authorization.k8s.io/v1
kind: ClusterRole
metadata:
  name: service-reader
rules:
- apiGroups: [""]
  resources: ["services"]
  verbs: ["get", "list", "watch"]
- nonResourceURLs: ["/api/v1/services"]
  verbs: ["get"]

---

apiVersion: rbac.authorization.k8s.io/v1
kind: ClusterRoleBinding
metadata:
  name: service-reader-binding
subjects:
- kind: ServiceAccount
  name: default
  namespace: default
roleRef:
  kind: ClusterRole
  name: service-reader
  apiGroup: rbac.authorization.k8s.io
2. The cluster role must then be applied:
kubectl apply -f file.yaml- Install metrics server
To install the “metrics-server” addon, it will be necessary to download it in the Kubernetes environment. You can get it from their github project:
https://github.com/kubernetes-incubator/metrics-server
kubectl apply -f https://github.com/kubernetes-sigs/metrics-server/releases/latest/download/components.yamlYou can verify that the deployment has been successful if when you launch the following command the status of your API appears as “true”:
kubectl get apiservices | grep metrics-server
v1beta1.metrics.k8s.io    kube-system/metrics-server True 1m
If the deployment is successful, the metrics-server API should be accessible:
kubectl get --raw "/apis/metrics.k8s.io/v1beta1/"
{"kind":"APIResourceList","apiVersion":"v1","groupVersion":"metrics.k8s.io/v1beta1","res
ources":[{"name":"nodes","singularName":"","namespaced":false,"kind":"NodeMetrics
","verbs":["get","list"]},{"name":"pods","singularName":"","namespaced":true,"kind":"P
odMetrics","verbs":["get","list"]}]}Additionally, after a few seconds, you should be able to obtain CPU and memory usage data for containers and nodes:
$ kubectl top node
NAMECPU(cores) CPU%MEMORY(bytes)MEMORY%
kube93m968Mi56%4%
$ kubectl top pod
NAMECPU(cores)MEMORY(bytes)
pod10m3Mi
pod20m3Mi
pod30m2Mi
pod40m3Mi
pod50m1MiParameters and configuration
Parameters
| --conf | Path to configuration file |
Configuration file (--conf)
ip               = < IP or Kubernetes host >
port             = <Kubernetes host port>
token            = <Authentication Bearer Token>
connection       = < Connection mode, normal or proxy >
use_proxy        = < Activate with 1 to enable the use of the proxy. >
proxy            = <connection url>
interval         = < Interval in seconds for agents and for metric analysis >
agent_group_name = < Name of the target group for the created agents >
use_prefix       = < Activate with 1 to enable the use of the proxy. >
prefix           = < Prefix for the agents >
filter_namespace = < Specify namespaces to filter. Specify within square brackets the namespaces enclosed in quotation marks and separated by commas. >
transfer_mode    = < Transfer mode, tentacle or local >
data_dir         = < (Only activated if the transfer_mode is local) Destination path for the XML of each agent, by default "/var/spool/pandora/data_in/" >
tentacle_ip      = < IP of the target machine for the created agents >
tentacle_port    = <tentacle port, default: 41121>
deployments      = < Enable with 1 to enable deployment monitoring >
nodes            = < Enable with 1 to enable nodes monitoring >
pods             = < Enable with 1 to enable pod monitoring >
Example
ip               = 192.168.49.2
port             = 8443
token            = eyJhbGciOiJSUzI1NiIsImtpZCI6IkVpeVhfTFFzSWpmcGtjZzM0blZrZDY3YUtMbzNqTWZmcmdLZ2NKblVHbTgifQ.eyJpc3MiOiJrdWJlcm5ldGVzL3NlcnZpY2VhY2NvdW50IiwisInN1YiI6InN5c3RlbTpzZXJ2aWNlYWNjb3VudDpkZWZhdWx0OmRlZmF1bHQifQ.aC1lPbS5kYR9Fg9hXJaPiQ8cHzjdWlaAfXdPlmPok6LRX0_OZESEhw8to4PZrz2vzt_BUbawUR0NOpHadujHIx7as4Jm8UCRHgmGseyB7mae9vRMFiD1B4EeH5L8lvucydlV2Avx1IV9SyssbypwGCH_jg7tfKz4EMz5aBfgipliRwFaRGdQMX5sjz4AknGxcb2UVOe9LFb_xC-awDEjaGvm_F0tSLxtyGPoJmsvknNmEC9hJLG_AU8Z9Ke5I5oTvEzRmUCqrKz6319p-x9aaF6yUfOFtlnQlLhIz2xkOs8DkkJ1Rk59i2MolzXGwmlGgWkgc7qCgvqXQNjDeX3ySA
connection       = normal
use_proxy        = 0
proxy            =
filter_namespace = ["Jenkins","Glotka"]
interval         = 300
agent_group_name = kubernetes
use_prefix       = 1
prefix           = kube.
transfer_mode    = tentacle
data_dir         = /var/spool/pandora/data_in
tentacle_ip      = 172.42.42.101
tentacle_port    = 41121

deployments      = 1
nodes            = 1
pods             = 1
Manual execution
The plugin execution format is as follows:
./pandora_kubernetes --conf < ruta al fichero de configuración >For example :
./pandora_kubernetes --conf /usr/share/pandora_server/util/plugin/kubernetes.confThe execution will return an output in JSON format with information about the execution, and will generate an XML file for each monitored agent that will be sent to the Pandora FMS server by the transfer method indicated in the configuration.
For example:
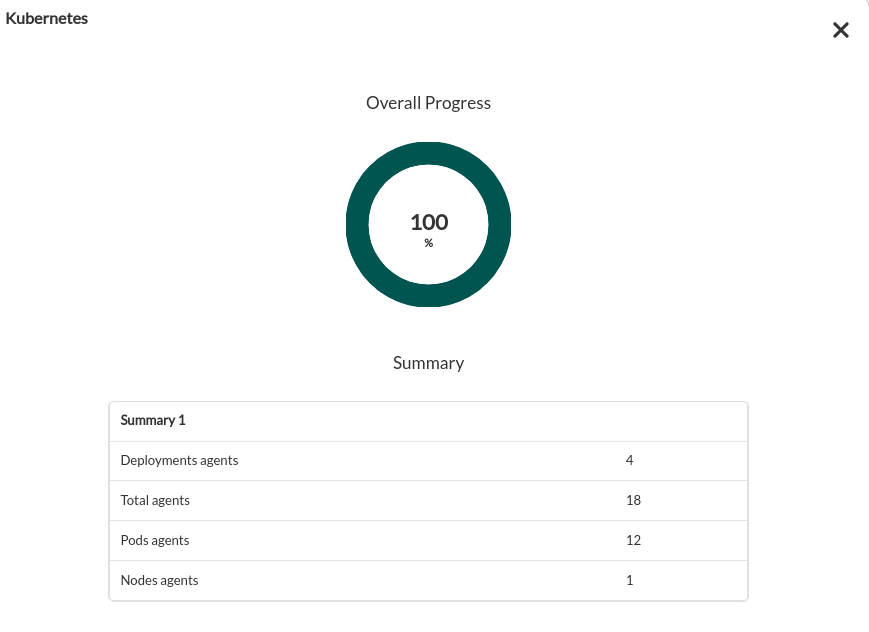
{"summary": {"Total agents": 18, "Nodes agents": 1, "Pods agents": 12, "Deployments agents": 4}}
Discovery
This plugin can be integrated with Pandora FMS Discovery.
To do so, you must load the ".disco" package that you can download from the Pandora FMS library:
https://pandorafms.com/library/kubernetes-discovery/
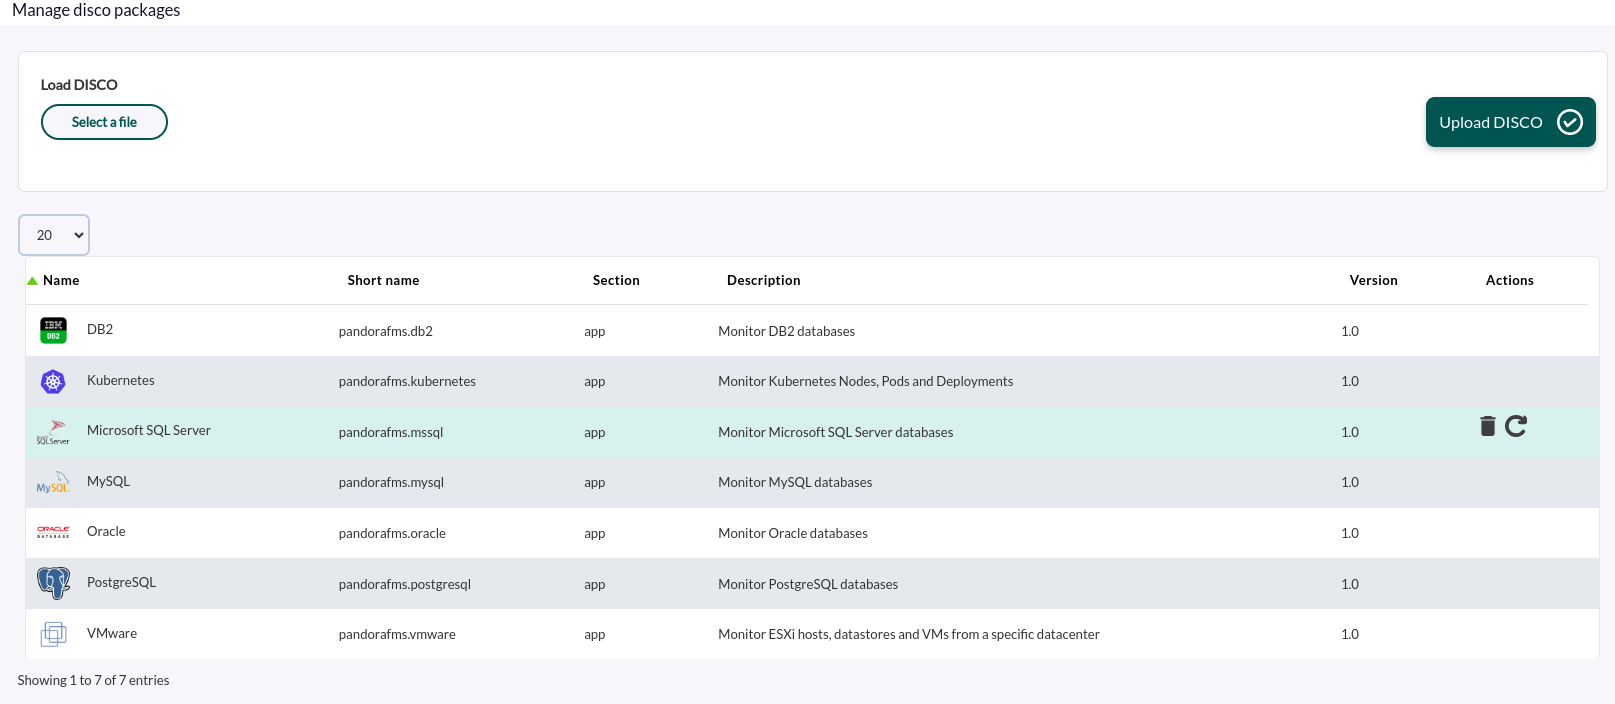
Once loaded, you will be able to monitor Kubernetes environments by creating Discovery tasks from the Management > Discovery > App
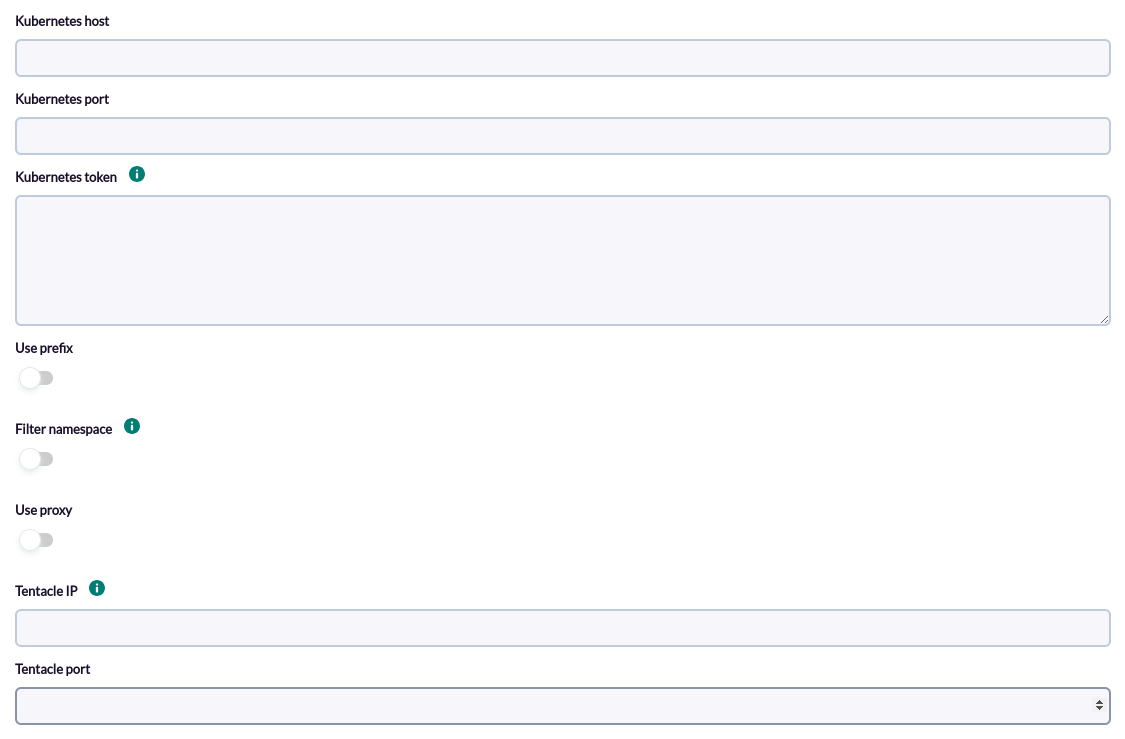
The following minimum data will be requested for each task:
- Kubernetes host: Kubernetes host.
- Kubernetes port: Port used by Kubernetes.
- Kubernetes token : Bearer authentication token, required if not connecting via proxy.
- Use prefix : Check to enable to choose a prefix for the agents.
- Prefix: Prefix chosen for the agents. Enable "Use prefix" to use this option.
- Use proxy: Check to activate the proxy connection.
- Proxy url: Proxy url, it will only be visible if "Use proxy" is checked.
- Filter_namespace: Check to enable the possibility of filtering by namespaces.
- Namespace: Namespaces to filter, specify between square brackets, between quotation marks, separated by commas. Example ["default", "glotka"].
- Tentacle IP : Tentacle server IP to send agent data to. Normally this parameter will not be modified.
- Tentacle port: Tentacle server port to send data to. Normally this parameter will not be modified.
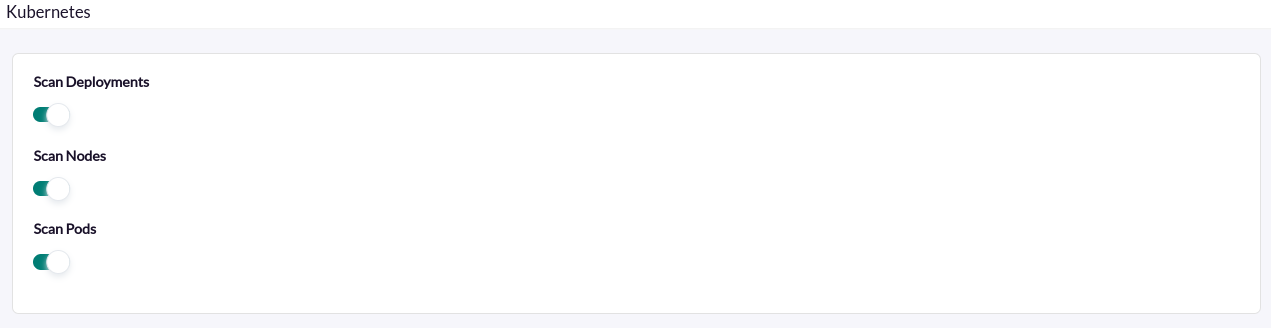
You can also adjust the task settings to customize the desired monitoring:
- Scan Deployments : If activated, it will monitor the deployments and create an agent for each of these.
- Scan Nodes: If activated, it will monitor the nodes and create an agent for each of them.
- Scan Pods: If activated, it will monitor the pods and create an agent for each of them.
Successfully completed tasks will have an execution summary with the following information:
- Total agents: Total number of agents generated by the task.
- Deployment agents: Total number of deployment agents created by the task.
- Pods agents : Total number of pod agents created by the task.
- Nodes Agents: Total number of node agents created by the task.
Agents and modules generated by the plugin
Running the plugin will create the following agents and modules:
- Global agent
| < prefix.Kubernetes > |
Modules
| Api status |
| < Endpoint healthz> |
| Services |
| Namespaces |
| < Component status healthz > |
| Deployments |
- One agent for each deployment
| < prefix. Deployment name> |
Modules
| Replicas |
| Updated replicas |
| Ready replicas |
| Avalaible replicas |
| Unavalaible replicas |
| Available |
| Progressing |
- One agent for each node
| < prefix. Name node > |
Modules
| Pods |
| Pods (%) |
| CPU (cores) |
| CPU (%) |
| Memory (bytes) |
| Memory (%) |
| Condition < condition > status |
- One agent for each pod
| < prefix. Pod name > |
Modules
| Pod status |
| <Condition status> |
| Containers |
| Container <container name> CPU (cores) |
| Container <container name> CPU (%) |
| Container <container name> Memory (bytes) |
| Container <container name> Memory (%) |