Journalctl
This script is designed to facilitate the integration of Linux system logs into Pandora FMS in an automatic and controlled manner. It is intended for administrators who wish to monitor system events directly from the Pandora console.
Introduction
It is intended for administrators who wish to monitor system events directly from the Pandora console.
When executed, the script collects the latest system logs using journalctl and sends them to Pandora FMS as log-type modules. It can be configured to filter relevant information using regular expressions, allowing you to focus only on events that are of real interest (e.g., errors, reboots, or specific alerts).
In short, it is a practical tool for integrating Linux system messages into Pandora FMS, simplifying incident tracking and improving visibility of the infrastructure status.
Parameters
| Parameter | Description |
| '-in', '--regex_in' | Allows only log lines that match a regular expression to be included. This parameter takes precedence over --regex_out (if used, the exclusion filter is ignored). |
| '-out', '--regex_out' | Allows you to exclude log lines that match a regular expression. Only applies if --regex_in has not been defined. |
| '-s', '--source' | Define the name of the source that will be assigned to the module within Pandora FMS. By default, its value is “Journalctl.” |
| '--verbose', '-v' | Enables verbose output mode. Displays additional messages in the console about the actions performed by the script (e.g., filters applied, number of logs processed, errors, etc.). Ideal for debugging or testing. |
Manual execution
The plugin execution format is as follows:
grep_journalctl [-in "<regex_in>"] [-out "<regex_out>"] [-s "<source_name>"] [-v]For example:
grep_journalctl -in "error|fail" -s "SystemErrors" Configuration in PandoraFMS
- Configure the plugin execution in the pandorafms agent.
To do this, you must modify the pandora_agent.conf file, adding a line with the following format:
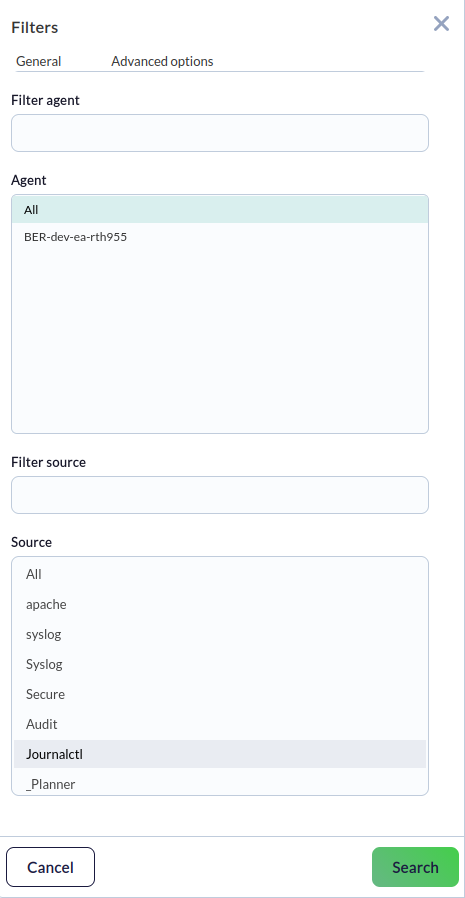
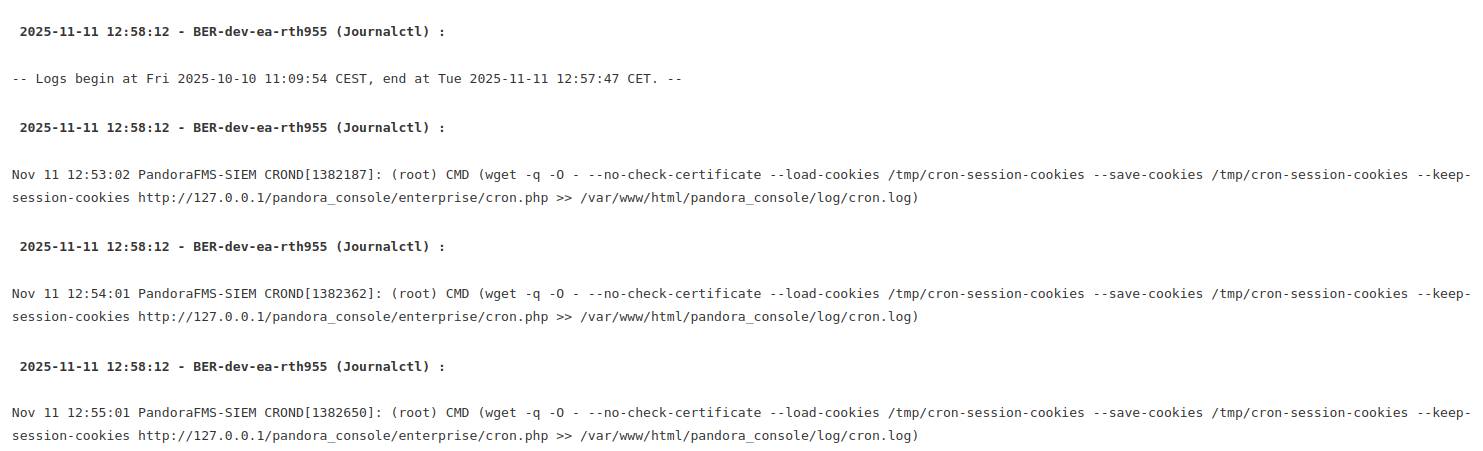
This can also be done from the Console. In the agent settings, go to the plugins option (represented by a puzzle piece icon). There, enter the full path of the plugin and add it. From then on, the plugin will function as a local module.module_plugin <path/plugin with desired parameters for execution configuration> - From the log viewer, select the source configured in the plugin (journalctl by default).

- You will be able to view the logs generated by the plugin.